
|
市場調査レポート
商品コード
1940845
ビジネスジェット:市場シェア分析、業界動向と統計、成長予測(2026年~2031年)Business Jet - Market Share Analysis, Industry Trends & Statistics, Growth Forecasts (2026 - 2031) |
||||||
カスタマイズ可能
適宜更新あり
|
|||||||
| ビジネスジェット:市場シェア分析、業界動向と統計、成長予測(2026年~2031年) |
|
出版日: 2026年02月09日
発行: Mordor Intelligence
ページ情報: 英文 200 Pages
納期: 2~3営業日
|

概要
2026年のビジネスジェット市場規模は265億9,000万米ドルと推定され、2025年の256億9,000万米ドルから成長が見込まれます。
2031年の予測値は315億8,000万米ドルで、2026年から2031年にかけてCAGR3.52%で拡大する見通しです。
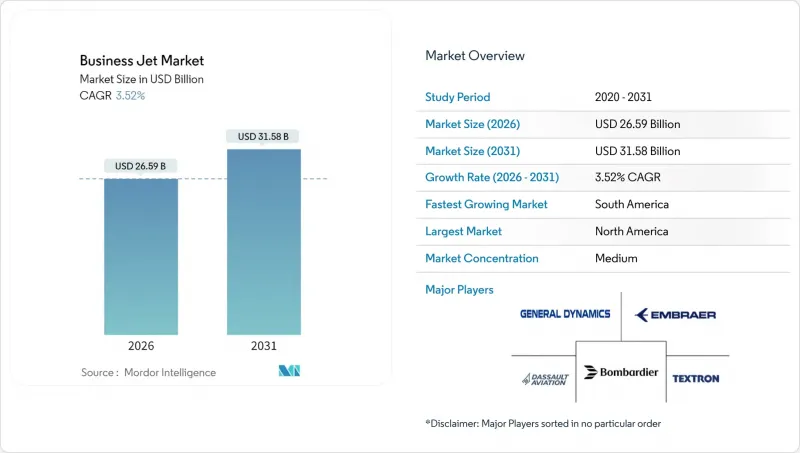
主な成長要因は、機体更新需要、分譲所有権の普及、超長距離路線の開拓です。一方で、高コストな購入費用と厳格化する炭素規制が、市場全体の拡大を緩やかなものにしています。大型キャビン機が需要を牽引し、暗号資産で生み出された富が顧客層を拡大しています。水素電気技術の研究開発が進み、購入者の期待値が変化しつつあります。地域的には北米が依然として中心ですが、南米では農業関連産業による富の創出が地域成長を加速させています。サプライチェーンのボトルネックによりリードタイムが長期化し、購入希望者がチャーター便・会員制・分譲型ソリューションへ移行する中でも、OEMメーカーには価格決定力が生じています。
世界のビジネスジェット市場の動向と洞察
機体更新サイクルの加速
米国におけるビジネスジェットの平均機齢は2024年に18.5年を迎え、燃料費と整備費が急騰する中、運航会社は古い機体の早期更新を迫られています。新型機は最大30%の燃料節約と40%長い整備間隔を実現し、表向きの価格にもかかわらず総所有コストの魅力を高めています。保険会社は旧式機体に対してより高い保険料を課すようになり、経済性をさらに更新方向に傾けています。ハネウェル社は今世紀中に2,800億米ドル規模の更新需要を見込んでおり、大型キャビン機がその大部分を占めます。ハイテクコックピットはパイロット訓練の義務化とも合致し、更新の波をさらに加速させています。
超長距離路線の都市間ネットワーク拡大
ガルフストリームのG700は2024年に65以上の都市間直行記録を樹立し、7,750海里の無着陸飛行が可能な航空機への需要を裏付けました。ボンバルディアの世界の8000は2025年に就航予定で、8,000マイルの航続距離によりニューヨーク~ドバイやロンドン~シンガポール間の無給油飛行を実現します。アジア太平洋地域のオーナー様は、ハブ空港インフラが限られる地域において、時差を効率的に活用できる直行便を高く評価されています。運航会社からは、こうした航空機の稼働率が30~40%向上し、収益性の向上につながっていると報告されています。このような超長距離ミッションの追求により、研究開発費は大型燃料タンクや軽量複合材構造の開発に重点が移っています。
高騰する取得・運用コスト
新機体の定価は年率8~12%上昇し、ジェット燃料Aは2024年に1ガロンあたり6.07米ドルに達しました。部品価格の高騰と技術者不足がコスト圧迫を悪化させており、整備人件費は現在1時間あたり平均138~161米ドルです。保険料は高止まりしており、特に国際線区間の戦争リスク補償は高額です。こうした支出により、新規参入を検討する層は完全所有ではなくチャーター便や会員制プログラムを選択する傾向にあります。新興市場の購入者は、通貨安と限られた資金調達手段により、最も深刻な圧迫を感じています。
セグメント分析
大型キャビンプラットフォームは2025年納入機の81.62%を占め、大陸間路線で給油停止を回避できる機体への買い手の選好を反映しています。このセグメントは、最大19名の乗客をフルフラットの快適性で運ぶ新規参入機材に牽引され、2031年までCAGR3.74%で拡大が見込まれます。ワイドキャビンの設計は、より多くの手荷物、大型ギャレー、専用クルー休憩室を可能にし、夜間移動のミッション能力を強化します。中型ジェット機は、直接運用コストの低減を求める企業シャトル事業者からの一定の需要を維持しており、一方、小型ジェット機は短距離・パイロット所有のミッションに対応しています。
購入者は大型機選定にあたり、ビジネスジェット市場の効率性向上、整備間隔の延長、保険条件の優遇を理由に挙げています。これに対しOEMメーカーは、炭素繊維製薄型翼、高推力エンジン、15時間フライト時の疲労軽減を図る客室高度低減技術で対応しています。機体の老朽化が進むにつれ、運航会社は経済性に飛躍的な変化を認識しています。2005年式機からの更新により、標準的な年間450飛行時間の運用サイクルで250万米ドルの年間運用コスト削減が可能となります。この結果、大型ジェット機カテゴリーは予測期間を大幅に超えても、ビジネスジェット市場の基幹を成し続ける見込みです。
地域別分析
北米は2025年時点で66.25%のシェアを維持しました。これは5,000以上のジェット機対応空港、成熟した分譲所有プログラム、世界最大の超富裕層人口に支えられた結果です。米国企業は直行便による生産性向上を重視し、更新サイクルが受注活動の主流を占めます。カナダとメキシコでは資源開発とニアショアリング供給網による安定した需要が加わります。
南米はブラジルにおけるアグリビジネスの拡大と富裕層の増加を原動力に、2031年までCAGR8.72%で最も急速に成長する地域です。同国では既に約3,000機のビジネス航空機が運用されており、エンブラエル社の現地サポート体制の恩恵を受けています。アルゼンチン、チリ、コロンビアでは鉱業・金融サービスクラスターが成長を牽引。国境を越えた飛行計画規則の改善により、フロリダからの再配置ではなく地域内での航空機配置が増加傾向にあります。
欧州では需要は成熟段階にあるもの、持続可能性への転換が進んでいます。サステナブル航空燃料(SAF)の義務化や将来の水素燃料ハブ構想が購入基準を形作っています。アジア太平洋地域では、中国、インド、東南アジアを中心に年間2.02%の機体数増加率を示しており(世界平均1.36%)、新規空港の導入やスロット規制の緩和により都市間路線が増加しています。中東・アフリカ地域はニッチながら戦略的であり、UAEとサウジアラビアは欧州・アジア・アフリカを結ぶ超長距離路線の中継拠点として機能しております。これらの動向が相まって、西側諸国における更新需要主導の成熟市場と、南側諸国における初期成長市場が均衡する、多様化したビジネスジェット市場を形成しております。
その他の特典:
- エクセル形式の市場予測(ME)シート
- アナリストによる3ヶ月間のサポート
よくあるご質問
目次
第1章 イントロダクション
- 調査の前提条件と市場の定義
- 調査範囲
第2章 調査手法
第3章 エグゼクティブサマリー
第4章 主要産業動向
- 富裕層(HNWI)人口動向
- 北米
- 欧州
- アジア太平洋地域
- 南米
- 中東・アフリカ
第5章 市場情勢
- 市場概要
- 市場促進要因
- 機材更新サイクルの加速
- 超長距離路線の都市間ネットワーク拡大
- 分譲所有プログラムの導入状況
- 水素電気技術の研究開発;環境重視の富裕層(HNWIs)の関心を集める
- 暗号資産による富裕層の需要と目立たない移動手段への関心
- eVTOLビジネスジェット相互乗り入れ提携
- 市場抑制要因
- 高い取得コストと運営コスト
- ICAO CORSIAおよび炭素税の影響
- 企業のESGに基づく運航削減の取り組み
- 持続可能な航空燃料(SAF)の供給ボトルネック
- バリューチェーン分析
- 規制情勢
- テクノロジーの展望
- ポーターのファイブフォース分析
- 新規参入業者の脅威
- 供給企業の交渉力
- 買い手の交渉力
- 代替品の脅威
- 競争企業間の敵対関係
第6章 市場規模と成長予測
- 体型別
- 大型ジェット機
- 中型ジェット機
- ライトジェット/超軽量ジェット
- エンドユーザー別
- 個人所有者
- 企業および法人
- チャーター/エアタクシー事業者
- 教育機関および学術機関
- 政府および特殊任務オペレーター
- 所有形態別
- 新規航空機購入
- 中古品のご購入
- 分譲所有権
- ジェットカード/会員制度
- 地域別
- 北米
- 米国
- カナダ
- メキシコ
- 欧州
- 英国
- フランス
- ドイツ
- イタリア
- スペイン
- ロシア
- オランダ
- その他欧州地域
- アジア太平洋地域
- 中国
- インド
- 日本
- 韓国
- オーストラリア
- シンガポール
- インドネシア
- タイ
- マレーシア
- フィリピン
- その他アジア太平洋地域
- 南米
- ブラジル
- アルゼンチン
- チリ
- コロンビア
- その他南米
- 中東・アフリカ
- 中東
- サウジアラビア
- アラブ首長国連邦
- カタール
- トルコ
- その他中東
- アフリカ
- 南アフリカ
- エジプト
- アルジェリア
- その他アフリカ
- 中東
- 北米
第7章 競合情勢
- 市場集中度
- 戦略的動向
- 市場シェア分析
- 企業プロファイル
- Airbus SE
- Bombardier Inc.
- Cirrus Design Corporation(Aviation Industry Corporation of China)
- Dassault Aviation SA
- Embraer S.A.
- Gulfstream Aerospace Corporation(General Dynamics Corporation)
- Honda Aircraft Company(Honda Motor Co., Ltd.)
- Pilatus Aircraft Ltd.
- Textron Inc.
- The Boeing Company
- Eclipse Aerospace, Inc.
- SyberJet Aircraft(MSC Aerospace)
第8章 市場機会と将来の展望
- ホワイトスペースと未充足ニーズの評価
