
|
市場調査レポート
商品コード
1693910
英国のクイックサービスレストラン:市場シェア分析、産業動向、成長予測(2025~2030年)United Kingdom Quick Service Restaurant - Market Share Analysis, Industry Trends & Statistics, Growth Forecasts (2025 - 2030) |
||||||
カスタマイズ可能
適宜更新あり
|
|||||||
| 英国のクイックサービスレストラン:市場シェア分析、産業動向、成長予測(2025~2030年) |
|
出版日: 2025年03月18日
発行: Mordor Intelligence
ページ情報: 英文 172 Pages
納期: 2~3営業日
|

全表示
- 概要
- 目次
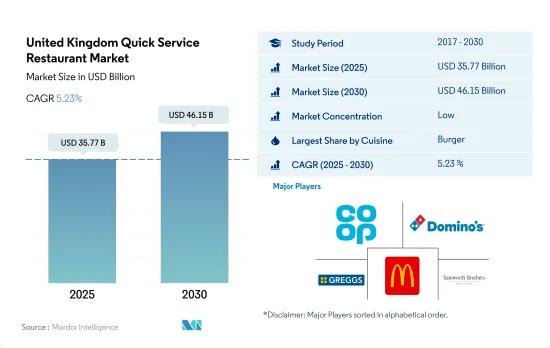
英国のクイックサービスレストラン(QSR)市場規模は2025年に357億7,000万米ドルと推定され、2030年には461億5,000万米ドルに達すると予測され、予測期間中(2025~2030年)のCAGRは5.23%で成長すると予測されます。
消費者のファストフード消費への傾倒が、国内でのファストフード店舗数の増加につながりました。
- 2022年のクイックサービスレストラン全体の売上は2017年比で35.1%増加。QSRの総数は2022年に約3万9,300店に達し、2019年から3,000店以上増加しました。1店舗当たりの1日の注文数は2022年に151件に達し、2019年から約10件増加しました。英国はファストフードの消費量が多く、2022年に成人が毎週食べるファストフードやテイクアウトの食事数は約2,200万食でした。
- 料理のタイプ別では、アイスクリームが予測期間中CAGR 6.30%で最も急成長すると予測されています。国内ではアイスクリームの消費が増加しているため、2021年には1人当たり週平均107gのアイスクリーム製品が消費されるようになりました。人気のあるアイスクリーム販売店には、Ginger's Comfort Emporium、Gelupo、Callestick Farm、Baskin Robbins、Dunkin'Donutsなどがあります。
- ハンバーガーが主要シェアを占め、2020年比で2021年の売上高は39.91%増加しました。同国におけるハンバーガー消費の増加により、英国の平均的な消費量は年間1キログラム以上、1週間あたり約25グラムで、2019年の1週間あたり19グラムから2021年には増加しました。
- チキンウィング、チキンナゲット、チキンロリポップなどの肉ベースの料理も同国で人気があり、同国では肉の消費量が多いことから、2022年の販売額は2019年比で18.9%の騰勢を観測しました。例えば英国では、2020年に国民一人当たりの鶏肉消費量は32.7kgに達しました。さらに、McDonald's、KFC、Subwayのような人気ファーストフードチェーンの特別なレシピと味が消費者に好まれ、売上にプラスの影響を与えています。
英国クイックサービスレストラン市場動向
英国のQSR市場は5年間で10%成長、フランチャイズ展開と世界ブランドが牽引
- 英国のQSR数は2017~2022年にかけて約10%増加したが、これはフランチャイジー店舗数の増加と進出企業の増加によるものです。2023年1月現在、マクドナルドの店舗数は約1,382店、バーガーキングの店舗数は517店、KFCの店舗数は1,005店です。世界の存在感とマーケティング力が、英国におけるQSRの成長に貢献しています。これらのブランドは、ブランドの知名度とマーケティング力を活用することで、英国市場への参入に成功し、QSR市場で大きなシェアを獲得することができました。
- 立地別では、独立型レストランが2022年に金額シェアの72.35%以上を獲得しました。独立型飲食店は、大都市圏、郊外のストリップ・モール、地方など、さまざまな場所で見かけることができます。一般的に、ハンバーガー、サンドイッチ、サラダなど、手軽に調理できる限られたメニューを提供しています。クイックサービスレストランは顧客に価値ある独特のサービスを提供することができ、個人的でユニークな便利で迅速な食事体験を提供することができます。
- 英国の持ち帰り産業は、パンデミック時のファーストフード需要の増加と消費者の嗜好の変化により拡大したが、QSRは2020年に閉店により苦戦し、地元市場以外の成長を推進しようとするチェーンにとって魅力的であることが証明されました。2021年には、英国人の約22%が6月から7月にかけてテイクアウトにもっとお金を使うようになります。同時に、消費者の80%が宅配でテイクアウトを注文し、同時期に80%がドライブスルーや対面式で注文しています。
生活費危機にもかかわらず英国人の持ち帰り支出は急増、インフレ上昇で平均注文額が上昇
- 英国人は、生活費の危機にもかかわらず、ここ数年、テイクアウトやファーストフードにこれまで以上にお金を費やしています。パンデミック(世界的大流行)時の持ち帰りブームがあっただけに、この上昇は特に大きいです。QSR市場では、ピザとチップスの売上が2021年に前年比7.7%増加しました。英国では、持ち帰りは2021年に1人当たり年間平均725米ドルとなり、2019年の506米ドルから42%増加しました。しかし、同期間に報告された12%の「取引の伸び」は、テイクアウトの売上が数量ベースでも金額ベースでも増加したことを示しています。中華料理、インド料理、ポテトチップス、ピザ、フライドチキン、ケバブ、ハンバーガー、寿司などが人気のテイクアウトです。
- 英国人が好む人気のQSR料理には、ハンバーガー(250gあたり4.5米ドル)、フライドポテト(250gあたり3米ドル)、オニオンリング(250gあたり3.4米ドル)、ピザ(300gあたり8.5米ドル)、チキンナゲット(300gあたり約3.5米ドル)、ガーリックブレッド(100gあたり約4.5米ドル)などがあります。QSR市場の平均注文額は2017~2022年にかけて10.02%増加したが、これは2017~2022年にかけてインフレ率が平均3~4%上昇したことと、年間注文件数が増加し、2022年には1店舗当たり63,432件以上となったことによる。
- ファーストフード部門では、ベジタリアン、グルテンフリー、ヴィーガンなどのオプションを備えたメニューへの需要が高まっています。バーガーキングは2022年1月、英国で初めてヴィーガン・チキンナゲットを導入しました。これは、同国におけるヴィーガン食への嗜好の高まりが原因です。英国人の約40%がヴィーガンフードを提供するレストランを好みました。ハンバーガーの売上高は、ファーストフードの平均注文数の増加とともに、2019~2022年の間に27.24%増加しました。
英国クイックサービスレストラン産業概要
英国のクイックサービスレストラン市場は細分化されており、上位5社で9.36%を占めています。この市場の主要企業は、Co-operative Group Limited、Domino's Pizza Group PLC、Greggs Plc、McDonald's Corporation、Samworth Brothers Limitedです。
その他の特典
- エクセル形式の市場予測(ME)シート
- 3ヶ月のアナリストサポート
目次
第1章 エグゼクティブサマリーと主要調査結果
第2章 レポートのオファー
第3章 イントロダクション
- 調査の前提条件と市場定義
- 調査範囲
- 調査手法
第4章 主要産業動向
- アウトレット数
- 平均注文額
- 規制の枠組み
- 英国
- メニュー分析
第5章 市場セグメンテーション
- 料理
- ベーカリー
- ハンバーガー
- アイスクリーム
- 肉料理
- ピザ
- その他QSR料理
- アウトレット
- チェーン店
- 独立店舗
- 場所
- レジャー
- 宿泊施設
- 小売
- 独立型
- 旅行
第6章 競合情勢
- 主要な戦略動向
- 市場シェア分析
- 企業情勢
- 企業プロファイル
- Ben & Jerry's Homemade Holdings Inc.
- Co-operative Group Limited
- Costa Coffee
- Deep Blue Restaurants Ltd
- Doctor's Associates, Inc.
- Domino's Pizza Group PLC
- Famous Brands Limited
- Favorite Fried Chicken Limited
- Five Guys Enterprises, LLC
- Greggs Plc
- Jab Holding Company S.A.R.L.
- McDonald's Corporation
- Samworth Brothers Limited
- Starbucks Corporation
第7章 CEOへの主要戦略的質問
第8章 付録
- 世界概要
- 概要
- ファイブフォース分析フレームワーク
- 世界のバリューチェーン分析
- 市場力学(DROs)
- 情報源と参考文献
- 図表一覧
- 主要な洞察
- データパック
- 用語集
The United Kingdom Quick Service Restaurant Market size is estimated at 35.77 billion USD in 2025, and is expected to reach 46.15 billion USD by 2030, growing at a CAGR of 5.23% during the forecast period (2025-2030).
Consumers inclination towards fast food consumption led to an increasing number of fast food outlets in the country
- The overall sales for quick service restaurants increased by 35.1% in 2022 compared to 2017. The total number of QSR reached around 39,300 restaurants in 2022, which increased by more than 3000 restaurants since 2019. The number of orders per outlet in a day reached 151 in 2022, with an increase of around 10 orders per day from 2019. The United Kingdom was a big fast-food consumer, with around 22 million fast-food and takeaway meals weekly eaten by adults in 2022.
- By cuisine type, ice cream is projected to be the fastest-growing segment, with a CAGR of 6.30% during the forecast period. Owing to the increased consumption of ice cream in the country, it reached an average of 107 grams of ice cream products per person per week in 2021. Some popular ice cream outlets are Ginger's Comfort Emporium, Gelupo, Callestick Farm, Baskin Robbins, and Dunkin' Donuts.
- Burger accounted for the major share, with a hike of 39.91% in sales in 2021 compared to 2020. Owing to the increased consumption of burgers in the country, the average person in the United Kingdom consumed over one kilogram per year, or about 25 grams of burgers per week, in 2021, which increased from 19 grams per week in 2019.
- Meat-based cuisines, including Chicken Wings, Chicken Nuggets, and Chicken Lollipop, are also popular in the country, which observed an incline of 18.9% in sales value in 2022 compared to 2019, owing to the high meat consumption in the country. For instance, in the United Kingdom, poultry meat consumption per capita reached 32.7 kg in 2020. Moreover, the special recipe and tastes of popular fast-food chains like McDonald's, KFC, and Subway are preferred by consumers, affecting sales positively.
United Kingdom Quick Service Restaurant Market Trends
UK QSR market grows by 10% in 5 years, driven by franchise expansion and global brands
- The number of QSRs increased by around 10% from 2017 to 2022 in the United Kingdom, owing to the rising number of franchisee establishments and companies increasing their footprint. As of January 2023, there were around 1,382 outlets of McDonald's, 517 outlets of Burger King, and 1,005 outlets of KFC. Their global presence and marketing prowess have contributed to the growth of QSRs in the United Kingdom. These brands were able to successfully enter the UK market and capture a significant share of the QSR market by utilizing their brand familiarity and marketing power.
- By location, standalone restaurants acquired more than 72.35% of the value share in 2022. Standalone eateries can be found in a range of locations, including metropolitan districts, suburban strip malls, and rural regions. They typically offer a limited menu of quick and convenient meals, such as burgers, sandwiches, and salads, that can be prepared easily. Quick service restaurants can offer valuable and distinctive service to customers, providing a convenient and fast dining experience that is personalized and unique.
- While the UK takeaway industry expanded due to the increased demand for fast food during the pandemic and changing consumer preferences, QSRs struggled in 2020 due to closures, which proved attractive to chains trying to drive growth outside their local markets. In 2021, around 22% of Brits spent more on takeaways between June and July. At the same time, 80% of consumers ordered takeaways for home delivery, with 80% ordering through drive-throughs and in-person during the same period.
Brits' takeaway spending soars despite cost of living crisis, as rising inflation drives up average order value
- Brits have spent more money on takeaways and fast food than ever over the recent years, despite the cost of living crisis. The rise is particularly significant as it came on top of the boom in takeaways during the pandemic. In the QSR market, sales of pizza and chips increased by 7.7% in 2021 compared to the previous year. In the United Kingdom, takeaways amounted to an average of USD 725 per person annually in 2021, up 42% from USD 506 in 2019. However, the 12% "transaction growth" reported for the same period showed that takeout sales increased in volume and value terms. Chinese, Indian, chips, pizza, fried chicken, kebabs, burgers, and sushi are among the popular takeaways.
- Popular QSR dishes preferred by the Brits include burgers (costing USD 4.5 per 250 gm), French fries (USD 3 per 250 gm), onion rings (USD 3.4 per 250 gm), pizza (USD 8.5 per 300 gm), chicken nuggets (around USD 3.5 per 300 gm), and garlic bread (around USD 4.5 per 100 gm). The average order value in the QSR market increased by 10.02% from 2017 to 2022, owing to the inflation rate increasing by an average of 3-4% from 2017 to 2022 and the increased number of orders per year, which was more than 63,432 per outlet in 2022.
- The demand for menus with options such as vegetarian, gluten-free, and vegan is rising within the fast-food sector. Burger King introduced vegan chicken nuggets in the United Kingdom for the first time in January 2022. This was attributed to the increased preference for vegan food in the country. Around 40% of Brits preferred restaurants offering vegan food. Burger sales increased by 27.24% during 2019-2022, along with the increase in average orders for fast food.
United Kingdom Quick Service Restaurant Industry Overview
The United Kingdom Quick Service Restaurant Market is fragmented, with the top five companies occupying 9.36%. The major players in this market are Co-operative Group Limited, Domino's Pizza Group PLC, Greggs Plc, McDonald's Corporation and Samworth Brothers Limited (sorted alphabetically).
Additional Benefits:
- The market estimate (ME) sheet in Excel format
- 3 months of analyst support
TABLE OF CONTENTS
1 EXECUTIVE SUMMARY & KEY FINDINGS
2 REPORT OFFERS
3 INTRODUCTION
- 3.1 Study Assumptions & Market Definition
- 3.2 Scope of the Study
- 3.3 Research Methodology
4 KEY INDUSTRY TRENDS
- 4.1 Number Of Outlets
- 4.2 Average Order Value
- 4.3 Regulatory Framework
- 4.3.1 United Kingdom
- 4.4 Menu Analysis
5 MARKET SEGMENTATION (includes market size in Value in USD, Forecasts up to 2030 and analysis of growth prospects)
- 5.1 Cuisine
- 5.1.1 Bakeries
- 5.1.2 Burger
- 5.1.3 Ice Cream
- 5.1.4 Meat-based Cuisines
- 5.1.5 Pizza
- 5.1.6 Other QSR Cuisines
- 5.2 Outlet
- 5.2.1 Chained Outlets
- 5.2.2 Independent Outlets
- 5.3 Location
- 5.3.1 Leisure
- 5.3.2 Lodging
- 5.3.3 Retail
- 5.3.4 Standalone
- 5.3.5 Travel
6 COMPETITIVE LANDSCAPE
- 6.1 Key Strategic Moves
- 6.2 Market Share Analysis
- 6.3 Company Landscape
- 6.4 Company Profiles (includes Global Level Overview, Market Level Overview, Core Business Segments, Financials, Headcount, Key Information, Market Rank, Market Share, Products and Services, and Analysis of Recent Developments).
- 6.4.1 Ben & Jerry's Homemade Holdings Inc.
- 6.4.2 Co-operative Group Limited
- 6.4.3 Costa Coffee
- 6.4.4 Deep Blue Restaurants Ltd
- 6.4.5 Doctor's Associates, Inc.
- 6.4.6 Domino's Pizza Group PLC
- 6.4.7 Famous Brands Limited
- 6.4.8 Favorite Fried Chicken Limited
- 6.4.9 Five Guys Enterprises, LLC
- 6.4.10 Greggs Plc
- 6.4.11 Jab Holding Company S.A.R.L.
- 6.4.12 McDonald's Corporation
- 6.4.13 Samworth Brothers Limited
- 6.4.14 Starbucks Corporation
7 KEY STRATEGIC QUESTIONS FOR FOODSERVICE CEOS
8 APPENDIX
- 8.1 Global Overview
- 8.1.1 Overview
- 8.1.2 Porter's Five Forces Framework
- 8.1.3 Global Value Chain Analysis
- 8.1.4 Market Dynamics (DROs)
- 8.2 Sources & References
- 8.3 List of Tables & Figures
- 8.4 Primary Insights
- 8.5 Data Pack
- 8.6 Glossary of Terms
