
|
市場調査レポート
商品コード
1693859
米国のクイックサービスレストラン:市場シェア分析、産業動向と統計、成長予測(2024~2029年)United States Quick Service Restaurants - Market Share Analysis, Industry Trends & Statistics, Growth Forecasts (2024 - 2029) |
||||||
カスタマイズ可能
適宜更新あり
|
|||||||
| 米国のクイックサービスレストラン:市場シェア分析、産業動向と統計、成長予測(2024~2029年) |
|
出版日: 2025年03月18日
発行: Mordor Intelligence
ページ情報: 英文 159 Pages
納期: 2~3営業日
|

全表示
- 概要
- 目次
米国のクイックサービスレストラン市場規模は2024年に4,061億7,000万米ドルと推定され、2029年には6,625億3,000万米ドルに達すると予測され、予測期間中(2024~2029年)のCAGRは10.28%で成長する見込みです。
ファストフードチェーンが全国に拡大したことで、メニューの選択肢が多様化し、それによって顧客が惹きつけられるようになりました。
- 2023年には、クイックサービスレストランを通じて、肉料理が主流になると予想されます。過去30年間で、鶏肉は牛肉と豚肉を抜いて米国で最も消費されている肉製品になりました。2022年、アメリカ人は一人当たり約96.4ポンドのブロイラー鶏を食べた。そのため、アメリカ人の大半は鶏肉を使った料理を好みました。すべての鶏肉料理の総売上は、2022年に367億米ドルに達しました。鶏肉に対する最近の魅力は、事業者による新たなメニュー提供を生み出しています。複数のクイックサービスがフライド・チキン・サンドイッチをメニューに加えました。
- ハンバーガーは近年、大規模なファーストフードサービスの注文に登場するようになりました。この独特のアメリカ料理は、クイックサービスレストラン(QSR)のプラットフォームが、安全で衛生的でカスタマイズ可能な注文としてハンバーガーを提供し始めたことで人気を博しました。ハンバーガーは、ファストデリバリーのイート・アット・ホーム・オーダーの大流行と、常にスマートな食生活を送るミレニアル世代によって、満足感のある即席の食事となりました。そのため米国では、ハンバーガーの売上高は2022年に699億米ドルに達しました。
- QSR産業の競合は熾烈であり、成長し続けています。レストラン数は予測期間中にCAGR 0.48%を記録すると予測されています。米国では産業は非常に細分化されており、事業者は立地、メニューの多様性、料理の質、価格で競争しています。同産業に属する25万社の事業者の大半は小規模で、地元の顧客ベースにサービスを提供しています。競争が激しいため、QSRの価格も下がっています。消費者の健康志向が高まるにつれ、事業者は競合を維持するためにメニューや食材の質を調整しなければならないです。この産業のオペレーターは、絶えず変化する需要に対応するため、メニューの選択肢を絶えず変更、拡大しています。
米国のクイックサービスレストランの市場動向
クイックサービスレストランは、その利便性と手頃な価格から消費者に人気のある選択肢として、引き続き優勢を維持しています。
- クイックサービスレストラン(QSR)の店舗数は、フランチャイズ加盟店や店舗数を拡大する企業の増加により、2020~2021年にかけて11,018店舗増加しました。2021年、米国のQSRフランチャイズ数は188,402と推定されます。QSR数は予測期間中、平均前年比成長率0.47%で増加すると予測されます。
- 独立型セグメントはクイックサービスレストラン市場で71.2%以上のシェアを獲得すると予想されます。独立型レストランは、都市近隣から郊外のストリップモール、農村部まで、様々な環境で見かけることができます。通常、ハンバーガー、サンドイッチ、サラダなど、手早く簡単に調理できる限定メニューを提供しています。2021年、フランチャイズ・レストランの主要企業はマクドナルド、サブウェイ、KFC、ピザハットで、それぞれ1万3,000、2万、4,000、7,000店舗を展開しています。クイックサービスレストランは、便利で迅速な食事体験を提供し、個人的でユニークなものです。
- ファーストフードに対する消費者支出の増加と、1店舗当たりの注文数の増加により店舗数が増加しており、2022年には1日平均75件に達しました。同国で人気のQSR料理は、バッファローチキン、フレンチフライ、BLT、ケサディーヤ、ハムです。さらに、ファストフード産業は米国で市場規模第2位にランクされています。アメリカ人の4人に1人が日常的にファストフードを食べており、今後注文数が増える可能性があります。人口率の増加も、消費者の需要を満たすための店舗数の増加を後押しする可能性があります。
バッファローチキン、フライドポテト、ブレット、ケサディーヤ、ハンバーガー、ピザ、タコス、ソーセージ、ミートボールは米国で最も人気のあるQSR料理です。
- 平均的なアメリカ人は週に67米ドルをテイクアウトに費やします。2021年には、米国の消費者は可処分所得の平均約10.3%をファーストフードに費やします。米国人が好む人気のクイックサービスレストラン(QSR)料理には、バッファローチキン(1食あたり11.5米ドル)、フライドポテト(1食あたり4.9米ドル)、BLT(1食あたり12.6米ドル)、ケサディーヤ(1食あたり7.8米ドル)、ハンバーガー(1食あたり8.75米ドル)、ピザ(1食あたり16米ドル)などがあります。メキシコ料理ベースのタコスも同国では有名です。しかし、1人前約8.75米ドルのソーセージや1人前約9.8米ドルのミートボールも高い割合で消費されています。
- 2017~2022年にかけて平均注文額は16.24%増加したが、これは期間中に平均6~7%増加したインフレ率の上昇によるもので、2022年には1店舗当たりの年間注文数は27,375件以上に増加しました。米国は、ファストフードの消費において記録的な割合を記録しました。平均的なアメリカ人は、1日の摂取カロリーの11.3%をファーストフードから摂取しています。スターバックスの売上は2021年に603億米ドルに達し、マクドナルドは同年に1,549億米ドルの売上を記録しました。KFCは2021年に182億米ドルの収益を記録し、サブウェイは同年に1,480万米ドルに達し、2万3,360件に達する注文の増加を示しました。さらに、COVID-19により、2020年1月から2021年1月にかけて、米国のQSRメニュー価格は前年比で着実に上昇し、2020年には注文1件当たり約23.53米ドルに達しました。また、COVID-19期間中は食材や包装の高騰により若干値上げされ、注文の約80%はオンラインデリバリーまたは持ち帰りとなっています。
米国のクイックサービスレストラン産業概要
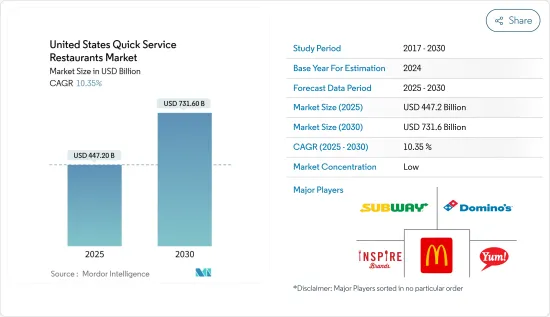
米国のクイックサービスレストラン市場は細分化されており、上位5社で17.39%を占めています。この市場の主要企業は次のとおりです。Doctor's Associates、Inc.、Domino's Pizza Inc.、Inspire Brands、Inc.、McDonald's Corporation、Yum!Brands、Inc.などです。
その他の特典
- エクセル形式の市場予測(ME)シート
- 3ヶ月のアナリストサポート
目次
第1章 エグゼクティブサマリーと主要調査結果
第2章 レポートのオファー
第3章 イントロダクション
- 調査の前提条件と市場定義
- 調査範囲
- 調査手法
第4章 主要産業動向
- アウトレット数
- 平均注文額
- 規制の枠組み
- 米国
- メニュー分析
第5章 市場セグメンテーション
- 料理
- ベーカリー
- ハンバーガー
- アイスクリーム
- 肉料理
- ピザ
- その他QSR料理
- アウトレット
- チェーン店
- 独立店舗
- ロケーション
- レジャー
- 宿泊施設
- 小売
- 独立型
- 旅行
第6章 競合情勢
- 主要な戦略動向
- 市場シェア分析
- 企業情勢
- 企業プロファイル
- CFA Properties, Inc.
- Chipotle Mexican Grill, Inc.
- Doctor's Associates, Inc.
- Domino's Pizza Inc.
- Ilitch Holdings, Inc.
- Inspire Brands, Inc.
- McDonald's Corporation
- Papa John's International, Inc.
- Restaurant Brands International Inc.
- The Wendy's Company
- Yum!Brands, Inc.
第7章 CEOへの主要戦略的質問
第8章 付録
- 世界概要
- 概要
- ファイブフォース分析フレームワーク
- 世界のバリューチェーン分析
- 市場力学(DROs)
- 情報源と参考文献
- 図表一覧
- 主要な洞察
- データパック
- 用語集
The United States Quick Service Restaurants Market size is estimated at 406.17 billion USD in 2024, and is expected to reach 662.53 billion USD by 2029, growing at a CAGR of 10.28% during the forecast period (2024-2029).
The expansion of fast food chains throughout the country led to diverse menu options thereby attracting customers
- Through quick service restaurants, meat-based cuisines are expected to dominate in 2023. Over the past three decades, chicken has surpassed beef and pork as the most popular meat product consumed in the United States. In 2022, Americans ate around 96.4 pounds of broiler chickens per capita. Therefore, the majority of Americans favored cuisines based on chicken. The collective sales of all chicken dishes came to USD 36.7 billion in 2022. Recent attractiveness toward chicken has created additional menu offerings from operators. Multiple quick services have added fried chicken sandwiches to their offerings.
- Burgers began to appear on large fast-food service orders in recent years. The distinctly American dish gained popularity as platforms for quick service restaurants (QSRs) began to provide burgers as secure, hygienic, and customizable orders. Burgers became a satisfying, instant meal due to the pandemic of fast delivery eat-at-home orders and the ever-consuming smart-eating millennials. Therefore, in the United States, sales of burgers amounted to USD 69.9 billion in 2022.
- The competition in the QSR industry is fierce and growing. The number of restaurants is projected to register a CAGR of 0.48% during the forecast period. The industry is highly fragmented in the United States, with operators competing on location, menu variety, food quality, and price. The majority of the 250,000 operators in this industry are small and serve a local customer base. The high competition drives down QSR prices. As consumers become more health-conscious, operators must adjust their menus and ingredient quality to remain competitive. Operators in this industry continually alter and expand their menu options to keep up with the ever-changing demand.
United States Quick Service Restaurants Market Trends
Quick service restaurants continue to dominate, being a popular choice for consumers due to their convenience and affordability
- The number of quick service restaurants (QSRs) increased by 11,018 from 2020 to 2021 due to the increased number of franchisees and companies expanding their footprint. In 2021, it was estimated that there were 188,402 QSR franchises in the United States. The number of QSRs is projected to increase with an average Y-o-Y growth rate of 0.47% during the forecast period.
- The standalone segment is expected to acquire more than 71.2% value share in the quick service restaurants market. Standalone restaurants can be found in a variety of settings, from urban neighborhoods to suburban strip malls to rural areas. They typically offer a limited menu of quick and convenient meals, such as burgers, sandwiches, and salads, which can be prepared quickly and easily. In 2021, the key players in the franchised restaurants were McDonald's, Subway, KFC, and Pizza Hut, with 13,000, 20,000, 4,000, and 7,000 locations, respectively. Quick service restaurants provide a convenient and fast dining experience that is personalized and unique.
- There has been an increase in the number of outlets due to the rise in consumer expenditure on fast food and the increase in the number of orders per outlet, which reached an average of 75 a day in 2022. The popular QSR dishes in the country are buffalo chicken, French fries, BLT, quesadilla, and ham. Moreover, the fast-food industry is ranked the second largest in market size in the United States. One in four Americans consumes fast food on a daily basis, which may boost the number of orders in the future. The increasing population rate may also aid in the increase in the number of outlets to meet consumer demand.
Buffalo chicken, french fries, blts, quesadillas, burgers, pizza, tacos, sausages, and meatballs are the most popular QSR dishes in the United States
- An average American spends USD 67 on takeout per week. In 2021, consumers in the United States spent an average of around 10.3% of their total disposable income on fast food. The popular quick service restaurant (QSR) dishes preferred by Americans include buffalo chicken (USD 11.5 per serving), French fries (USD 4.9 per serving), BLT (USD 12.6 per serving), quesadilla (USD 7.8 per serving), burger (8.75 per serving), and pizza (USD 16 per serving). Taco, a Mexican-based cuisine, is also famous in the country. However, sausages, which cost around USD 8.75 per serving, and meatballs, which cost around USD 9.8 per serving, are also consumed in high proportion.
- The average order value increased by 16.24% from 2017 to 2022, owing to the rising inflation rate, which increased by an average of 6-7% during the period, and the number of orders per year increased to more than 27,375 per outlet in 2022. The United States registered a record rate in the consumption of fast food. An average American acquires 11.3% of their daily calorie intake from fast food. The revenue of Starbucks reached USD 60.3 billion in 2021, and McDonald's registered a revenue of USD 154.9 billion in the same year. KFC recorded a revenue of USD 18.2 billion in 2021, and Subway amounted to USD 14.8 million the same year, witnessing a hike in orders reaching 23,360. Moreover, due to COVID-19, from January 2020 to January 2021, the Y-o-Y QSR menu prices in the United States steadily increased, reaching around USD 23.53 per order in 2020. Moreover, the prices were slightly increased during COVID-19 due to the high cost of the food and packaging, and about 80% of the orders were delivered online or were takeaways.
United States Quick Service Restaurants Industry Overview
The United States Quick Service Restaurants Market is fragmented, with the top five companies occupying 17.39%. The major players in this market are Doctor's Associates, Inc., Domino's Pizza Inc., Inspire Brands, Inc., McDonald's Corporation and Yum! Brands, Inc. (sorted alphabetically).
Additional Benefits:
- The market estimate (ME) sheet in Excel format
- 3 months of analyst support
TABLE OF CONTENTS
1 EXECUTIVE SUMMARY & KEY FINDINGS
2 REPORT OFFERS
3 INTRODUCTION
- 3.1 Study Assumptions & Market Definition
- 3.2 Scope of the Study
- 3.3 Research Methodology
4 KEY INDUSTRY TRENDS
- 4.1 Number Of Outlets
- 4.2 Average Order Value
- 4.3 Regulatory Framework
- 4.3.1 United States
- 4.4 Menu Analysis
5 MARKET SEGMENTATION (includes market size in Value in USD, Forecasts up to 2029 and analysis of growth prospects)
- 5.1 Cuisine
- 5.1.1 Bakeries
- 5.1.2 Burger
- 5.1.3 Ice Cream
- 5.1.4 Meat-based Cuisines
- 5.1.5 Pizza
- 5.1.6 Other QSR Cuisines
- 5.2 Outlet
- 5.2.1 Chained Outlets
- 5.2.2 Independent Outlets
- 5.3 Location
- 5.3.1 Leisure
- 5.3.2 Lodging
- 5.3.3 Retail
- 5.3.4 Standalone
- 5.3.5 Travel
6 COMPETITIVE LANDSCAPE
- 6.1 Key Strategic Moves
- 6.2 Market Share Analysis
- 6.3 Company Landscape
- 6.4 Company Profiles (includes Global Level Overview, Market Level Overview, Core Business Segments, Financials, Headcount, Key Information, Market Rank, Market Share, Products and Services, and Analysis of Recent Developments).
- 6.4.1 CFA Properties, Inc.
- 6.4.2 Chipotle Mexican Grill, Inc.
- 6.4.3 Doctor's Associates, Inc.
- 6.4.4 Domino's Pizza Inc.
- 6.4.5 Ilitch Holdings, Inc.
- 6.4.6 Inspire Brands, Inc.
- 6.4.7 McDonald's Corporation
- 6.4.8 Papa John's International, Inc.
- 6.4.9 Restaurant Brands International Inc.
- 6.4.10 The Wendy's Company
- 6.4.11 Yum! Brands, Inc.
7 KEY STRATEGIC QUESTIONS FOR FOODSERVICE CEOS
8 APPENDIX
- 8.1 Global Overview
- 8.1.1 Overview
- 8.1.2 Porter's Five Forces Framework
- 8.1.3 Global Value Chain Analysis
- 8.1.4 Market Dynamics (DROs)
- 8.2 Sources & References
- 8.3 List of Tables & Figures
- 8.4 Primary Insights
- 8.5 Data Pack
- 8.6 Glossary of Terms

