デフォルト表紙
市場調査レポート
商品コード
1693900

インドのクイックサービスレストラン:市場シェア分析、産業動向と統計、成長予測(2024~2029年)

India Quick Service Restaurant - Market Share Analysis, Industry Trends & Statistics, Growth Forecasts (2024 - 2029)


出版日
ページ情報
英文 147 Pages
納期
2~3営業日
カスタマイズ可能
適宜更新あり
価格
価格表記: USDを日本円(税抜)に換算
本日の銀行送金レート: 1USD=144.03円
インドのクイックサービスレストラン:市場シェア分析、産業動向と統計、成長予測(2024~2029年)
出版日: 2025年03月18日
発行: Mordor Intelligence
ページ情報: 英文 147 Pages
納期: 2~3営業日
GIIご利用のメリット
  • 全表示
  • 概要
  • 目次
概要

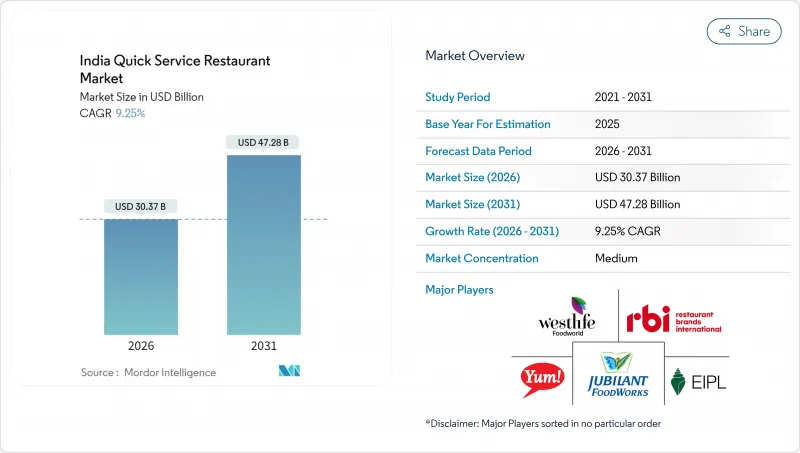
インドのクイックサービスレストラン市場規模は2024年に254億6,000万米ドルと推定・予測され、2029年には387億1,000万米ドルに達し、予測期間(2024~2029年)のCAGRは8.74%で成長すると予測されます。

India Quick Service Restaurant-Market-IMG1

ファストデリバリーオプションと衛生的な食品、ブランドロイヤルティの本質が売上を押し上げる

  • クイックサービスレストラン(QSR)向けのプラットフォームは、調査期間中に安全で衛生的でカスタマイズ可能な注文を提供し始めました。ハンバーガーは、イート・アット・ホーム・オーダーの迅速な配達と、常にスマートな食生活を送るミレニアル世代によって、満足度の高いインスタント食品となりました。さらに、チキンウィング、ナゲット、ミートボール、ポップコーン、ハンバーガーなどのチキン製品に対する高い需要が、過去3~4年間、国内での売上を押し上げました。このため、QSRセグメント全体では、2017~2022年にかけて販売額が43.2%増加しました。
  • 料理のタイプ別では、ピザが最も急成長し、予測期間2023~2029年のCAGRは金額ベースで11.21%と予測されています。注文数は急速に増加しており、2021年には約1億2,000万枚のピザに達し、そのため売上は今後数年間で大きく伸びると予測されます。しかし、市場はDomino'sとPizza Hutが独占しており、両社合わせて70%以上のシェアを占めています。30分以内のオンラインフードデリバリーという新技術と、デリバリーに使用されるオーブンバッグが消費者の関心を集めています。
  • 店舗タイプ別では、独立型店舗が、1日当たりの注文数の増加と商品のコスト上昇により、予測期間2023~2029年のCAGRは金額ベースで9.13%と最も急成長すると予測されます。アウトレットの約90%は独立型で、市場や街角にあり、消費者に簡単にアクセスできます。独立型店舗の商品コストはチェーン店より30~40%低く、消費者の関心を集めています。

インドのクイックサービスレストラン市場動向

KFC、McDonald's、Domino'sに牽引され、世界のファーストフードブランドがインドで人気を獲得

  • QSRレストラン数は2020~2021年にかけて51,761店増加。この成長は、直営店やフランチャイズチェーン店を持つ世界ファストフードの増加によるもので、国内での足跡を伸ばすのに役立っています。KFCやDomino's Pizzaのような世界のファストフードブランドは、フランチャイズ店の大半を国内で展開しています。例えば、2022年現在、KFCは複数のフランチャイジーオーナーとともに335店舗を展開しており、一方、Jubilant FoodWorks Limitedはインドで1,300店舗を展開するDomino's Pizzaのフランチャイジーです。
  • クイックサービス部門は肉料理が主で、ベーカリーやハンバーガーがこれに続きます。インドにおけるQSR店舗数の増加は、2021~2022年までの前年比成長率が8.41%のプラスであることを示しています。これは、国民の食肉消費の増加に起因しています。一人当たりの肉消費量は、2019年の6.15kgから2022年には6.82kgに増加しています。ほとんどのファーストフード店では、チキンナゲット、チキンロリーポップ、チキンバーガー、チキン春巻きなど、肉を使った標準的なメニューを提供するのが一般的です。
  • ファストフードへの消費支出の増加により、1店舗当たりの注文数が多いため店舗数が増加しており、2022年には1日平均177店に達します。人気のファストフードアイテムは、チキンロール、チーズボール、ハンバーガー、ピザ、フライドポテト、デザート、パブ・バジ、ペリペリチキン・ウィングです。クイックサービスレストランの人気が高まっているのは、若者が頻繁にファーストフードを食べる傾向にあるためです。人気のファーストフードチェーンには、ハルディラムズ、ニルラズ、ピザハットなどがあります。注文数の増加に伴い、予測期間中に店舗数は0.29%増加すると予測されています。

インド人は食費のかなりの部分をファーストフードに費やしており、フライドポテト、ピザ、サンドイッチ、ハンバーガー、ラップ/ロールパン、ガーリックブレッドが最も人気のある料理です。

  • インド人は総支出の35.3%を食費に費やしています。ファーストフードへの平均支出は、レビュー期間中に2.98米ドルから3.65米ドルに達しました。しかし、2021年には、インドでは男性の94%、女性の96%が週に1回ファストフードを好んで食べていることが明らかになりました。インド人が好む人気のQSR料理は、フライドポテト(1人前1.63米ドル)、ピザ(1人前4.47米ドル)、サンドイッチ(1人前1.33米ドル)、ハンバーガー(1人前約1.75米ドル)です。ラップ/ロールやガーリックブレッドの人気は高まっており、若年層に広く受け入れられています。ガーリックブレッドの平均価格は1人前2.11米ドル、ラップ/ロールは1人前2.17米ドル。
  • インドではベーカリー製品への嗜好が高まっています。しかし、人気のベーカリー製品はケーキ、ペストリー、クッキーです。中でもチョコラバケーキの嗜好性が高く、マクドナルドやKFCといった世界QSRチェーンの大半がデザートメニューに追加しています。平均注文額は2017~2022年にかけて23.65%増加しました。上昇インフレ率は2017~2022年にかけて平均5.13~7.54%増加し、年間注文数は2022年に64,647件以上に増加しました。この成長は、チェーン展開するファーストフードブランドが、メトロやメトロ以外の都市に新店舗をオープンして拡大を始めたことに起因しています。例えば、KFCとSubwayは2023年前半にデリーとパンジャブに新店舗を開店し、同社のすべての食品と飲物をメニューに載せ、2024年までにさらに新店舗を増やして全国展開を計画しています。

インドのクイックサービスレストラン産業概要

インドのクイックサービスレストラン市場は細分化されており、上位5社で4.77%を占めています。同市場の主要企業は以下の通りです。 Coffee Day Enterprises Limited、Doctor's Associate, Inc.、Jubilant FoodWorks Limited、McDonald's Corporation、Yum!Brands, Inc.などです。

その他の特典

  • エクセル形式の市場予測(ME)シート
  • 3ヶ月のアナリストサポート

目次

第1章 エグゼクティブサマリーと主要調査結果

第2章 レポートのオファー

第3章 イントロダクション

  • 調査の前提条件と市場定義
  • 調査範囲
  • 調査手法

第4章 主要産業動向

  • アウトレット数
  • 平均注文額
  • 規制の枠組み
    • インド
  • メニュー分析

第5章 市場セグメンテーション

  • 料理
    • ベーカリー
    • ハンバーガー
    • アイスクリーム
    • 肉料理
    • ピザ
    • その他QSR料理
  • アウトレット
    • チェーン店
    • 独立店舗
  • 場所
    • レジャー
    • 宿泊施設
    • 小売
    • 独立型
    • 旅行

第6章 競合情勢

  • 主要な戦略動向
  • 市場シェア分析
  • 企業情勢
  • 企業プロファイル
    • Coffee Day Enterprises Limited
    • Doctor's Associate, Inc.
    • Graviss Foods Private Limited
    • Jubilant FoodWorks Limited
    • McDonald's Corporation
    • Restaurant Brands Asia Limited
    • Tata Starbucks Private Limited
    • Wow!Momo Foods Private Limited
    • Yum!Brands, Inc.

第7章 CEOへの主要戦略的質問

第8章 付録

  • 世界概要
    • 概要
    • ファイブフォース分析フレームワーク
    • 世界のバリューチェーン分析
    • 市場力学(DROs)
  • 情報源と参考文献
  • 図表一覧
  • 主要な洞察
  • データパック
  • 用語集
目次
Product Code: 50000826

The India Quick Service Restaurant Market size is estimated at 25.46 billion USD in 2024, and is expected to reach 38.71 billion USD by 2029, growing at a CAGR of 8.74% during the forecast period (2024-2029).

India Quick Service Restaurant - Market - IMG1

Fast-delivery options along with hygienic food and the essence of brand loyalty boost the sales

  • Platforms for quick service restaurants (QSRs) began to provide secure, hygienic, and customizable orders over the study period. Burgers became a satisfying, instant meal due to the fast delivery of eat-at-home orders and the ever-consuming smart-eating millennials. Additionally, the high demand for chicken products such as chicken wings, nuggets, meatballs, popcorn, and burgers, which cost an average of USD 7 for 300 grams of chicken and USD 1.75 for 250 grams of vegetarian burgers, has boosted sales in the nation over the past three to four years. Owing to this, the overall QSR segment witnessed a hike of 43.2% in sales value from 2017 to 2022.
  • By cuisine type, pizza is projected to be the fastest-growing, with a projected CAGR of 11.21%, by value, during the forecast period 2023-2029. The number of orders is increasing rapidly, which reached around 120 million pizzas in 2021, due to which the sales are projected to observe significant growth over the coming years. However, the market is dominated by Domino's and Pizza Hut, which together account for more than a 70% share. The new technology of online food delivery within 30 minutes and the oven bags used for delivery have gained consumers' interest.
  • By outlet type, independent outlets are projected to witness the fastest-growing CAGR of 9.13%, by value, during the forecast period, 2023-2029, due to the increasing number of orders per day and costs of the products. Around 90% of the outlets are standalone, which are found in the market and streets providing easy access to the consumers. The cost of products in independent outlets is around 30-40% lower than in chained outlets, which gains consumer interest.

India Quick Service Restaurant Market Trends

Global fast-food brands gain traction in India, led by KFC, McDonald's, and Domino's

  • The number of QSR restaurants increased by 51,761 from 2020 to 2021. This growth is due to the increase in the number of global fast food with their company-operated stores and franchised chained stores, which helps to grow their footprint in the nation. Global fast-food brands such as KFC and Domino's Pizza operate in the nation, with a majority of the franchised stores. For instance, as of 2022, KFC had 335 restaurants with several franchisee owners, whereas Jubilant FoodWorks Limited is the franchisee of Domino's Pizza in India, with 1,300 stores.
  • The quick service segment is majorly driven by meat-based cuisines, followed by bakeries and burgers. The increase in the number of QSR outlets in India indicated a positive Y-o-Y growth rate of 8.41% from 2021 to 2022. This has been attributed to the nation's increased consumption of meat. The per capita meat consumption grew from 6.15 kg in 2019 to 6.82 kg in 2022. Most fast-food restaurants typically offer a standardized menu with meat-based dishes, including chicken nuggets, chicken lollypops, chicken burgers, and chicken spring rolls.
  • Owing to the increasing consumer spending on fast food, the number of outlets is increasing due to a large number of orders per outlet, which reached an average of 177 a day in 2022. Popular fast-food items are chicken rolls, cheese balls, burgers, pizzas, French fries, desserts, pav bhaji, and peri-peri chicken wings. The increased popularity of quick service restaurants is due to young people's propensity to eat fast food frequently. Popular fast-food chains include Haldiram's, Nirula's, and Pizza Hut. With the increased number of orders, it is predicted that the number of outlets will grow by 0.29% during the forecast period.

Indians spend a significant portion of their food budget on fast food, with french fries, pizzas, sandwiches, burgers, wraps/rolls, and garlic bread being the most popular dishes

  • Indians spend 35.3% of their total expenditure on food. The average spending on fast food has reached USD 2.98 to USD 3.65 during review period. However, in 2021, it was noted that 94% of men and 96% of women in India prefer to consume fast food once a week. Popular QSR dishes preferred by the Indians are French fries (USD 1.63 per serving), pizzas (USD 4.47 per serving), sandwiches (USD 1.33 per serving), and burgers (around USD 1.75 per serving). The popularity of wraps/rolls and garlic bread is growing and is widely accepted by young adults. The average price of garlic bread is USD 2.11 per serving, and wraps/rolls cost 2.17 per serving.
  • There is an increased preference for bakery products in India. However, popular bakery products are cakes, pastries, and cookies. The average price for black forest cake/pastry is around USD 5.203 per 500-g, choco lava cake costs around USD 1.21 per piece, and red velvet cake/pastry costs USD 5.8 per 500 g. Among all, choco lava cake is highly preferable, and the majority of global QSR chains, such as McDonald's and KFC, have added this to their dessert menu. The average order value increased by 23.65% from 2017 to 2022. The rising inflation rate increased by an average of 5.13-7.54% from 2017 to 2022, and the number of orders per year increased to more than 64,647 in 2022. The growth has been attributed to chained fast-food brands that have started expanding by opening new outlets in metro and non-metro cities. For instance, in the first half of 2023, KFC and Subway opened new stores in Delhi and Punjab with all its foods and beverages on the menu and planned to expand in the nation by 2024 with more new outlets.

India Quick Service Restaurant Industry Overview

The India Quick Service Restaurant Market is fragmented, with the top five companies occupying 4.77%. The major players in this market are Coffee Day Enterprises Limited, Doctor's Associate, Inc., Jubilant FoodWorks Limited, McDonald's Corporation and Yum! Brands, Inc. (sorted alphabetically).

Additional Benefits:

  • The market estimate (ME) sheet in Excel format
  • 3 months of analyst support

TABLE OF CONTENTS

1 EXECUTIVE SUMMARY & KEY FINDINGS

2 REPORT OFFERS

3 INTRODUCTION

  • 3.1 Study Assumptions & Market Definition
  • 3.2 Scope of the Study
  • 3.3 Research Methodology

4 KEY INDUSTRY TRENDS

  • 4.1 Number Of Outlets
  • 4.2 Average Order Value
  • 4.3 Regulatory Framework
    • 4.3.1 India
  • 4.4 Menu Analysis

5 MARKET SEGMENTATION (includes market size in Value in USD, Forecasts up to 2029 and analysis of growth prospects)

  • 5.1 Cuisine
    • 5.1.1 Bakeries
    • 5.1.2 Burger
    • 5.1.3 Ice Cream
    • 5.1.4 Meat-based Cuisines
    • 5.1.5 Pizza
    • 5.1.6 Other QSR Cuisines
  • 5.2 Outlet
    • 5.2.1 Chained Outlets
    • 5.2.2 Independent Outlets
  • 5.3 Location
    • 5.3.1 Leisure
    • 5.3.2 Lodging
    • 5.3.3 Retail
    • 5.3.4 Standalone
    • 5.3.5 Travel

6 COMPETITIVE LANDSCAPE

  • 6.1 Key Strategic Moves
  • 6.2 Market Share Analysis
  • 6.3 Company Landscape
  • 6.4 Company Profiles (includes Global Level Overview, Market Level Overview, Core Business Segments, Financials, Headcount, Key Information, Market Rank, Market Share, Products and Services, and Analysis of Recent Developments).
    • 6.4.1 Coffee Day Enterprises Limited
    • 6.4.2 Doctor's Associate, Inc.
    • 6.4.3 Graviss Foods Private Limited
    • 6.4.4 Jubilant FoodWorks Limited
    • 6.4.5 McDonald's Corporation
    • 6.4.6 Restaurant Brands Asia Limited
    • 6.4.7 Tata Starbucks Private Limited
    • 6.4.8 Wow! Momo Foods Private Limited
    • 6.4.9 Yum! Brands, Inc.

7 KEY STRATEGIC QUESTIONS FOR FOODSERVICE CEOS

8 APPENDIX

  • 8.1 Global Overview
    • 8.1.1 Overview
    • 8.1.2 Porter's Five Forces Framework
    • 8.1.3 Global Value Chain Analysis
    • 8.1.4 Market Dynamics (DROs)
  • 8.2 Sources & References
  • 8.3 List of Tables & Figures
  • 8.4 Primary Insights
  • 8.5 Data Pack
  • 8.6 Glossary of Terms