
|
市場調査レポート
商品コード
1693865
北米の乳製品:市場シェア分析、産業動向、成長予測(2025~2030年)North America Dairy - Market Share Analysis, Industry Trends & Statistics, Growth Forecasts (2025 - 2030) |
||||||
カスタマイズ可能
適宜更新あり
|
|||||||
| 北米の乳製品:市場シェア分析、産業動向、成長予測(2025~2030年) |
|
出版日: 2025年03月18日
発行: Mordor Intelligence
ページ情報: 英文 297 Pages
納期: 2~3営業日
|

全表示
- 概要
- 目次
概要
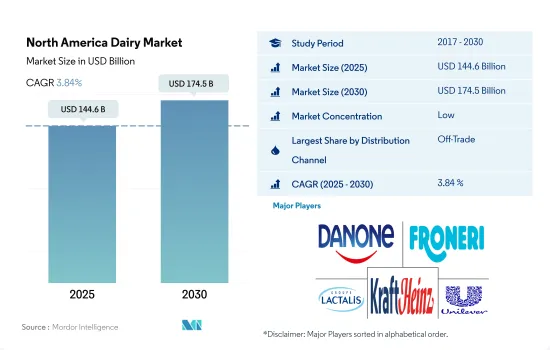
北米の乳製品市場規模は2025年に1,446億米ドルと推定され、2030年には1,745億米ドルに達すると予測され、予測期間(2025~2030年)のCAGRは3.84%で成長します。
クリーンラベル製品の入手可能性が北米の小売部門の成長を促進
- 北米の流通チャネルは、2021年と比較して2022年には2.16%の成長を示しました。この成長は、チーズ、ヨーグルト、牛乳などの乳製品セグメントにおけるクリーンラベル製品の人気と入手可能性に起因します。これらのクリーンラベル乳製品は、人工着色料、人工香料、人工保存料などの人工成分を使用していないです。これらの小売業者はまた、様々なブランドの乳製品を幅広く提供しています。この乳製品市場は、北米における流通チャネルの需要増加により、2025年には8.81%上昇すると予想されています。
- スーパーマーケットやハイパーマーケットは、製品を保管するための広いスペースと棚を持っています。その結果、オフトレードの小売形態では、スーパーマーケットとハイパーマーケットが51.32%のシェアを占め、国内全体の流通チャネルを支配しています。これらのスーパーマーケットやハイパーマーケットには、Walmart、Target、Kroger、Amazon、Costco Wholesale Corporation、Albertsons Companies、Ahold Delhaize USA、Publix Super Markets Inc.などがあります。これらの小売業者は乳製品を様々な価格(低価格、中価格、高価格)で提供しています。米国におけるサワーミルクの基本販売価格は2.68米ドルから50米ドルです。
- 北米では、消費者は主に家庭外消費を好みます。2022年には、約2,310万人が少なくとも週に1回は屋外で食品を消費しています。米国のレストラン総数は、2021年には10万1,811軒と推定されます。その結果、2018~2021年にかけて、オントレード小売の形態が人気を博しました。北米のオントレード小売形態では、2022年に牛乳産業が他の乳製品産業と比較して65.84%の最大シェアを占めました。2025~2028年の間、家庭外消費の需要増加により、オントレード消費は4.5%増加すると予想されます。
乳製品消費の利点に関する意識の高まりが市場成長を促進
- 北米地域の乳製品産業は、2021年と比較して2022年には2.98%の成長が見られました。乳製品には必須栄養素が大量に含まれているため、健康に対する意識が高まっていることが成長の要因です。コップ1杯の牛乳には3.4グラムのタンパク質、5グラムの炭水化物、0.6グラムの飽和脂肪酸、その他の栄養素が含まれています。このため、健康的な食生活を維持しようとする人々の乳製品への関心が高まっています。そのため、乳製品産業は2024年に3.2%の成長が見込まれています。
- 北米地域では、米国が乳製品産業を支配しています。2022年、米国のシェアは70.08%でした。2023年1月、米国ではコンビニエンスストアが15万174店舗営業しており、2022年の店舗数から1.5%増加し、消費者の乳製品購入を助けた。
- カナダのシェアは18.85%。コンビニエンスストアが最も多いのはテキサス州で1万6,018店舗、次いでカリフォルニア州が1万2,000店舗となっています。北米地域で有名な店舗には、Walmart、Amazon、Kroger、Targeなどがあります。これらの店舗は、市場で多種多様な乳製品を提供しています。
- 2022年のメキシコのシェアは51.02%でした。2020年には、全国に33のスーパーマーケットチェーンがあり、3,227店舗、2,365の百貨店、5万3,793の専門店があります。移動式露天商や公設市場などの非正規店が小売市場の50%を占めています。乳製品はまた、さまざまな価格(低価格、中価格、高価格)で販売されています。パック入り牛乳の基本販売価格は1.72米ドルで、最高価格は50.5米ドルです。さまざまな価格帯の製品が入手可能なため、国民の購買力が高まっている
北米の乳製品市場の動向
北米における乳製品入り焼き菓子とバターベースのスナック菓子の需要拡大が市場を押し上げます。
- 北米の乳製品産業の一人当たり消費量は、2021年と比較して2022年には1.33%の成長を記録しました。牛乳の脂肪分が約3.95%であるのに対し、脱脂固形分は8.94%と記録されています。牧場牛乳(酪農場から出荷される牛の乳)に含まれる乳脂肪分と脱脂固形分の平均割合は、過去10年間で増加しています。その結果、消費者は乳製品から得られる利点、例えば体力の向上、天然成分の摂取、その他の利点についてより強く認識するようになり、北米地域の乳製品需要の上昇につながっています。
- 北米地域の消費者はまた、クッキーやクランチーのようなバターベースのスナック製品に引き寄せられました。その結果、バターの輸入量が増加しました。2022年には、輸入の増加により米国のバター価格が上昇し、国際価格水準に並びました。プレミアムバターへの旺盛な需要と、2021年初頭に輸入関税が撤廃されたことがこの動向を後押ししました。特に、バターの輸入量は2021年に4億ポンド増加し、乳脂肪分ベースの推定では2023年には69億ポンドに達する見込みです。
- ピザ、モルタデッラ入り焼きマカロニ、その他のチーズをベースとした製品など、焼き食品の需要が高まるにつれて、チーズの需要もこの地域で増加しています。国内のチーズ消費量は2021年に2.7%の継続的成長を示しました。チーズを使った食品の需要を満たすため、チーズの輸入は2020年の同月と比較して毎月増加し(2月と12月を除く)、2021年には合計3億ポンドに達し、13.2%の増加を記録しました。チーズ生産量も2.8%増加し、2021年には136億ポンドに達しました。
北米の乳製品産業概要
北米の乳製品市場は細分化されており、上位5社で18.52%を占めています。この市場の主要企業は、Danone SA、Froneri International Limited、Groupe Lactalis、The Kraft Heinz Company、Unilever PLCなどです。
その他の特典
- エクセル形式の市場予測(ME)シート
- 3ヶ月のアナリストサポート
目次
第1章 エグゼクティブサマリーと主要調査結果
第2章 レポートのオファー
第3章 イントロダクション
- 調査の前提条件と市場定義
- 調査範囲
- 調査手法
第4章 主要産業動向
- 一人当たり消費量
- 原料/商品生産量
- バター
- チーズ
- 牛乳
- 規制の枠組み
- カナダ
- メキシコ
- 米国
- バリューチェーンと流通チャネル分析
第5章 市場セグメンテーション
- カテゴリー
- バター
- 製品タイプ別
- 培養バター
- 未加工バター
- チーズ
- 製品タイプ別
- 天然チーズ
- プロセスチーズ
- クリーム
- 製品タイプ別
- ダブルクリーム
- シングルクリーム
- ホイップクリーム
- その他
- 乳製品デザート
- 製品タイプ別
- チーズケーキ
- フローズンデザート
- アイスクリーム
- ムース
- その他
- 牛乳
- 製品タイプ別
- コンデンスミルク
- フレーバーミルク
- フレッシュミルク
- 粉ミルク
- UHTミルク
- サワーミルクドリンク
- ヨーグルト
- 製品タイプ別
- フレーバーヨーグルト
- ノンフレーバーヨーグルト
- バター
- 流通チャネル
- オフトレード
- コンビニエンスストア
- オンライン小売
- 専門小売店
- スーパーマーケットとハイパーマーケット
- その他(倉庫クラブ、ガソリンスタンドなど)
- オントレード
- オフトレード
- 国名
- カナダ
- メキシコ
- 米国
- その他の北米地域
第6章 競争情勢
- 主要な戦略動向
- 市場シェア分析
- 企業情勢
- 企業プロファイル
- Agropur Dairy Cooperative
- Conagra Brands Inc.
- Dairy Farmers of America Inc.
- Danone SA
- Froneri International Limited
- Groupe Lactalis
- Nestle SA
- Organic Valley
- Prairie Farms Dairy Inc.
- Saputo Inc.
- The Kraft Heinz Company
- Umpqua Dairy Products Co.
- Unilever PLC
第7章 CEOへの主要戦略的質問
第8章 付録
- 世界概要
- 概要
- ファイブフォース分析フレームワーク
- 世界のバリューチェーン分析
- 市場力学(DROs)
- 情報源と参考文献
- 図表一覧
- 主要な洞察
- データパック
- 用語集
目次
Product Code: 50000723
The North America Dairy Market size is estimated at 144.6 billion USD in 2025, and is expected to reach 174.5 billion USD by 2030, growing at a CAGR of 3.84% during the forecast period (2025-2030).
Availability of clean label products is enhancing the growth of retailing unit in North America
- The North American distribution channel witnessed a growth of 2.16% in 2022 compared to 2021. The growth was attributed to the popularity and availability of clean-label products in dairy segments, such as cheese, yogurt, and milk. These clean-label dairy products are free from artificial ingredients, including artificial colors, flavors, and preservatives. These retailers also offer a wide variety of dairy products of various brands. This dairy market is expected to rise by 8.81% in 2025 due to the increasing demand for distribution channels in North America.
- Supermarkets and hypermarkets have larger spaces and shelves to store their products. As a result, under the off-trade retailing modes, supermarkets and hypermarkets dominate the country's overall distribution channel by holding a share of 51.32%. Some of these supermarkets and hypermarkets nationwide are Walmart, Target, Kroger, Amazon, Costco Wholesale Corporation, Albertsons Companies, Ahold Delhaize USA, and Publix Super Markets Inc. These retailers provide dairy products at varied prices (low, medium, and high). The base selling price of sour milk in the United States is USD 2.68 to as high as USD 50.
- In North America, consumers majorly prefer out-of-home consumption. In 2022, around 23.1 million individuals consumed food outside at least once a week. The total number of restaurants in the United States was estimated at 101,811 in 2021. As a result, on-trade retailing modes gained popularity during 2018-2021. In North America's on-trade retailing mode, the milk industry held the largest share of 65.84% compared to other dairy product industries in 2022. During 2025-2028, on-trade consumption is expected to increase by 4.5% due to the rising demand for out-of-home consumption.
Increasing awareness regarding benefits of dairy consumption is promoting the market growth
- The dairy industry in the North American region witnessed a growth of 2.98% in 2022 compared to 2021. The growth was observed due to the rising consciousness about health, as dairy products offer a significant volume of essential nutrients. One cup of milk offers 3.4 grams of protein, 5 grams of carbohydrates, 0.6 grams of saturated fat, and other nutrients. This has increased people's interest in dairy products as they seek to maintain a healthy diet. Thus, the dairy industry is expected to grow by 3.2% in 2024.
- In the North American region, the United States dominates the dairy industry. In 2022, the United States held a share of 70.08%. In January 2023, 150,174 convenience stores were operating in the United States, a rise of 1.5% from the 2022 store count, which helped consumers to purchase dairy products.
- Canada held a share of 18.85%. Texas has the most convenience stores with 16,018 stores, while California follows with 12,000 stores. Some of the famous stores in the North American region are Walmart, Amazon, Kroger, and Target. These stores offer a wide variety of dairy products in the market.
- Mexico held a share of 51.02% in 2022. In 2020, there are 33 supermarket chains, with 3,227 stores, 2,365 department stores, and 53,793 specialized stores nationwide. Informal establishments, such as mobile street vendors and open public markets, cover 50% of the retail market. Dairy products are also available at varied prices (low, medium, and high). The base selling price of packaged milk is USD 1.72, which goes as high as USD 50.5. The availability of these products at various price ranges promotes buying power among the population.
North America Dairy Market Trends
Growing demand for dairy-infused baked products and butter-based snacks in North America boosting the market
- The per capita consumption of the North American dairy industry observed growth of 1.33% in 2022 compared to 2021. While milk has a fat content of around 3.95%, skim solids are recorded to contain 8.94%. These average percentages of both milk fat and skim solids in farm milk (cows' milk from dairy farms) have increased over the last decade. Consequently, consumers are becoming more aware of the benefits derived from dairy products, such as improved strength, consumption of natural ingredients, and other advantages, leading to a rising demand for dairy products in the North American region.
- Consumers in the North American region also gravitated toward butter-based snack products such as cookies and crunchies. Consequently, there was an increase in the import volume of butter. In 2022, butter prices in the United States rose due to additional imports, aligning them with international price levels. The strong demand for premium butter, coupled with the lifting of import tariffs in early 2021, contributed to this trend. Notably, butter imports increased by 0.4 billion pounds in 2021, and estimates based on a milk-fat basis project imports to reach 6.9 billion pounds by 2023.
- With the growing demand for baked foods, including pizza, Baked Macaroni with Mortadella, and other cheese-based products, the demand for cheese is also increasing in the region. Domestic cheese consumption showed continued growth of 2.7% in 2021. To meet the demand for cheese-based foods, cheese imports increased every month (except for February and December) compared to the same months in 2020, reaching a total of 0.3 billion pounds in 2021, marking a 13.2% increase. Cheese production also saw a 2.8% increase, reaching 13.6 billion pounds in 2021.
North America Dairy Industry Overview
The North America Dairy Market is fragmented, with the top five companies occupying 18.52%. The major players in this market are Danone SA, Froneri International Limited, Groupe Lactalis, The Kraft Heinz Company and Unilever PLC (sorted alphabetically).
Additional Benefits:
- The market estimate (ME) sheet in Excel format
- 3 months of analyst support
TABLE OF CONTENTS
1 EXECUTIVE SUMMARY & KEY FINDINGS
2 REPORT OFFERS
3 INTRODUCTION
- 3.1 Study Assumptions & Market Definition
- 3.2 Scope of the Study
- 3.3 Research Methodology
4 KEY INDUSTRY TRENDS
- 4.1 Per Capita Consumption
- 4.2 Raw Material/commodity Production
- 4.2.1 Butter
- 4.2.2 Cheese
- 4.2.3 Milk
- 4.3 Regulatory Framework
- 4.3.1 Canada
- 4.3.2 Mexico
- 4.3.3 United States
- 4.4 Value Chain & Distribution Channel Analysis
5 MARKET SEGMENTATION (includes market size in Value in USD and Volume, Forecasts up to 2030 and analysis of growth prospects)
- 5.1 Category
- 5.1.1 Butter
- 5.1.1.1 By Product Type
- 5.1.1.1.1 Cultured Butter
- 5.1.1.1.2 Uncultured Butter
- 5.1.2 Cheese
- 5.1.2.1 By Product Type
- 5.1.2.1.1 Natural Cheese
- 5.1.2.1.2 Processed Cheese
- 5.1.3 Cream
- 5.1.3.1 By Product Type
- 5.1.3.1.1 Double Cream
- 5.1.3.1.2 Single Cream
- 5.1.3.1.3 Whipping Cream
- 5.1.3.1.4 Others
- 5.1.4 Dairy Desserts
- 5.1.4.1 By Product Type
- 5.1.4.1.1 Cheesecakes
- 5.1.4.1.2 Frozen Desserts
- 5.1.4.1.3 Ice Cream
- 5.1.4.1.4 Mousses
- 5.1.4.1.5 Others
- 5.1.5 Milk
- 5.1.5.1 By Product Type
- 5.1.5.1.1 Condensed milk
- 5.1.5.1.2 Flavored Milk
- 5.1.5.1.3 Fresh Milk
- 5.1.5.1.4 Powdered Milk
- 5.1.5.1.5 UHT Milk
- 5.1.6 Sour Milk Drinks
- 5.1.7 Yogurt
- 5.1.7.1 By Product Type
- 5.1.7.1.1 Flavored Yogurt
- 5.1.7.1.2 Unflavored Yogurt
- 5.1.1 Butter
- 5.2 Distribution Channel
- 5.2.1 Off-Trade
- 5.2.1.1 Convenience Stores
- 5.2.1.2 Online Retail
- 5.2.1.3 Specialist Retailers
- 5.2.1.4 Supermarkets and Hypermarkets
- 5.2.1.5 Others (Warehouse clubs, gas stations, etc.)
- 5.2.2 On-Trade
- 5.2.1 Off-Trade
- 5.3 Country
- 5.3.1 Canada
- 5.3.2 Mexico
- 5.3.3 United States
- 5.3.4 Rest of North America
6 COMPETITIVE LANDSCAPE
- 6.1 Key Strategic Moves
- 6.2 Market Share Analysis
- 6.3 Company Landscape
- 6.4 Company Profiles (includes Global Level Overview, Market Level Overview, Core Business Segments, Financials, Headcount, Key Information, Market Rank, Market Share, Products and Services, and Analysis of Recent Developments).
- 6.4.1 Agropur Dairy Cooperative
- 6.4.2 Conagra Brands Inc.
- 6.4.3 Dairy Farmers of America Inc.
- 6.4.4 Danone SA
- 6.4.5 Froneri International Limited
- 6.4.6 Groupe Lactalis
- 6.4.7 Nestle SA
- 6.4.8 Organic Valley
- 6.4.9 Prairie Farms Dairy Inc.
- 6.4.10 Saputo Inc.
- 6.4.11 The Kraft Heinz Company
- 6.4.12 Umpqua Dairy Products Co.
- 6.4.13 Unilever PLC
7 KEY STRATEGIC QUESTIONS FOR DAIRY AND DAIRY ALTERNATIVE CEOS
8 APPENDIX
- 8.1 Global Overview
- 8.1.1 Overview
- 8.1.2 Porter's Five Forces Framework
- 8.1.3 Global Value Chain Analysis
- 8.1.4 Market Dynamics (DROs)
- 8.2 Sources & References
- 8.3 List of Tables & Figures
- 8.4 Primary Insights
- 8.5 Data Pack
- 8.6 Glossary of Terms
