
|
市場調査レポート
商品コード
1693734
アフリカの飼料用酵素-市場シェア分析、産業動向・統計、成長予測(2025年~2030年)Africa Feed Enzymes - Market Share Analysis, Industry Trends & Statistics, Growth Forecasts (2025 - 2030) |
||||||
カスタマイズ可能
適宜更新あり
|
|||||||
| アフリカの飼料用酵素-市場シェア分析、産業動向・統計、成長予測(2025年~2030年) |
|
出版日: 2025年03月18日
発行: Mordor Intelligence
ページ情報: 英文 205 Pages
納期: 2~3営業日
|

全表示
- 概要
- 目次
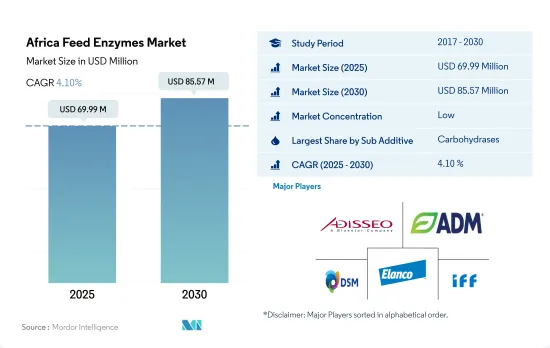
アフリカの飼料用酵素市場規模は2025年に6,999万米ドルと予測され、2030年には8,557万米ドルに達すると予測され、予測期間(2025~2030年)のCAGRは4.10%で成長すると予測されます。
- アフリカの飼料用酵素市場は近年成長が鈍化し、2022年には飼料添加物市場全体の3.8%を占めるに過ぎなかりました。しかし南アフリカは、2022年の飼料生産量が1,100万トンと大きいため、この地域の支配的な参入企業として台頭し、市場シェアの47.4%を占めました。
- 市場は、鳥インフルエンザとASFの発生による飼料生産の減少により、2019年に28%の減少を確認したが、カーボハイドラーゼは、動物飼料からのタンパク質、ミネラル、脂質の摂取量を増加させる能力により、市場で重要な飼料用酵素として浮上しました。炭水化物分解酵素セグメントは2022年に飼料用酵素市場の50%を占めました。
- 動物タイプの中では、家禽類が非水溶性多糖類の消化を助けることから、飼料用炭水化物分解酵素セグメントで最大のセグメントであり、2022年の市場シェアの57.9%を占めます。
- 南アフリカはアフリカで最も急成長している国であり、予測期間中(2023~2029年)にCAGR 4.7%を記録すると予想されています。しかし、同地域ではカーボヒドラーゼとフィターゼの両方が同程度の成長率を示しており、予測期間中のCAGRはそれぞれ4.1%を記録すると予想されています。
- 飼料添加物の使用に対する意識の高まりや食肉・家畜の需要といった要因が、アフリカの飼料用酵素市場の成長を促進すると予想されます。特に穀物価格が高騰している場合、酵素作用によって動物の体内に吸収される穀物量が増加するため、予測期間中にCAGR 4.1%を記録すると予想されます。
- アフリカの飼料用酵素市場は、2017~2022年の間に6.0%の緩やかな成長を経験し、世界の飼料添加物市場における金額ベースのシェアは約3.7%でした。しかし、この地域は、南アフリカなどの主要国のGDP成長率が崩壊し、消費者の消費力が低下し、飼料生産が減少したため、2019年に急激な落ち込みに直面しました。
- 挫折にもかかわらず、南アフリカはアフリカの飼料用酵素市場において国別セグメントで最大の規模を維持し、2022年には約2,950万米ドルを占め、エジプトが1,110万米ドルで続きました。飼料用酵素の最大の消費者は鳥類で、2022年の金額シェアは55.7%、反芻動物は32.2%、養豚は7.5%、水産養殖は3.5%でした。豚肉需要の増加により、豚用飼料用酵素市場は予測期間(2023~2029年)のCAGRが4.9%と、最も速い速度で成長すると予想されます。
- 2022年、アフリカ地域は全動物タイプ向けに約1億3,100万トンの配合飼料を生産し、南アフリカがシェアの29%以上を占めました。2021年、南アフリカはアフリカ地域の家禽鳥類セグメントで8%以上のシェアを占めました。
- 食肉需要の高まりと健康的な動物食に対する意識の高まりが、この地域における飼料用酵素消費の成長を促進しています。その結果、世界の飼料用酵素市場のアフリカ地域は、2023~2029年の間にCAGR 4.1%を記録すると予測されており、主要企業がアフリカの飼料用酵素市場で事業を拡大するための十分な機会を提供しています。
アフリカの飼料用酵素市場動向
一人当たりの家禽肉と卵の消費量が増加し、より高い利益率がアフリカ地域の家禽生産を増加させています。
- アフリカの養鶏産業は、商業活動において、また自給自足農業従事者や農村コミュニティに良質なタンパク質を提供する上で重要な役割を果たしています。2022年のアフリカの総動物頭数のうち61.5%を家禽が占めているのは、同地域における家禽肉と鶏卵の需要増によるものです。家禽鳥の頭数は2017年から8.8%増加し、2022年には22億頭となり、主に同地域の養鶏場の成長に牽引されました。
- 家禽鳥の中でもブロイラーは、同地域における食肉需要の増加により非常に飼育されています。南アフリカでは、国際的と国内的な鶏肉価格と利益率の上昇を利用するために主要生産者が産業に投資したため、鶏肉生産量は2021年の157万トンから2022年には157万7,000トンに増加しました。
- アフリカの養鶏産業は、主要輸入国からの鶏肉製品に対する需要の高まりにより拡大しており、養鶏への投資の増加に繋がっています。例えば、2021年には、南アフリカ最大の鶏肉生産者の1つであるQuantum Foodsが、孵化場の建設や生産性を高めるためのブロイラー農場の改良など、養鶏事業に1,400万米ドル以上を投資しました。
- 南アフリカにおける1人当たりの鶏肉消費量は、2017年の33.7kgから2022年には35.09kgに増加します。牛肉や羊肉など他の動物性タンパク質の価格が上昇しているため、予測期間中(2023~2029年)のCAGRは7.5%を記録すると予想されます。これらの要因により、予測期間中に養殖場数と頭数が増加すると予測されます。
総合的な魚類養殖の開発と内水面漁業の発展が複合養殖飼料の需要を増加させている
- 養殖業は、アフリカの多くの国々で農業部門の最大産業の一つとなっています。不利な気候条件と漁獲量の減少により、この地域における配合飼料の使用量は2018年と比較して2019年には60%減少しました。同地域における淡水と海洋養殖の増加により配合飼料の需要が急増し、2019年から152%増加し、2022年には150万トンに達しました。このような増加にもかかわらず、2022年の養殖飼料生産量はアフリカの飼料生産量の4.3%を占めるに過ぎないです。
- 最近の養殖生産量の増加は、押出飼料の使用、農場管理方法の改善、投資の増加など、栄養飼料の用途が大幅に拡大したことによるもので、その結果、配合飼料の生産量は2020~2022年にかけて1.3%増加しました。例えば、エジプトの養殖飼料産業は急速な発展を遂げ、従来のペレット飼料が10%であったのが、高品質の押出飼料に90%シフトしました。養殖開発基金や、ナイジェリアなど他の国々における同様の政府制度は、この地域での養殖を推進し、それによって飼料生産を増加させると予想されます。
- エジプトの漁業・養殖開発計画では、一貫養殖の拡大、内陸漁業の開発、メガ国家的生産を通じて、2025年までに魚類生産量を300万トンに増やすことを目指しています。したがって、水産養殖生産の増加、高品質の押出飼料の使用の増加、投資の増加が、この地域の飼料生産を促進すると予想されます。
アフリカの飼料用酵素産業概要
アフリカの飼料用酵素市場はセグメント化されており、上位5社で18.19%を占めています。この市場の主要企業は、Adisseo、Archer Daniel Midland Co.、DSM Nutritional Products AG、Elanco Animal Health Inc.、IFF(Danisco Animal Nutrition)などです。
その他の特典
- エクセル形式の市場予測(ME)シート
- 3ヶ月のアナリストサポート
目次
第1章 エグゼクティブサマリーと主要調査結果
第2章 レポートのオファー
第3章 イントロダクション
- 調査の前提条件と市場定義
- 調査範囲
- 調査手法
第4章 主要産業動向
- 動物頭数
- 家禽
- 反芻動物
- 豚
- 飼料生産
- 水産養殖
- 家禽
- 反芻動物
- 養豚
- 規制の枠組み
- エジプト
- ケニア
- 南アフリカ
- バリューチェーンと流通チャネル分析
第5章 市場セグメンテーション
- サブ添加物
- 炭水化物分解酵素
- フィターゼ
- その他の酵素
- 動物
- 水産養殖
- サブ動物別
- 魚類
- エビ
- その他の養殖種
- 家禽類
- 小動物別
- ブロイラー
- レイヤー
- その他の鳥類
- 反芻動物
- 小動物別
- 肉牛
- 乳牛
- その他の反芻動物
- 豚
- その他の動物
- 水産養殖
- 国名
- エジプト
- ケニア
- 南アフリカ
- その他のアフリカ
第6章 競合情勢
- 主要な戦略動向
- 市場シェア分析
- 企業情勢
- 企業プロファイル
- Adisseo
- Alltech, Inc.
- Archer Daniel Midland Co.
- BASF SE
- Brenntag SE
- Cargill Inc.
- DSM Nutritional Products AG
- Elanco Animal Health Inc.
- IFF(Danisco Animal Nutrition)
- Kemin Industries
第7章 CEOへの主要戦略的質問
第8章 付録
- 世界概要
- 概要
- ファイブフォース分析フレームワーク
- 世界のバリューチェーン分析
- 世界市場規模とDRO
- 情報源と参考文献
- 図表リスト
- 主要な洞察
- データパック
- 用語集
The Africa Feed Enzymes Market size is estimated at 69.99 million USD in 2025, and is expected to reach 85.57 million USD by 2030, growing at a CAGR of 4.10% during the forecast period (2025-2030).
- The African feed enzymes market showed slow growth in recent years, accounting for only 3.8% of the total feed additives market in 2022. However, South Africa emerged as a dominant player in the region, accounting for 47.4% of the market share due to its significant feed production of 11 million metric tons in 2022.
- Although the market witnessed a decline of 28% in 2019 due to reduced feed production as a result of Avian flu and ASF outbreaks, carbohydrases emerged as a significant feed enzyme in the market due to their ability to increase the intake of protein, minerals, and lipids from animal feed. The carbohydrases segment accounted for 50% of the feed enzymes market in 2022.
- Among animal types, poultry birds are the largest segment of the feed carbohydrases segment, accounting for 57.9% of the market share in 2022, as carbohydrases aid in the digestion of non-soluble polysaccharides.
- South Africa is the fastest-growing country in Africa, and it is expected to register a CAGR of 4.7% during the forecast period (2023-2029). However, both carbohydrases and phytases are growing at an equal rate in the region and are expected to record a CAGR of 4.1% each during the forecast period.
- Factors such as the increasing awareness of the usage of feed additives and the demand for meat and livestock are expected to drive the African feed enzymes market's growth. It is expected to record a CAGR of 4.1% during the forecast period as enzymatic action increases the amount of cereal absorbed in an animal body, particularly when cereal prices are high.
- The African feed enzymes market experienced moderate growth of 6.0% during 2017-2022, with a share by value of approximately 3.7% in the global feed additives market. However, the region faced a sudden dip in 2019 due to the collapsed GDP growth of major countries, such as South Africa, leading to reduced consumer spending power and decreased feed production.
- Despite the setback, South Africa remained the largest country-wise segment in the African feed enzymes market, accounting for around USD 29.5 million in 2022, followed by Egypt with USD 11.1 million. Poultry birds were the largest consumers of feed enzymes, accounting for a 55.7% share by value in 2022, while ruminants, swine, and aquaculture accounted for shares of 32.2%, 7.5%, and 3.5%, respectively. Due to the growing demand for pork, the swine feed enzymes market is expected to grow at the fastest rate, with a CAGR of 4.9% during the forecast period (2023-2029).
- In 2022, the African region produced approximately 131 million metric ton of compound feed for all animal types, with South Africa accounting for more than 29% of the share. In 2021, South Africa held more than an 8% share of the poultry bird segment in the African region.
- The rising demand for meat and increasing awareness of healthy animal diets are driving the growth of feed enzyme consumption in the region. As a result, the African region of the global feed enzyme market is projected to record a CAGR of 4.1% between 2023 and 2029, providing ample opportunities for key players to expand their business in the African feed enzymes market.
Africa Feed Enzymes Market Trends
The increasing per capita consumption of poultry meat and eggs with higher profit margins which is increasing the poultry production in Africa region
- The African poultry industry plays an important role in commercial activities and in providing quality protein to subsistence farmers and rural communities. Poultry birds accounted for 61.5% of the total animal headcount in Africa in 2022 due to the rising demand for poultry meat and eggs in the region. The number of poultry birds increased by 8.8% from 2017 to 2.2 billion heads in 2022, largely driven by the growth of poultry farms in the region.
- Among the poultry birds, broilers were highly raised due to the increasing demand for meat in the region. In South Africa, chicken meat production increased from 1,570 thousand metric tons in 2021 to 1,577 thousand metric tons in 2022 as major producers invested in the industry to capitalize on higher international and domestic poultry prices and profit margins.
- The African poultry industry is expanding due to the growing demand for poultry products from key importing countries, leading to increased investments in poultry farming. For example, in 2021, Quantum Foods, one of South Africa's largest poultry producers, invested over USD 14 million in its poultry operations, including constructing hatcheries and upgrading broiler farms to boost productivity.
- The per capita consumption of poultry meat in South Africa rose from 33.7 kg in 2017 to 35.09 kg in 2022. It is expected to register a CAGR of 7.5% during the forecast period (2023-2029) due to the increasing prices of other animal proteins like beef and lamb. These factors are projected to increase the number of farms and headcount during the forecast period.
Expansion of integrated fish farming and development of inland fisheries is increasing the demand for compound aqua feed
- Aquaculture farming has become one of the largest industries in the agriculture sector in many countries across Africa. Due to unfavorable climatic conditions and a reduction in fish catch, the usage of compound feed in the region decreased by 60% in 2019 compared to 2018. The increase in freshwater and marine aquaculture farming in the region caused a surge in demand for compound feed, which grew by 152% from 2019 to reach 1.5 million metric tons in 2022. Despite this increase, aquaculture feed production only accounted for 4.3% of African feed production in 2022.
- The recent rise in aquaculture production is credited to a significant expansion in the application of nutritional feed, such as the use of extruded feed, improved farm management practices, and an increase in investments, which led to a 1.3% growth in the production of compound feed from 2020 to 2022. For example, the Egyptian aquaculture feed industry underwent rapid development, with a shift from conventionally pelleted feeds at 10% to high-quality extruded feeds at 90%. The Fish Farming Development Fund and similar government schemes in other countries, such as Nigeria, are expected to drive aquaculture farming in the region, thereby increasing feed production.
- Egypt's fisheries and aquaculture development plan aims to increase fish production to 3 million metric tons by 2025 through the expansion of integrated fish farming, development of inland fisheries, and mega-national productions. Therefore, an increase in aquaculture production, a rise in the usage of high-quality extruded feed, and an increase in investments are expected to drive feed production in the region.
Africa Feed Enzymes Industry Overview
The Africa Feed Enzymes Market is fragmented, with the top five companies occupying 18.19%. The major players in this market are Adisseo, Archer Daniel Midland Co., DSM Nutritional Products AG, Elanco Animal Health Inc. and IFF(Danisco Animal Nutrition) (sorted alphabetically).
Additional Benefits:
- The market estimate (ME) sheet in Excel format
- 3 months of analyst support
TABLE OF CONTENTS
1 EXECUTIVE SUMMARY & KEY FINDINGS
2 REPORT OFFERS
3 INTRODUCTION
- 3.1 Study Assumptions & Market Definition
- 3.2 Scope of the Study
- 3.3 Research Methodology
4 KEY INDUSTRY TRENDS
- 4.1 Animal Headcount
- 4.1.1 Poultry
- 4.1.2 Ruminants
- 4.1.3 Swine
- 4.2 Feed Production
- 4.2.1 Aquaculture
- 4.2.2 Poultry
- 4.2.3 Ruminants
- 4.2.4 Swine
- 4.3 Regulatory Framework
- 4.3.1 Egypt
- 4.3.2 Kenya
- 4.3.3 South Africa
- 4.4 Value Chain & Distribution Channel Analysis
5 MARKET SEGMENTATION (includes market size in Value in USD and Volume, Forecasts up to 2030 and analysis of growth prospects)
- 5.1 Sub Additive
- 5.1.1 Carbohydrases
- 5.1.2 Phytases
- 5.1.3 Other Enzymes
- 5.2 Animal
- 5.2.1 Aquaculture
- 5.2.1.1 By Sub Animal
- 5.2.1.1.1 Fish
- 5.2.1.1.2 Shrimp
- 5.2.1.1.3 Other Aquaculture Species
- 5.2.2 Poultry
- 5.2.2.1 By Sub Animal
- 5.2.2.1.1 Broiler
- 5.2.2.1.2 Layer
- 5.2.2.1.3 Other Poultry Birds
- 5.2.3 Ruminants
- 5.2.3.1 By Sub Animal
- 5.2.3.1.1 Beef Cattle
- 5.2.3.1.2 Dairy Cattle
- 5.2.3.1.3 Other Ruminants
- 5.2.4 Swine
- 5.2.5 Other Animals
- 5.2.1 Aquaculture
- 5.3 Country
- 5.3.1 Egypt
- 5.3.2 Kenya
- 5.3.3 South Africa
- 5.3.4 Rest of Africa
6 COMPETITIVE LANDSCAPE
- 6.1 Key Strategic Moves
- 6.2 Market Share Analysis
- 6.3 Company Landscape
- 6.4 Company Profiles (includes Global Level Overview, Market Level Overview, Core Business Segments, Financials, Headcount, Key Information, Market Rank, Market Share, Products and Services, and Analysis of Recent Developments).
- 6.4.1 Adisseo
- 6.4.2 Alltech, Inc.
- 6.4.3 Archer Daniel Midland Co.
- 6.4.4 BASF SE
- 6.4.5 Brenntag SE
- 6.4.6 Cargill Inc.
- 6.4.7 DSM Nutritional Products AG
- 6.4.8 Elanco Animal Health Inc.
- 6.4.9 IFF(Danisco Animal Nutrition)
- 6.4.10 Kemin Industries
7 KEY STRATEGIC QUESTIONS FOR FEED ADDITIVE CEOS
8 APPENDIX
- 8.1 Global Overview
- 8.1.1 Overview
- 8.1.2 Porter's Five Forces Framework
- 8.1.3 Global Value Chain Analysis
- 8.1.4 Global Market Size and DROs
- 8.2 Sources & References
- 8.3 List of Tables & Figures
- 8.4 Primary Insights
- 8.5 Data Pack
- 8.6 Glossary of Terms
