
|
市場調査レポート
商品コード
1693501
米国の特殊肥料:市場シェア分析、産業動向、成長予測(2025年~2030年)United States Specialty Fertilizer - Market Share Analysis, Industry Trends & Statistics, Growth Forecasts (2025 - 2030) |
||||||
カスタマイズ可能
適宜更新あり
|
|||||||
| 米国の特殊肥料:市場シェア分析、産業動向、成長予測(2025年~2030年) |
|
出版日: 2025年03月18日
発行: Mordor Intelligence
ページ情報: 英文 197 Pages
納期: 2~3営業日
|

全表示
- 概要
- 目次
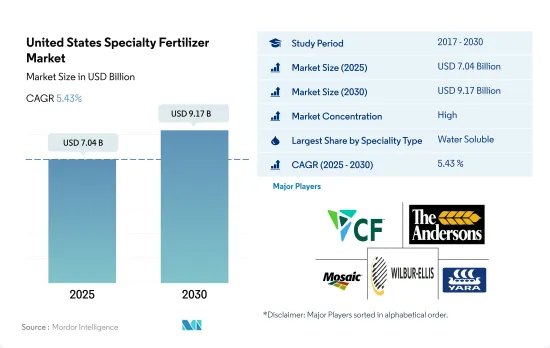
米国の特殊肥料市場規模は2025年に70億4,000万米ドルと推定・予測され、2030年には91億7,000万米ドルに達し、予測期間(2025~2030年)のCAGRは5.43%で成長すると予測されます。
サステイナブル灌漑農法の採用が増加し、特殊品の採用が急増
- 2018~2022年にかけて、米国の特殊肥料市場は2.5%の数量成長を示し、その潜在性と多様な作物タイプにわたる市場機会の拡大に後押しされました。
- 2022年までに、水溶性肥料が48.0%と大きな市場シェアを占め、液体肥料が46.3%、放出制御肥料(CRF)が5.1%で続きました。対照的に、緩効性肥料のシェアは0.6%にとどまったが、これは主に小麦、トウモロコシ、その他の穀物などの主要作物での採用が限られているためです。
- 水溶性肥料の需要は、その多様な栄養グレードと、葉面散布、施肥、土壌散布を含む多様な施用方法によって支えられています。特に、水溶性肥料は調査期間中に1.9%の数量成長を記録しました。
- 米国の液体肥料セグメントは、調査期間中に2.0%の顕著な伸びを示しました。この成長は、精密農業の採用の増加、施肥の容易さ、ワゴンの利用可能性などの要因によるものです。さらに、同国ではマイクロ灌漑システムが拡大しており、このセグメントの成長をさらに後押しする展望です。
- 2017年、同国には5,800万エーカーの灌漑農地がありました。開発中のマイクロ灌漑システムを通じて水溶性肥料が均等に分配されることで、養分の利用可能性が高まり、その結果、養分補給効率が向上しました。
- CAGRが5.2%と予測される米国の特殊肥料市場は、2023~2030年にかけて勢いを増すと考えられます。この成長を支えているのは、従来の肥料が環境に与える影響を抑制しようとする政府の関心の高まりと、技術的・科学的進歩の同時進行です。
米国の特殊肥料市場の動向
大豆とトウモロコシは米国で栽培されている2大作物です。
- 米国では人口が緩やかに増加し、2020年の3億3,590万人から2022年には3億3,820万人に増加します。過去20年間で、全米の農地面積は5,000万エーカー近く縮小し、2022年には8億9,340万エーカーに落ち着いています。このように農地が減少していることから、農業生産性の向上が急務となっています。作物の収量を高めるために、肥料は長い間使用されてきました。2022年には、トウモロコシ、綿花、大豆、小麦といった4つの主要作物が、米国における主要作物作付面積の65.7%を占めることになります。
- 大豆とトウモロコシが米国の主要作物として君臨し、2022年には大豆が全米耕地面積の25.8%を占めてトップに立ち、僅差でトウモロコシが25.7%、小麦が11.1%で続きます。これらの作物は、インディアナ州、イリノイ州、アイオワ州、ミズーリ州、ネブラスカ州、カンザス州の一部を含む「コーンベルト」で主に栽培されています。トウモロコシと大豆の生産がこの地域を支配しています。さらに、米国は重要なコメ輸出国として浮上しており、米国農務省によれば、栽培は南部の3地域とカリフォルニア州の1地域に集中しています。
- 農業資材メーカーは、農業従事者の正確な施肥を支援するため、積極的に技術革新を行っています。これは栽培コストを抑えるだけでなく、効率も高めています。米国の畑作セグメントは大きな市場ポテンシャルを秘めており、政府からの資金援助や支援が急増することで、今後数年間は積極的な成長が見込まれます。
窒素欠乏は、米国の作付面積全体で最も広く見られる作物養分の問題のひとつです。
- 畑作物の一次養分(窒素、カリウム、リン)の国内平均施用量は約166.61キログラム/ヘクタールです。窒素は45.93%、カリウムは28.11%、リンは25.96%です。
- 畑作物では、菜種/カノーラの平均一次養分施用量は284.92キログラム/ヘクタールであり、畑作物で最も多くなりました。一次養分では、窒素が平均施用量229.60キログラム/ヘクタールで第1位を占めています。これは、窒素が植物の代謝に大量に必要であり、葉緑素やアミノ酸の主成分であるためです。
- トウモロコシ/メイズが2番目に多く、次いで菜種/カノーラで平均245.40キログラム/ヘクタールです。トウモロコシは、米国の畑作物総生産量の約31.44パーセントを占めています。トウモロコシに必要な窒素は平均50.06%、リンは平均23.77%、カリは平均26.17%です。
- 一次栄養素は植物の成長に不可欠であり、植物酵素の機能を高め、植物細胞の成長と生化学的プロセスを改善します。一次栄養素の欠乏は、植物の健康、成長、作物生産高に影響を及ぼす可能性があります。畑作物への一次栄養素の施用は、生産性を高めることで需要を満たすために増加すると予想されます。
米国の特殊肥料産業概要
米国の特殊肥料市場はかなり統合されており、上位5社で73.24%を占めています。この市場の主要企業は、CF Industries Holdings、Inc.、The Andersons Inc.、The Mosaic Company、Wilbur-Ellis Company LLC、Yara International ASAなどです。
その他の特典
- エクセル形式の市場予測(ME)シート
- 3ヶ月のアナリストサポート
目次
第1章 エグゼクティブサマリーと主要調査結果
第2章 レポートのオファー
第3章 イントロダクション
- 調査の前提条件と市場定義
- 調査範囲
- 調査手法
第4章 主要産業動向
- 主要作物の作付面積
- 畑作物
- 園芸作物
- 平均養分施用率
- 微量栄養素
- 畑作物
- 園芸作物
- 一次栄養素
- 畑作物
- 園芸作物
- 二次多量栄養素
- 畑作物
- 園芸作物
- 微量栄養素
- 灌漑農地
- 規制の枠組み
- バリューチェーンと流通チャネル分析
第5章 市場セグメンテーション
- スペシャリティタイプ
- CRF
- ポリマーコート
- ポリマー硫黄コーティング
- その他
- 液体肥料
- SRF
- 水溶性
- CRF
- 施肥モード
- 施肥
- 葉面散布
- 土壌
- 作物タイプ
- 畑作物
- 園芸作物
- 芝・観賞用
第6章 競合情勢
- 主要な戦略動向
- 市場シェア分析
- 企業情勢
- 企業プロファイル
- CF Industries Holdings, Inc.
- Haifa Group
- ICL Group Ltd
- Koch Industries Inc.
- Nutrien Ltd.
- Sociedad Quimica y Minera de Chile SA
- The Andersons Inc.
- The Mosaic Company
- Wilbur-Ellis Company LLC
- Yara International ASA
第7章 CEOへの主要戦略的質問
第8章 付録
- 世界概要
- 概要
- ファイブフォース分析フレームワーク
- 世界のバリューチェーン分析
- 市場力学(DROs)
- 情報源と参考文献
- 図表一覧
- 主要な洞察
- データパック
- 用語集
The United States Specialty Fertilizer Market size is estimated at 7.04 billion USD in 2025, and is expected to reach 9.17 billion USD by 2030, growing at a CAGR of 5.43% during the forecast period (2025-2030).
The adoption of sustainable and irrigation agricultural practices is on the rise, leading to a surge in specialty adoption
- From 2018 to 2022, the specialty fertilizer market in the United States witnessed a 2.5% volume growth, propelled by its potential and expanding market opportunities across diverse crop types.
- By 2022, water-soluble fertilizers commanded a significant market share of 48.0%, followed by liquid fertilizers at 46.3% and controlled-release fertilizers (CRF) at 5.1%. In contrast, slow-release fertilizers held a modest 0.6% share, primarily due to their limited adoption in major crops like wheat, maize, and other cereals.
- The demand for water-soluble fertilizers is buoyed by their diverse nutrient grades and versatile application methods, including foliar, fertigation, and soil application. Notably, water-soluble fertilizers witnessed a 1.9% volume growth during the study period.
- The liquid fertilizers segment in the United States witnessed a notable 2.0% growth during the study period. This growth can be attributed to factors such as the rising adoption of precision farming, the ease of application, and the availability of wagons. Furthermore, the country's expanding micro-irrigation system is poised to further bolster this segment's growth.
- In 2017, the country had 58 million acres of irrigated cropland. The even distribution of water-soluble fertilizers through the developing micro-irrigation system led to heightened nutrient availability, resulting in improved nutrient supplementation efficiency.
- With a projected CAGR of 5.2%, the US specialty fertilizer market is set to gain momentum from 2023 to 2030. This growth is underpinned by a heightened governmental focus on curbing the environmental impact of conventional fertilizers and the concurrent surge in technological and scientific advancements.
United States Specialty Fertilizer Market Trends
Soybean and corn are the two largest crops grown in the United States
- The United States witnessed a modest population growth, rising from 335.9 million in 2020 to 338.2 million in the year 2022. Over the past two decades, the nation's farmland area has shrunk by nearly 50 million acres, settling at 893.4 million acres by 2022. This diminishing farmland underscores the urgency to enhance agricultural productivity through Agri inputs. Fertilizers have long been employed to bolster crop yields. In 2022, four key crops, such as corn, cotton, soybean, and wheat, collectively commanded over 65.7% of the principal crop acreage in the United States.
- Soybean and corn reign as the top crops in the United States, with soybean leading the pack in the year 2022, occupying 25.8% of the nation's arable land, followed closely by corn at 25.7%, and wheat at 11.1%. These crops predominantly thrive in the "Corn Belt," encompassing parts of Indiana, Illinois, Iowa, Missouri, Nebraska, and Kansas. Corn and soybean production dominates this region. Furthermore, the United States emerges as a significant rice exporter, with cultivation concentrated in three Southern regions and one in California, as per the United States Department of Agriculture.
- Manufacturers of farm inputs are actively innovating to aid farmers in precise fertilizer application. This not only curbs cultivation costs but also bolsters efficiency. The US field crop sector holds substantial market potential, and with a surge in government funding and support, it is poised for positive growth in the coming years.
Nitrogen deficiency is one of the most prevalent crop nutrient problems across the cropping areas in the United States
- In the field crop's average primary nutrients (Nitrogen, Potassium, and Phosphorus) application rate in the country is about 166.61 kilogram/Hectare. Nitrogen accounts for 45.93 %, Potassium accounts for 28.11 percentage, and phosphorus accounts for 25.96 percentage of total field crops' average primary nutrient application.
- In field crops, Rapeseed/Canola was applied with an average primary nutrient application rate of 284.92 kilogram/Hectare, which is the highest in field crops. In primary nutrients, Nitrogen occupies first place with an average application rate of 229.60 kilogram/Hectare. This is because Nitrogen is required in large amounts for plant metabolism and it is a major component of chlorophyll and amino acids.
- Corn/ Maize is the second largest followed by Rapeseed/ Canola with an average primary nutrient application rate of 245.40 kilogram/ Hectare. Corn accounts for about 31.44 percentage of total field crop production in the United States. The Nitrogen requirement of corn is about 50.06 percentage, phosphorus is 23.77 percentage, and Potash is 26.17 percentage of the total average primary nutrient application.
- The primary nutrients are crucial for plant growth and boost the plant enzyme function, improving plant cell growth and biochemical processes. The deficiency of primary nutrients can affect plant health, growth, and crop production output. The application of primary nutrients in field crops is anticipated to increase to meet the demand by increasing productivity.
United States Specialty Fertilizer Industry Overview
The United States Specialty Fertilizer Market is fairly consolidated, with the top five companies occupying 73.24%. The major players in this market are CF Industries Holdings, Inc., The Andersons Inc., The Mosaic Company, Wilbur-Ellis Company LLC and Yara International ASA (sorted alphabetically).
Additional Benefits:
- The market estimate (ME) sheet in Excel format
- 3 months of analyst support
TABLE OF CONTENTS
1 EXECUTIVE SUMMARY & KEY FINDINGS
2 REPORT OFFERS
3 INTRODUCTION
- 3.1 Study Assumptions & Market Definition
- 3.2 Scope of the Study
- 3.3 Research Methodology
4 KEY INDUSTRY TRENDS
- 4.1 Acreage Of Major Crop Types
- 4.1.1 Field Crops
- 4.1.2 Horticultural Crops
- 4.2 Average Nutrient Application Rates
- 4.2.1 Micronutrients
- 4.2.1.1 Field Crops
- 4.2.1.2 Horticultural Crops
- 4.2.2 Primary Nutrients
- 4.2.2.1 Field Crops
- 4.2.2.2 Horticultural Crops
- 4.2.3 Secondary Macronutrients
- 4.2.3.1 Field Crops
- 4.2.3.2 Horticultural Crops
- 4.2.1 Micronutrients
- 4.3 Agricultural Land Equipped For Irrigation
- 4.4 Regulatory Framework
- 4.5 Value Chain & Distribution Channel Analysis
5 MARKET SEGMENTATION (includes market size in Value in USD and Volume, Forecasts up to 2030 and analysis of growth prospects)
- 5.1 Speciality Type
- 5.1.1 CRF
- 5.1.1.1 Polymer Coated
- 5.1.1.2 Polymer-Sulfur Coated
- 5.1.1.3 Others
- 5.1.2 Liquid Fertilizer
- 5.1.3 SRF
- 5.1.4 Water Soluble
- 5.1.1 CRF
- 5.2 Application Mode
- 5.2.1 Fertigation
- 5.2.2 Foliar
- 5.2.3 Soil
- 5.3 Crop Type
- 5.3.1 Field Crops
- 5.3.2 Horticultural Crops
- 5.3.3 Turf & Ornamental
6 COMPETITIVE LANDSCAPE
- 6.1 Key Strategic Moves
- 6.2 Market Share Analysis
- 6.3 Company Landscape
- 6.4 Company Profiles
- 6.4.1 CF Industries Holdings, Inc.
- 6.4.2 Haifa Group
- 6.4.3 ICL Group Ltd
- 6.4.4 Koch Industries Inc.
- 6.4.5 Nutrien Ltd.
- 6.4.6 Sociedad Quimica y Minera de Chile SA
- 6.4.7 The Andersons Inc.
- 6.4.8 The Mosaic Company
- 6.4.9 Wilbur-Ellis Company LLC
- 6.4.10 Yara International ASA
7 KEY STRATEGIC QUESTIONS FOR FERTILIZER CEOS
8 APPENDIX
- 8.1 Global Overview
- 8.1.1 Overview
- 8.1.2 Porter's Five Forces Framework
- 8.1.3 Global Value Chain Analysis
- 8.1.4 Market Dynamics (DROs)
- 8.2 Sources & References
- 8.3 List of Tables & Figures
- 8.4 Primary Insights
- 8.5 Data Pack
- 8.6 Glossary of Terms
