
豆腐:市場シェア分析、産業動向・統計、成長予測(2025年~2030年)
Tofu - Market Share Analysis, Industry Trends & Statistics, Growth Forecasts (2025 - 2030)- 発行日
- ページ情報
- 英文 352 Pages
- 納期
- 2~3営業日
- 商品コード
- 1693429
- カスタマイズ可能 お客様のご希望に応じて、既存データの加工や未掲載情報(例:国別セグメント)の追加などの対応が可能です。詳細はお問い合わせください。
- 適宜更新あり 本レポートは最新情報反映のため適宜更新し、内容構成変更を行う場合があります。ご検討の際はお問い合わせください。
- 翻訳ツール提供対象 PDF対応AI翻訳ツールの無料貸し出しサービスのご利用が可能です
概要
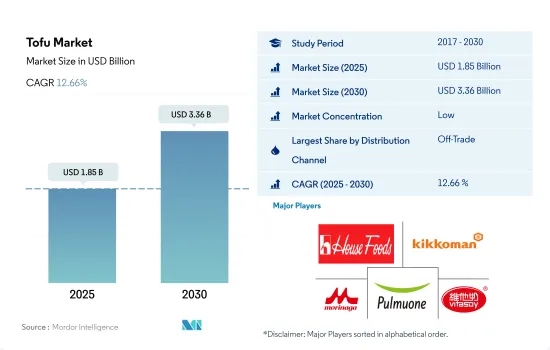
豆腐市場規模は2025年に18億5,000万米ドルと推定され、2030年には33億6,000万米ドルに達し、予測期間中(2025-2030年)のCAGRは12.66%で成長すると予測されます。
菜食主義の動向の高まりが豆腐の売上を押し上げると予想されます。
- 2022年の世界の豆腐市場で主要シェアを占めたのは、取引外の流通チャネルでした。豆腐の価格が安いため、人々は代替肉よりも経済的に実現可能な選択肢として豆腐を好んでおり、これが豆腐の売上を押し上げています。植物性タンパク質製品に対する需要は過去5年間で増加しています。健康と動物福祉に対する懸念から、多くの人々がタンパク質の必要量を満たすために大豆ベースの製品に移行せざるを得なくなりました。スーパーマーケットやコンビニエンスストアへの投資も増加しています。例えば、2022年に東南アジアの5つの市場で16,000以上の店舗を展開する豆腐消費大手のひとつであるセブンイレブンは、地域全体で販売を強化しており、ウォルマートもカナダで巨額の投資を行って店舗を増やし、配送システムをスムーズにしています。
- オントレードセグメントは、予測期間中に最も急成長する流通チャネルとなり、金額ベースでCAGR 10.32%を記録すると予想されています。2022年、1月の1ヶ月間ヴィーガン食を提供するVeganuaryキャンペーンの登録者数は629,000人を超えました。228の国と地域から登録があり、2021年には582,000人が参加しました。このようなヴィーガン動向の高まりは、豆腐をベースにしたヴィーガン料理を提供する外食事業者にも影響を与えました。さらに、ビーガンレストランも全地域で出現しています。
- オンラインチャネル分野は、豆腐の販売において世界的に最も急成長している流通チャネルになると予測されます。消費者がオンラインで買い物をするようになったのは、デジタル決済や非接触型配送による手軽さ、ひとつのプラットフォームで幅広い商品が大幅な割引価格で購入できることなどが理由です。さらに、2022年のインターネット普及率は世界全体で約64.4%でした。
地域の大豆生産と消費需要が市場の主な促進要因
- 2022年に豆腐の消費量が最も多かった地域は欧州です。欧州の豆腐市場は、フレキシタリアンやビーガンの人口の増加や、肉の代替品の消費を奨励する様々な政府の取り組みにより、2017年から22年にかけて金額ベースで7.20%のCAGRを記録しました。欧州委員会は、EUが2050年までにカーボンニュートラルを達成するための戦略を打ち出しました。欧州委員会は、欧州グリーン・ディールの一環として、2021年から2027年の間にグリーン転換に992億米ドルを投資することを約束しました。同計画は、植物性タンパク質や代替タンパク質への財政投資を目的としています。
- アジア太平洋は世界的に最も急成長している地域であり、予測期間中に13.17%のCAGRで推移すると予測されています。アジアの豆腐市場は、消費者と投資家の需要の高まりにより急速に成長すると予想されます。中国は、豆腐製造の主要原料である大豆の生産能力が非常に高いことから、この地域の主要国市場であると見られています。中国政府は、2022年から26年にかけて大豆生産量を40%増の2,300万トンにする目標を表明しており、そのためには輸入を大幅に減らし、国内の食糧安全保障を強化する必要があります。
- 北米も世界の豆腐市場にとって有望な地域であり、世界第2位の豆腐消費国です。2020年、カナダ政府は豆腐のような植物性タンパク質に7,320万米ドルを投資しました。この資金は、国内産のエンドウ豆やキャノーラを豆腐やテンペのような高品質の植物性タンパク質に変えることに特化した事業を行っているMerit Functional Foods社に割り当てられました。
世界の豆腐市場動向
供給障害による大豆価格の高騰が市場に影響
- 2017年から2022年にかけて、豆腐の価格は徐々に2.10%上昇したが、これは主にインフレ率の上昇と、豆腐製造の主成分が大豆であるため、大豆コストが上昇したためです。北米などの主要市場では、需要の増加が豆腐価格の上昇につながりました。市場に参入する企業が増え、売り手は買い手を確保するために価格勝負に出た。米国のインフレは、この地域の大豆製品のコストに影響を与えました。米国の大豆農家は、労働力不足と土地賃借料の上昇、さらに大豆生産国の天候不順が重なり、商品価格を引き上げました。
- 2022年のアジア太平洋地域の豆腐の平均価格は6.03米ドル/kgでした。2022年の最高価格はマレーシアとオーストラリアで記録され、7米ドル/kgでした。オーストラリアでは、豆腐は高級品として販売されており、値上げ幅も大きいです。より安価な選択肢もあるが、オーストラリアの消費者はオーストラリア産の原材料を使った豆腐をより好みます。Australian Grown Certified」ラベルの付いた豆腐の需要は高く、有機大豆から作られた豆腐はより高いプレミアム価格で販売されています。
- 豆腐の価格は2017年から2022年にかけて欧州全体で3.41%上昇し、前年比の平均伸び率は0.96%でした。同地域における大豆の生産量が常に急増していることが、豆腐価格の名目的な上昇の主な理由です。豆腐の価格は、主にウクライナとスペインの大豆生産量に占める割合がそれぞれ22.4%と10.12%と、この地域のほとんどの地域で起こっている全体的な食料インフレの影響も受けています。ウクライナの農地破壊は、同地域の大豆供給に大きな影響を与えました。
豆腐業界の概要
豆腐市場は断片化されており、上位5社で16.92%を占めています。この市場の主要企業は以下の通り。 House Foods Group Inc., Kikkoman Corporation, Morinaga Milk Industry, Pulmuone Corporate and Vitasoy International Holdings Ltd(アルファベット順)
その他の特典
- エクセル形式の市場予測(ME)シート
- 3ヶ月間のアナリストサポート
目次
第1章 エグゼクティブサマリーと主な調査結果
第2章 イントロダクション
- 調査の前提条件と市場定義
- 調査範囲
- 調査手法
第3章 主要産業動向
- 価格動向
- 豆腐
- 規制の枠組み
- オーストラリア
- カナダ
- 中国
- フランス
- ドイツ
- インド
- イタリア
- 日本
- メキシコ
- 英国
- 米国
- バリューチェーンと流通チャネル分析
第4章 市場セグメンテーション
- 流通チャネル
- オフトレード
- コンビニエンスストア
- オンライン・チャネル
- スーパーマーケットとハイパーマーケット
- その他
- オントレード
- オフトレード
- 地域
- アフリカ
- 流通チャネル別
- 国別
- エジプト
- ナイジェリア
- 南アフリカ
- その他のアフリカ
- アジア太平洋
- 流通チャネル別
- 国別
- オーストラリア
- 中国
- インド
- インドネシア
- 日本
- マレーシア
- 韓国
- その他アジア太平洋地域
- 欧州
- 流通チャネル別
- 国別
- フランス
- ドイツ
- イタリア
- オランダ
- ロシア
- スペイン
- 英国
- その他欧州
- 中東
- 流通チャネル別
- 国別
- バーレーン
- クウェート
- オマーン
- カタール
- サウジアラビア
- アラブ首長国連邦
- その他中東
- 北米
- 流通チャネル別
- 国別
- カナダ
- メキシコ
- 米国
- その他北米
- 南米
- 流通チャネル別
- 国別
- アルゼンチン
- ブラジル
- その他南米地域
- アフリカ
第5章 競合情勢
- 主要な戦略動向
- 市場シェア分析
- 企業情勢
- 企業プロファイル
- Eden Foods, Inc.
- House Foods Group Inc.
- Kikkoman Corporation
- Monde Nissin Corporation
- Morinaga Milk Industry Co. Ltd
- PSC Corporation Limited
- Pulmuone Corporate
- Taifun-Tofu GmbH
- The Hain Celestial Group, Inc.
- Tofu Restaurant Co., Ltd.
- Vitasoy International Holdings Ltd
第6章 CEOへの主な戦略的質問
第7章 付録
- 世界概要
- 概要
- ファイブフォース分析フレームワーク
- 世界のバリューチェーン分析
- 市場力学(DROs)
- 情報源と参考文献
- 図表一覧
- 主要洞察
- データパック
- 用語集
目次
Product Code: 92488
The Tofu Market size is estimated at 1.85 billion USD in 2025, and is expected to reach 3.36 billion USD by 2030, growing at a CAGR of 12.66% during the forecast period (2025-2030).
The rising trend of veganism is expected to boost the sales of tofu
- The off-trade distribution channel accounted for the major share of the global tofu market in 2022. Due to the lower price of tofu, people prefer it as a more economically feasible option over meat alternatives, which has been driving its sales. The demand for plant-based protein products has increased over the last five years. With the concerns about health and animal welfare, many people have had to move to soy-based products to meet their protein requirements. There has been an increase in investments in supermarkets and convenience stores. For instance, 7-Eleven, one of the major tofu consumers with more than 16,000 stores across five Southeast Asian markets in 2022, is strengthening sales across the region, while Walmart has also invested a huge amount in Canada to open more stores and smoothen its delivery systems.
- The on-trade segment is anticipated to be the fastest-growing distribution channel during the forecast period, recording a CAGR of 10.32% by value. The sign-ups for the Veganuary campaign in 2022, where people eat vegan for the month of January, were over 629,000. People signed up from 228 countries and territories, and in 2021, there were 582,000 participants. This rise in the vegan trend had implications for food service operators to provide vegan dishes based on tofu. Moreover, vegan restaurants have also emerged across all regions.
- The online channel segment is projected to be the fastest-growing distribution channel for the sales of tofu globally. Consumers started shopping online due to the ease offered by digital payments, contactless delivery, and the availability of a wide range of products on one single platform at huge discounted prices. Moreover, the internet penetration rate was around 64.4% globally in 2022.
Regional soybean production and consumption demand are the primary drivers of the market
- The region with the highest consumption of tofu in 2022 was Europe. The European tofu market registered a CAGR of 7.20% by value over 2017-22, owing to rising flexitarian and vegan populations and various government initiatives to encourage the consumption of meat substitutes. The European Commission set forth its strategies for assisting the European Union in becoming carbon neutral by 2050. The Commission has committed to investing USD 99.2 billion in the green transition between 2021 and 2027 as part of the European Green Deal. The plan aims for financial investments in plant-based and substitute proteins.
- Asia-Pacific is the fastest-growing region globally and is projected to register a value CAGR of 13.17% during the forecast period. The Asian market for tofu is anticipated to grow swiftly due to rising consumer and investor demand. China is observed to be the dominant country market in the region owing to its huge soybean production capacity, which is a major ingredient for manufacturing tofu. The Chinese government has expressed its aim to increase soybean production by 40%, to 23 million tonnes, over the period of 2022-26, thereby requiring significant reduction of imports and strengthening of food security in the country.
- North America is another promising region for the global tofu market and is observed to be the second-largest tofu consumer globally. In 2020, the Canadian government invested USD 73.2 million in plant-based proteins like tofu. The funding was allocated to Merit Functional Foods, a business specializing in transforming peas and canola from domestic sources into high-quality plant-based proteins like tofu and tempeh.
Global Tofu Market Trends
Inflation in soybean prices due to supply disruptions is having an effect on the market
- From 2017 to 2022, the price of tofu gradually rose by 2.10%, primarily due to increasing inflation and soybean costs, as soybeans are the primary component in manufacturing tofu. In major markets like North America, the rising demand led to an increase in the prices of tofu. More companies are entering the market, and sellers are engaging in the price game to secure buyers. Inflation in the United States had an impact on the cost of soybean products in the region. Soybean farmers in the United States increased the prices of the commodity due to labor shortages and increasing land rental costs, compounded by the weather uncertainty in soybean-producing countries.
- In 2022, the average price of tofu in Asia-Pacific was USD 6.03/kg. The highest price in 2022 was recorded in Malaysia and Australia at USD 7/kg. In Australia, tofu is sold as a premium product and has a higher price markup. Although cheaper options are available, Australian consumers have a higher preference for tofu made from Australian ingredients. The demand for tofu with the "Australian Grown Certified" label is high, while tofu made from organic soybeans is sold for a higher premium.
- Tofu prices increased by 3.41% between 2017 and 2022 across Europe, with an average Y-o-Y growth rate of 0.96%. The constantly surging production of soybeans in the region is a key reason for the nominal increase in the price of tofu. The price of tofu is also impacted by the overall food inflation in most parts of the region, mainly in Ukraine and Spain, accounting for shares of 22.4% and 10.12%, respectively, in terms of the region's soybean production. The destruction of agricultural land in Ukraine had a major impact on the soybean supply in the region.
Tofu Industry Overview
The Tofu Market is fragmented, with the top five companies occupying 16.92%. The major players in this market are House Foods Group Inc., Kikkoman Corporation, Morinaga Milk Industry Co. Ltd, Pulmuone Corporate and Vitasoy International Holdings Ltd (sorted alphabetically).
Additional Benefits:
- The market estimate (ME) sheet in Excel format
- 3 months of analyst support
TABLE OF CONTENTS
1 EXECUTIVE SUMMARY & KEY FINDINGS
2 INTRODUCTION
- 2.1 Study Assumptions & Market Definition
- 2.2 Scope of the Study
- 2.3 Research Methodology
3 KEY INDUSTRY TRENDS
- 3.1 Price Trends
- 3.1.1 Tofu
- 3.2 Regulatory Framework
- 3.2.1 Australia
- 3.2.2 Canada
- 3.2.3 China
- 3.2.4 France
- 3.2.5 Germany
- 3.2.6 India
- 3.2.7 Italy
- 3.2.8 Japan
- 3.2.9 Mexico
- 3.2.10 United Kingdom
- 3.2.11 United States
- 3.3 Value Chain & Distribution Channel Analysis
4 MARKET SEGMENTATION (includes market size in Value in USD, Forecasts up to 2030 and analysis of growth prospects)
- 4.1 Distribution Channel
- 4.1.1 Off-Trade
- 4.1.1.1 Convenience Stores
- 4.1.1.2 Online Channel
- 4.1.1.3 Supermarkets and Hypermarkets
- 4.1.1.4 Others
- 4.1.2 On-Trade
- 4.1.1 Off-Trade
- 4.2 Region
- 4.2.1 Africa
- 4.2.1.1 By Distribution Channel
- 4.2.1.2 By Country
- 4.2.1.2.1 Egypt
- 4.2.1.2.2 Nigeria
- 4.2.1.2.3 South Africa
- 4.2.1.2.4 Rest of Africa
- 4.2.2 Asia-Pacific
- 4.2.2.1 By Distribution Channel
- 4.2.2.2 By Country
- 4.2.2.2.1 Australia
- 4.2.2.2.2 China
- 4.2.2.2.3 India
- 4.2.2.2.4 Indonesia
- 4.2.2.2.5 Japan
- 4.2.2.2.6 Malaysia
- 4.2.2.2.7 South Korea
- 4.2.2.2.8 Rest of Asia-Pacific
- 4.2.3 Europe
- 4.2.3.1 By Distribution Channel
- 4.2.3.2 By Country
- 4.2.3.2.1 France
- 4.2.3.2.2 Germany
- 4.2.3.2.3 Italy
- 4.2.3.2.4 Netherlands
- 4.2.3.2.5 Russia
- 4.2.3.2.6 Spain
- 4.2.3.2.7 United Kingdom
- 4.2.3.2.8 Rest of Europe
- 4.2.4 Middle East
- 4.2.4.1 By Distribution Channel
- 4.2.4.2 By Country
- 4.2.4.2.1 Bahrain
- 4.2.4.2.2 Kuwait
- 4.2.4.2.3 Oman
- 4.2.4.2.4 Qatar
- 4.2.4.2.5 Saudi Arabia
- 4.2.4.2.6 United Arab Emirates
- 4.2.4.2.7 Rest of Middle East
- 4.2.5 North America
- 4.2.5.1 By Distribution Channel
- 4.2.5.2 By Country
- 4.2.5.2.1 Canada
- 4.2.5.2.2 Mexico
- 4.2.5.2.3 United States
- 4.2.5.2.4 Rest of North America
- 4.2.6 South America
- 4.2.6.1 By Distribution Channel
- 4.2.6.2 By Country
- 4.2.6.2.1 Argentina
- 4.2.6.2.2 Brazil
- 4.2.6.2.3 Rest of South America
- 4.2.1 Africa
5 COMPETITIVE LANDSCAPE
- 5.1 Key Strategic Moves
- 5.2 Market Share Analysis
- 5.3 Company Landscape
- 5.4 Company Profiles (includes Global level Overview, Market level overview, Core Business Segments, Financials, Headcount, Key Information, Market Rank, Market Share, Products and Services, and analysis of Recent Developments)
- 5.4.1 Eden Foods, Inc.
- 5.4.2 House Foods Group Inc.
- 5.4.3 Kikkoman Corporation
- 5.4.4 Monde Nissin Corporation
- 5.4.5 Morinaga Milk Industry Co. Ltd
- 5.4.6 PSC Corporation Limited
- 5.4.7 Pulmuone Corporate
- 5.4.8 Taifun-Tofu GmbH
- 5.4.9 The Hain Celestial Group, Inc.
- 5.4.10 Tofu Restaurant Co., Ltd.
- 5.4.11 Vitasoy International Holdings Ltd
6 KEY STRATEGIC QUESTIONS FOR MEAT SUBSTITUTES INDUSTRY CEOS
7 APPENDIX
- 7.1 Global Overview
- 7.1.1 Overview
- 7.1.2 Porter's Five Forces Framework
- 7.1.3 Global Value Chain Analysis
- 7.1.4 Market Dynamics (DROs)
- 7.2 Sources & References
- 7.3 List of Tables & Figures
- 7.4 Primary Insights
- 7.5 Data Pack
- 7.6 Glossary of Terms
豆腐:市場シェア分析、産業動向・統計、成長予測(2025年~2030年)
- 発行日
- 発行
- Mordor Intelligence
- ページ情報
- 英文 352 Pages
- 納期
- 2~3営業日


