
米国の豆腐:市場シェア分析、産業動向・統計、成長予測(2025年~2030年)
United States Tofu - Market Share Analysis, Industry Trends & Statistics, Growth Forecasts (2025 - 2030)- 発行日
- ページ情報
- 英文 155 Pages
- 納期
- 2~3営業日
- 商品コード
- 1692071
- カスタマイズ可能 お客様のご希望に応じて、既存データの加工や未掲載情報(例:国別セグメント)の追加などの対応が可能です。詳細はお問い合わせください。
- 適宜更新あり 本レポートは最新情報反映のため適宜更新し、内容構成変更を行う場合があります。ご検討の際はお問い合わせください。
- 翻訳ツール提供対象 PDF対応AI翻訳ツールの無料貸し出しサービスのご利用が可能です
概要
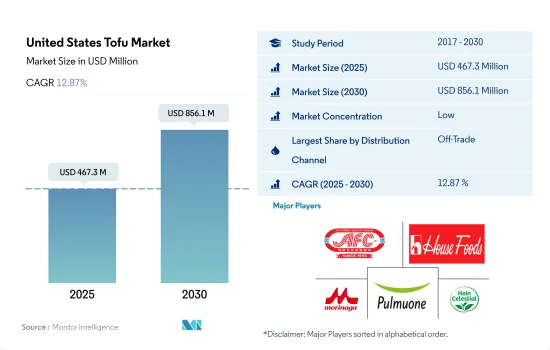
米国の豆腐の市場規模は2025年に4億6,730万米ドルと予測され、2030年には8億5,610万米ドルに達し、予測期間(2025~2030年)のCAGRは12.87%で成長すると予測されます。
eコマース・チャネルの拡大による豆腐市場の新バリエーションへの需要増加が市場を牽引
- 米国の豆腐市場は、流通チャネルの観点からオフ・トレード・セグメントが支配的であり、金額ベースではオン・トレードの流通チャネルよりも43%多いシェアを占めています。米国の豆腐市場のオフ・トレード・セグメントの中で、スーパーマーケットとハイパーマーケットの市場シェアが最も高く、2022年には金額ベースで69%を占めました。米国には2022年末時点で63,328の食料品店があり、機能しています。さらに、セルフレジのキオスクやウォークアウト技術などのイノベーションがスーパーマーケットを牽引しています。
- 米国全体の豆腐市場は、2017年から2022年にかけて金額で41.9%、数量で40.80%の成長率を示しました。この増加は主にスーパーマーケット、ホテル、食品企業、食料品店、その他の流通チャネルの増加によるものです。スーパーマーケットの数は2021年から2022年にかけて4.3%増加し、オンライン・チャネルは2020年から2021年にかけて20%増加しました。顧客接点の増加が豆腐販売の増加につながりました。国内では豆腐の生産量が増加しています。ハウスフーズ・アメリカは大手豆腐メーカーであり、カリフォルニアの施設で36,000平方フィートの施設を拡張し、50%増の豆腐を生産しています。同様に、プルムオネ社は現在、米国西部のカリフォルニア州フラートンで3つの豆腐製造工場を運営しています。
- 取引外の流通チャネルにおけるオンラインチャネルは、米国の豆腐市場で最も急成長している流通チャネルであり、予測期間中のCAGRは16.15%を記録すると予測されています。消費者の技術導入の増加に伴い、メーカーもeコマースを通じてデジタルでの存在感を高めています。ウォルマートは全米で最も人気のある食料品店チェーンで、2022年時点で市場シェアの25.2%を占めています。CostcoとKrogerは、それぞれ7.1%と5.6%のシェアを持ち、2番目と3番目に人気のある食料品店です。
米国の豆腐市場動向
ひよこ豆製品に対する国内需要の高まりが価格設定を支え、生産の伸びを加速させています。
- 植物ベースの食生活を送る米国人は2022年までに約970万人に増加し、そのうち約100万人がビーガンです。その結果、ビーガン市場が活況を呈し、豆腐を中心とする代替肉の消費が急増しました。レストランやファーストフードチェーンも豆腐メニューを提供し始めています。需要の増加に伴い、国内では豆腐の平均価格も2017年から2022年にかけて8.32%上昇しました。味付け豆腐、マリネ豆腐、味付け済み豆腐など、豆腐製品の種類も拡大しており、便利で風味豊かな植物性タンパク質を求める顧客にアピールしています。
- 大豆は、家畜が人間用の大豆を消費しているため、豆腐メーカーへの供給が減少し、市場力学の異常により、より高価になっています。2021年、米国のインフレ率は7%に達し、大豆製品の価格に影響を与えました。労働力の減少、土地賃借料の上昇、大豆生産国の天候不順が米国の大豆農家の値上げにつながりました。2021年の大豆価格は最高で1ブッシェル当たり14.8米ドルに達したが、2022年には16米ドルを超えました。予測期間中、豆腐は高価になると予想され、これは米国人のタンパク質に対する支払い意欲を理解するのに役立つかもしれないです。豆腐は通常大豆から作られます。しかし、この分野における最近の進歩により、ひよこ豆から作られる豆腐が米国市場で人気を集めています。ひよこ豆製品に対する国内需要の高まりが、価格設定を支え、生産の伸びを加速させています。ひよこ豆の食料品店価格は、2021年から12%上昇し、パンデミック前と比べると17%高くなりました。この動向は、国内のひよこ豆ベースの豆腐のコストに直接影響します。
米国の豆腐産業の概要
米国の豆腐市場は細分化されており、上位5社で25.35%を占めています。この市場の主要企業は以下の通りです。 American Food Company, House Foods Group Inc., Morinaga Milk Industry, Pulmuone Corporate and The Hain Celestial Group, Inc.(sorted alphabetically).
その他の特典
- エクセル形式の市場予測(ME)シート
- 3ヶ月のアナリストサポート
目次
第1章 エグゼクティブサマリーと主な調査結果
第2章 イントロダクション
- 調査の前提条件と市場定義
- 調査範囲
- 調査手法
第3章 主要産業動向
- 価格動向
- 豆腐
- 規制の枠組み
- 米国
- バリューチェーンと流通チャネル分析
第4章 市場セグメンテーション
- 流通チャネル
- オフトレード
- コンビニエンスストア
- オンライン・チャネル
- スーパーマーケットとハイパーマーケット
- その他
- オントレード
- オフトレード
第5章 競合情勢
- 主要な戦略動向
- 市場シェア分析
- 企業情勢
- 企業プロファイル
- Albertsons Companies
- American Food Company
- Hodo Inc.
- House Foods Group Inc.
- Morinaga Milk Industry Co. Ltd
- Pulmuone Corporate
- Superior Natural LLC
- The Hain Celestial Group, Inc.
第6章 CEOへの主な戦略的質問
第7章 付録
- 世界概要
- 概要
- ファイブフォース分析フレームワーク
- 世界のバリューチェーン分析
- 市場力学(DROs)
- 情報源と参考文献
- 図表一覧
- 主要洞察
- データパック
- 用語集
目次
The United States Tofu Market size is estimated at 467.3 million USD in 2025, and is expected to reach 856.1 million USD by 2030, growing at a CAGR of 12.87% during the forecast period (2025-2030).
Increasing demand for new variants in the tofu market through the expanded e-commerce channels drives the market
- The US tofu market is dominated by the off-trade segment in terms of distribution channels, with 43% more share by value than the on-trade distribution channel. Among all the off-trade segments of the US tofu market, supermarkets and hypermarkets had the highest market share, with 69% by value, in 2022. The US had a large number of functioning grocery stores at 63,328 at the end of 2022. Furthermore, innovations like self-checkout kiosks and walk-out technology drive supermarkets.
- The overall US tofu market grew at a rate of 41.9% by value and 40.80% by volume from 2017 to 2022. This increase was mainly due to the rise in the number of supermarkets, hotels, food enterprises, grocery stores, and other distribution channels. The number of supermarkets increased by 4.3% from 2021 to 2022, and online channels rose by 20% from 2020 to 2021. The growth of customer touchpoints led to an increase in tofu sales. Tofu production has been increasing in the country. House Foods America is a leading tofu manufacturer, producing 50% more tofu in its California facility by expanding its footprint by a 36,000 sq. ft facility. Similarly, Pulmuone is currently operating three tofu manufacturing plants in Fullerton, CA, in the Western US.
- The online channel in the off-trade distribution channel is projected to be the fastest-growing distribution channel in the US tofu market, registering a CAGR of 16.15% during the forecast period. With the rise in technological adoption by consumers, manufacturers also increased their digital presence through e-commerce. Walmart was the most popular grocery store chain nationwide, with 25.2% of the market share as of 2022. Costco and Kroger are the second and third-most popular grocers, with 7.1% and 5.6% of the market share, respectively.
United States Tofu Market Trends
The growing domestic demand for chickpea products has supported the pricing and accelerated production growth
- The number of Americans following plant-based diets increased to nearly 9.7 million by 2022, and about one million of them are vegan. As a result, the vegan market boomed, resulting in a surge in the consumption of meat alternatives, primarily tofu. Restaurants and fast-food chains are also starting to accommodate tofu options. With the increased demand, the average price of tofu also increased by 8.32% from 2017 to 2022 in the country. There has been an expansion in the variety of tofu products, including flavored, marinated, and pre-seasoned tofu, which is appealing to customers looking for convenient and flavorful plant-based protein.
- Soybeans are getting more expensive because of unusual market dynamics as the livestock are consuming the soybeans meant for humans, leading to a lower supply for tofu makers. In 2021, the US inflation reached 7%, impacting the prices of soybean products. A reduction in labor, an increase in land rental costs, and weather uncertainty in soybean-producing countries led soybean farmers in the United States to increase prices. In 2021, the price of soybeans reached a maximum of up to USD 14.8 per bushel, whereas in 2022, the price exceeded USD 16 per bushel. During the forecast period, tofu is expected to be expensive, which may help understand Americans' willingness to pay for the protein. Tofu is typically made from soybeans. However, owing to recent advancements in the sector, tofu made from chickpeas is gaining traction in the US market. The growing domestic demand for chickpea products has supported the pricing and accelerated production growth. The grocery store prices for chickpeas were up by 12% from 2021 and 17% higher than they were pre-pandemic. This trend directly affects the cost of chickpea-based tofu in the country.
United States Tofu Industry Overview
The United States Tofu Market is fragmented, with the top five companies occupying 25.35%. The major players in this market are American Food Company, House Foods Group Inc., Morinaga Milk Industry Co. Ltd, Pulmuone Corporate and The Hain Celestial Group, Inc. (sorted alphabetically).
Additional Benefits:
- The market estimate (ME) sheet in Excel format
- 3 months of analyst support
TABLE OF CONTENTS
1 EXECUTIVE SUMMARY & KEY FINDINGS
2 INTRODUCTION
- 2.1 Study Assumptions & Market Definition
- 2.2 Scope of the Study
- 2.3 Research Methodology
3 KEY INDUSTRY TRENDS
- 3.1 Price Trends
- 3.1.1 Tofu
- 3.2 Regulatory Framework
- 3.2.1 United States
- 3.3 Value Chain & Distribution Channel Analysis
4 MARKET SEGMENTATION (includes market size in Value in USD, Forecasts up to 2030 and analysis of growth prospects)
- 4.1 Distribution Channel
- 4.1.1 Off-Trade
- 4.1.1.1 Convenience Stores
- 4.1.1.2 Online Channel
- 4.1.1.3 Supermarkets and Hypermarkets
- 4.1.1.4 Others
- 4.1.2 On-Trade
- 4.1.1 Off-Trade
5 COMPETITIVE LANDSCAPE
- 5.1 Key Strategic Moves
- 5.2 Market Share Analysis
- 5.3 Company Landscape
- 5.4 Company Profiles (includes Global level Overview, Market level overview, Core Business Segments, Financials, Headcount, Key Information, Market Rank, Market Share, Products and Services, and analysis of Recent Developments)
- 5.4.1 Albertsons Companies
- 5.4.2 American Food Company
- 5.4.3 Hodo Inc.
- 5.4.4 House Foods Group Inc.
- 5.4.5 Morinaga Milk Industry Co. Ltd
- 5.4.6 Pulmuone Corporate
- 5.4.7 Superior Natural LLC
- 5.4.8 The Hain Celestial Group, Inc.
6 KEY STRATEGIC QUESTIONS FOR MEAT SUBSTITUTES INDUSTRY CEOS
7 APPENDIX
- 7.1 Global Overview
- 7.1.1 Overview
- 7.1.2 Porter's Five Forces Framework
- 7.1.3 Global Value Chain Analysis
- 7.1.4 Market Dynamics (DROs)
- 7.2 Sources & References
- 7.3 List of Tables & Figures
- 7.4 Primary Insights
- 7.5 Data Pack
- 7.6 Glossary of Terms
- 発行日
- 発行
- Mordor Intelligence
- ページ情報
- 英文 155 Pages
- 納期
- 2~3営業日


