
|
市場調査レポート
商品コード
1692568
赤身肉:市場シェア分析、産業動向・統計、成長予測(2025年~2030年)Red Meat - Market Share Analysis, Industry Trends & Statistics, Growth Forecasts (2025 - 2030) |
||||||
カスタマイズ可能
適宜更新あり
|
|||||||
| 赤身肉:市場シェア分析、産業動向・統計、成長予測(2025年~2030年) |
|
出版日: 2025年03月18日
発行: Mordor Intelligence
ページ情報: 英文 466 Pages
納期: 2~3営業日
|

全表示
- 概要
- 目次
概要
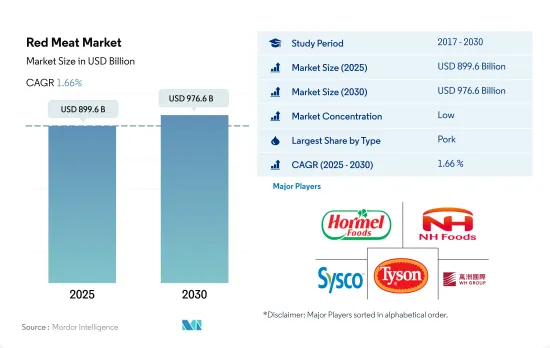
赤身肉の市場規模は2025年に8,996億米ドルと推定され、2030年には9,766億米ドルに達すると予測され、予測期間(2025-2030年)のCAGRは1.66%で成長します。
アジア太平洋が世界の消費を支配し、豚肉が好まれる
- 赤身肉市場は過去期間に世界的に成長し、2017年から2022年までの金額ベースのCAGRは2.64%を記録しました。この成長は主に、高タンパク食品としての食肉の世界の受け入れ拡大によるものです。食肉消費量の全体的な伸びは、開発途上国で5倍になると予測されています。
- すべての食肉の種類の中で、豚肉は赤身肉の最大のシェアを占め、調査期間を通じて世界的に優位を占めると予想されます。豚肉は低価格のため消費量が多いです。例えば2022年、中国では豚肉の価格は4,850米ドル/トンであったのに対し、牛肉の価格は1万359米ドル/トンでした。アジア太平洋は最大の豚肉消費地域であり、2022年のシェアは65.65%でした。主に伝統的な汎アジア料理の調理に肉がよく使われるため、消費が拡大しています。
- 牛肉は赤身肉の消費量では世界第2位です。成長率は一貫しておらず、過去期間中に金額で減少したが、その主な原因は、他のどの種類の肉よりも25~30%高い価格でした。この動向は消費者の食肉嗜好に影響を与えました。例えば北米の消費者では、37%が価格が消費率に影響を与える主な要因だと感じています。
- マトンは世界的に最も急成長している赤身肉の種類であり、2017~2022年の期間に3.98%のCAGRを記録しました。また、マトンは伝統的にほとんどの地域で特定の祝日のための季節の食品とみなされており、イースターとクリスマスには小売売上高が大きく急増します。消費者は店頭購入により多くの金額を費やし、より健康的な家庭料理を好みます。ロースとモモ肉が最も消費される部位で、2021年には45%の数量シェアを占め、さらに21%を肩ロースが占める。
政府の取り組みが市場成長を後押し
- 健康志向の高まりに伴い、多くの消費者がより多くのタンパク質を摂取するようになり、その結果、世界的にタンパク質需要が急増しています。赤身肉の生産量は数量ベースで2.87%増加し、2022年には人口が8,000万人増加するため、赤身肉の消費量は世界的に増加します。
- アジア太平洋地域は、2022年に数量でも金額でも大きな市場シェアを占めました。アジア太平洋ではベジタリアンが人口の42%を占めるが、中国では一人当たりの消費量が多いため、赤肉の消費量は多いです。政府の支援による生産の増加により、アジア太平洋では赤肉加工への投資が増加しています。より加工された赤肉製品の消費へのシフトが、アジアでの赤肉販売を牽引しています。例えば、2021年に中国のNDRCは、赤肉加工を増やすために最大770万米ドルを割り当てると発表しました。
- 欧州は赤身肉の消費で第2位のシェアを占めています。豚肉は欧州で最も消費されている赤肉です。2021年、欧州の豚肉市場は生産量の増加を経験しました。EU市場のリーダーはスペイン、デンマーク、オランダで生産拡大を続けています。その結果、豚肉消費量は欧州全域、特に南部で増加しました。
- アフリカは世界の赤身肉市場で最も急成長する地域と予測され、予測期間中の予想CAGRは金額ベースで3.88%です。持続的な人口増加、1人当たり実質所得の上昇、都市化が赤肉消費の増加を牽引しています。アフリカは農産物が余っている開発途上地域であるため、多くの企業や政府が生産拠点を設立しています。
世界の赤肉市場の動向
地域間の生産が需要の伸びを後押しする可能性が高い
- 牛肉生産量は2017年から2022年にかけて6.90%増加しました。USDAの2022年4月の予測によると、2023年の世界の牛肉生産量は1%近く増加して5,960万トンになると予想されています。アルゼンチンの干ばつにより牛群の離散が増え、生産量は前年比6%増加しました。同様に、肥育ストールの大型化と牛の処理頭数の増加により、米国の生産量は2022年4月から1%増加すると予想されます。ニュージーランドの生産量は、雄の乳用子牛が肉用牛として販売されるようになったため、3%増加します。
- 投入コストが高いため、EUの生産量はと殺頭数の減少と体重の減少により1%減少します。ニュージーランド、オーストラリア、アルゼンチン、ブラジルの見通しが上方修正され、メキシコ、英国、EUの見通しの減少を相殺しました。中国の旺盛な需要がブラジルとアルゼンチンの供給を引きつけると予想されます。オーストラリアは、日本と韓国の需要増加の恩恵を受けそうです。さらに、米国の加工牛肉に対する旺盛な需要が、オーストラリアとニュージーランドからの供給を押し上げると思われます。
- 牛肉生産は北米が主流で、2022年には32.13%を生産しました。北米の牛肉生産は、干ばつによる生産コストの上昇と飼料費の増加によって大きな影響を受けました。干ばつは北米西部の産地にも悪影響を与えました。2022年1月1日、カナダの肉牛在庫は5年連続で1%減少し、350万頭に達しました。米国全体の肉牛在庫は前年比2%減の9,190万頭に達しました。南米も世界の牛肉生産に貢献しており、2022年には世界の牛肉生産のほぼ20.12%を生産します。世界の牛肉需要の増加により、生産と生産性の向上が進みました。
地域間の生産不安が価格に影響
- 牛肉の世界平均価格は2017年から2022年にかけて9.15%上昇し、米国が6.93米ドル/kgと最も高い価格を占めました。牛肉は世界中で旺盛な需要と高値に直面しており、国際市場力学が目に見えて変化しています。個々の国や地域における干ばつや消費者需要の増加といった地域的な混乱は、今や世界貿易により大きな影響を及ぼしています。
- 牛肉生産上位国の価格を左右する主な要因には、米国における需要主導型の牛肉価格高騰があります。米国の牛肉セクターは明らかに需要主導型市場にあり、2022年の価格は2017年比で40.75%上昇しました。ブラジルでは、季節的な雨の遅れにより牛の生産頭数が減少し、加工業者は特に中国市場の需要を考慮して牛の価格を引き上げ、供給を維持せざるを得なくなりました。市場はEU全域で家畜供給の減少に直面し、その結果、家畜部門の収益性が悪化しました。2023年6月の米国における様々な形態の牛肉の小売価格は、挽肉が5.028米ドル/ポンド、未調理の牛ロースが7.020米ドル/ポンド、牛ステーキが10.359米ドル/ポンドでした。
- 中国では、国内牛肉生産量の伸びが鈍化し、アフリカ豚熱の発生時に豚肉から牛肉への代替を促した国内消費量の伸びに追いつけなかったため、2021年と2022年には牛肉の輸入量が増加し、これが国内価格の上昇につながりました。豪州の供給は世界市場にも影響を与えました。連続する干ばつと大規模な牛群整理により、豪州の牛の頭数は過去30年間で最低となりました。2021年2月、オーストラリアの若齢牛の価格は前年比で約20%上昇しました。
赤身肉業界の概要
赤肉市場は細分化されており、上位5社で9.80%を占めています。この市場の主要企業は以下の通り。 Hormel Foods Corporation, NH Foods Ltd, Sysco Corporation, Tyson Foods Inc. and WH Group Limited(アルファベット順)。
その他の特典
- エクセル形式の市場予測(ME)シート
- 3ヶ月のアナリスト・サポート
目次
第1章 エグゼクティブサマリーと主な調査結果
第2章 イントロダクション
- 調査の前提条件と市場定義
- 調査範囲
- 調査手法
第3章 主要産業動向
- 価格動向
- 牛肉
- マトン
- 豚肉
- 生産動向
- 牛肉
- マトン
- 豚肉
- 規制の枠組み
- オーストラリア
- カナダ
- 中国
- インド
- 日本
- メキシコ
- サウジアラビア
- アラブ首長国連邦
- 米国
- バリューチェーンと流通チャネル分析
第4章 市場セグメンテーション
- 種類
- 牛肉
- マトン
- 豚肉
- その他の食肉
- 形態
- 缶詰
- 生鮮・冷蔵
- 冷凍
- 加工
- 流通チャネル
- オフ・トレード
- コンビニエンスストア
- オンライン・チャネル
- スーパーマーケットとハイパーマーケット
- その他
- オン・トレード
- オフ・トレード
- 地域
- アフリカ
- タイプ別
- 形態別
- 流通チャネル別
- 国別
- エジプト
- ナイジェリア
- 南アフリカ
- その他のアフリカ
- アジア太平洋
- タイプ別
- 形態別
- 流通チャネル別
- 国別
- オーストラリア
- 中国
- インド
- インドネシア
- 日本
- マレーシア
- 韓国
- その他アジア太平洋地域
- 欧州
- タイプ別
- 形態別
- 流通チャネル別
- 国別
- フランス
- ドイツ
- イタリア
- オランダ
- ロシア
- スペイン
- 英国
- その他欧州
- 中東
- タイプ別
- 形態別
- 流通チャネル別
- 国別
- バーレーン
- クウェート
- オマーン
- カタール
- サウジアラビア
- アラブ首長国連邦
- その他中東
- 北米
- タイプ別
- 形態別
- 流通チャネル別
- 国別
- カナダ
- メキシコ
- 米国
- その他北米
- 南米
- タイプ別
- 形態別
- 流通チャネル別
- 国別
- アルゼンチン
- ブラジル
- その他南米地域
- アフリカ
第5章 競合情勢
- 主要な戦略動向
- 市場シェア分析
- 企業情勢
- 企業プロファイル
- Australian Agricultural Co. Ltd.
- BRF S.A.
- Cargill Inc.
- Hormel Foods Corporation
- Itoham Yonekyu Holdings, Inc.
- JBS SA
- Marfrig Global Foods S.A.
- Minerva SA
- NH Foods Ltd
- OSI Group
- Starzen Co., Ltd.
- Sysco Corporation
- Tyson Foods Inc.
- Tonnies Holding ApS & Co. KG
- WH Group Limited
第6章 CEOへの主な戦略的質問
第7章 付録
- 世界概要
- 概要
- ファイブフォース分析フレームワーク
- 世界のバリューチェーン分析
- 市場力学(DROs)
- 情報源と参考文献
- 図表一覧
- 主要洞察
- データパック
- 用語集
目次
Product Code: 92392
The Red Meat Market size is estimated at 899.6 billion USD in 2025, and is expected to reach 976.6 billion USD by 2030, growing at a CAGR of 1.66% during the forecast period (2025-2030).
Asia-Pacific dominates global consumption, with pork being the preferred choice
- The red meat market grew globally during the historical period, registering a CAGR of 2.64% from 2017 to 2022 by value. This growth was majorly due to the increasing acceptance of meat as a high-protein food globally. The overall growth in the volume of meat consumption is anticipated to be five times greater in developing nations.
- Among all the meat types, pork is expected to dominate worldwide throughout the study period, accounting for the largest share of red meat. Pork is highly consumed due to its lower price point. For instance, in 2022, pork was priced at USD 4,850/ton in China, while beef was priced at USD 10,359/ton. Asia-Pacific was observed to be the largest pork-consuming region, with a share of 65.65% in 2022. The consumption is expanding, mainly due to the popular usage of meat to prepare traditional pan-Asian dishes.
- Beef was the second largest type of red meat consumed globally. The growth rates have not been consistent and declined in value during the historical period, mainly attributed to its price, which was 25-30% higher than any other meat type. This trend impacted consumer meat preferences. For instance, among consumers in North America, 37% felt that price is the main factor impacting consumption rates.
- Mutton was the fastest-growing red meat type globally, registering a CAGR of 3.98% over the period of 2017-2022. Mutton is also traditionally regarded as a seasonal food for specific holidays in most regions, with large retail sales spikes during Easter and Christmas. Consumers spend more on in-store purchases and prefer healthier home-cooked items. Loin and leg were the most consumed cuts, accounting for 45% volume share, while another 21% was held by shoulder cuts in 2021.
Government initiatives will boost market growth
- With the rise in health consciousness, many consumers have shifted to consuming higher amounts of protein, and as a result, the demand for protein has spiked globally. The production of red meat increased by 2.87% by volume, with an increase in the population of 80 million in 2022, resulting in an increase in the consumption of red meat globally.
- Asia-Pacific occupied a significant market share both by volume and value in 2022. Though the vegetarian population accounts for 42% of the population in Asia-Pacific, red meat consumption is high due to high per capita consumption in China. Investments in red meat processing are increasing in Asia-Pacific due to increased production with government support. The shift in the consumption of more processed red meat products drives the sales of red meat in Asia. For instance, in 2021, NDRC in China announced that it would allocate up to USD 7.7 million to increase red meat processing.
- Europe occupies the second-largest share in the consumption of red meat. Pork is the most consumed red meat type in Europe. In 2021, the European pork meat market experienced rising output. EU market leaders continue to expand production in Spain, Denmark, and the Netherlands. As a result, pork consumption increased across Europe, particularly in the south.
- Africa is predicted to be the fastest-growing region in the global red meat market, with an anticipated CAGR of 3.88% by value during the forecast period. Sustained population growth, a rise in real per capita income, and urbanization drive the increase in red meat consumption. As Africa is a developing region with surplus agricultural produce, many companies and governments are establishing production centers.
Global Red Meat Market Trends
Production across regions is likely to boost a growth in demand
- Beef production grew by 6.90% between 2017 and 2022. Global beef production for 2023 is anticipated to increase by nearly 1% to 59.6 million tons, according to USDA's April 2022 forecast. The drought in Argentina has led to more herd break-ups and increased production by 6% compared to the previous year. Similarly, larger fattening stalls and higher slaughter of cows are expected to boost US production by 1% from April 2022. New Zealand production will increase by 3% as male dairy calves are now marketed for beef.
- Due to the high input costs, EU production is cut by 1% due to lower slaughter numbers and lower weights. Upward revisions in forecasts for New Zealand, Australia, Argentina, and Brazil offset declines in forecasts for Mexico, the United Kingdom, and the European Union. Strong demand from China is expected to attract supplies from Brazil and Argentina. Australia is likely to benefit from increasing demand from Japan and South Korea. Additionally, strong US demand for processed beef will boost supplies from Australia and New Zealand.
- Beef production is dominated by North America, which produced 32.13% in 2022. Beef production in North America was highly impacted by the increased production costs and increased feed expenses due to dry conditions. The drought also negatively affected locations in western North America. On January 1, 2022, in Canada, beef cow inventories were down by 1% for the fifth consecutive year, reaching 3.5 million heads. The total US cattle inventories were down by 2% compared to last year, reaching 91.9 million heads. South America also caters to global beef production, producing almost 20.12% of global beef production in 2022. The increased beef demand worldwide increased production and productivity gains.
Production uncertainties across regions are impacting the prices
- The average global price of beef increased by 9.15% between 2017 and 2022, with the United States accounting for the highest price at USD 6.93/kg. Beef has faced strong demand and high prices worldwide, with a visible change in international market dynamics. Local disruptions, such as droughts and increasing consumer demand in individual countries or regions, now exert a greater impact on global trade.
- Key drivers influencing prices in top beef-producing countries include a demand-driven surge in beef prices in the United States. The US beef sector has clearly been in a demand-driven market, witnessing a 40.75% price increase in 2022 compared to 2017. In Brazil, a delay in seasonal rains leads to the production of fewer cattle, forcing processors to raise cattle prices and maintain supply, particularly given demand in the Chinese market. The market faced a reduction in livestock supply across the European Union, resulting in poor profitability of the sector. In June 2023, the retail prices of different forms of beef in the United States were USD 5.028/lb for ground beef, USD 7.020/lb for uncooked beef roasts, and USD 10.359/lb for beef steaks.
- In China, slow growth in domestic beef production, which failed to keep up with local consumption growth prompted by pork-to-beef substitution during the African swine fever outbreak, led to rising beef imports in 2021 and 2022, which, in turn, led to a rise in prices in the country. Australia's supply also impacted the world market, as consecutive years of drought and large herd liquidations resulted in the country's lowest cattle population in 30 years. Australian young stock prices were up by almost 20% in February 2021 compared to the previous year.
Red Meat Industry Overview
The Red Meat Market is fragmented, with the top five companies occupying 9.80%. The major players in this market are Hormel Foods Corporation, NH Foods Ltd, Sysco Corporation, Tyson Foods Inc. and WH Group Limited (sorted alphabetically).
Additional Benefits:
- The market estimate (ME) sheet in Excel format
- 3 months of analyst support
TABLE OF CONTENTS
1 EXECUTIVE SUMMARY & KEY FINDINGS
2 INTRODUCTION
- 2.1 Study Assumptions & Market Definition
- 2.2 Scope of the Study
- 2.3 Research Methodology
3 KEY INDUSTRY TRENDS
- 3.1 Price Trends
- 3.1.1 Beef
- 3.1.2 Mutton
- 3.1.3 Pork
- 3.2 Production Trends
- 3.2.1 Beef
- 3.2.2 Mutton
- 3.2.3 Pork
- 3.3 Regulatory Framework
- 3.3.1 Australia
- 3.3.2 Canada
- 3.3.3 China
- 3.3.4 India
- 3.3.5 Japan
- 3.3.6 Mexico
- 3.3.7 Saudi Arabia
- 3.3.8 United Arab Emirates
- 3.3.9 United States
- 3.4 Value Chain & Distribution Channel Analysis
4 MARKET SEGMENTATION (includes market size in Value in USD, Forecasts up to 2030 and analysis of growth prospects)
- 4.1 Type
- 4.1.1 Beef
- 4.1.2 Mutton
- 4.1.3 Pork
- 4.1.4 Other Meat
- 4.2 Form
- 4.2.1 Canned
- 4.2.2 Fresh / Chilled
- 4.2.3 Frozen
- 4.2.4 Processed
- 4.3 Distribution Channel
- 4.3.1 Off-Trade
- 4.3.1.1 Convenience Stores
- 4.3.1.2 Online Channel
- 4.3.1.3 Supermarkets and Hypermarkets
- 4.3.1.4 Others
- 4.3.2 On-Trade
- 4.3.1 Off-Trade
- 4.4 Region
- 4.4.1 Africa
- 4.4.1.1 By Type
- 4.4.1.2 By Form
- 4.4.1.3 By Distribution Channel
- 4.4.1.4 By Country
- 4.4.1.4.1 Egypt
- 4.4.1.4.2 Nigeria
- 4.4.1.4.3 South Africa
- 4.4.1.4.4 Rest of Africa
- 4.4.2 Asia-Pacific
- 4.4.2.1 By Type
- 4.4.2.2 By Form
- 4.4.2.3 By Distribution Channel
- 4.4.2.4 By Country
- 4.4.2.4.1 Australia
- 4.4.2.4.2 China
- 4.4.2.4.3 India
- 4.4.2.4.4 Indonesia
- 4.4.2.4.5 Japan
- 4.4.2.4.6 Malaysia
- 4.4.2.4.7 South Korea
- 4.4.2.4.8 Rest of Asia-Pacific
- 4.4.3 Europe
- 4.4.3.1 By Type
- 4.4.3.2 By Form
- 4.4.3.3 By Distribution Channel
- 4.4.3.4 By Country
- 4.4.3.4.1 France
- 4.4.3.4.2 Germany
- 4.4.3.4.3 Italy
- 4.4.3.4.4 Netherlands
- 4.4.3.4.5 Russia
- 4.4.3.4.6 Spain
- 4.4.3.4.7 United Kingdom
- 4.4.3.4.8 Rest of Europe
- 4.4.4 Middle East
- 4.4.4.1 By Type
- 4.4.4.2 By Form
- 4.4.4.3 By Distribution Channel
- 4.4.4.4 By Country
- 4.4.4.4.1 Bahrain
- 4.4.4.4.2 Kuwait
- 4.4.4.4.3 Oman
- 4.4.4.4.4 Qatar
- 4.4.4.4.5 Saudi Arabia
- 4.4.4.4.6 United Arab Emirates
- 4.4.4.4.7 Rest of Middle East
- 4.4.5 North America
- 4.4.5.1 By Type
- 4.4.5.2 By Form
- 4.4.5.3 By Distribution Channel
- 4.4.5.4 By Country
- 4.4.5.4.1 Canada
- 4.4.5.4.2 Mexico
- 4.4.5.4.3 United States
- 4.4.5.4.4 Rest of North America
- 4.4.6 South America
- 4.4.6.1 By Type
- 4.4.6.2 By Form
- 4.4.6.3 By Distribution Channel
- 4.4.6.4 By Country
- 4.4.6.4.1 Argentina
- 4.4.6.4.2 Brazil
- 4.4.6.4.3 Rest of South America
- 4.4.1 Africa
5 COMPETITIVE LANDSCAPE
- 5.1 Key Strategic Moves
- 5.2 Market Share Analysis
- 5.3 Company Landscape
- 5.4 Company Profiles (includes Global level Overview, Market level overview, Core Business Segments, Financials, Headcount, Key Information, Market Rank, Market Share, Products and Services, and analysis of Recent Developments)
- 5.4.1 Australian Agricultural Co. Ltd.
- 5.4.2 BRF S.A.
- 5.4.3 Cargill Inc.
- 5.4.4 Hormel Foods Corporation
- 5.4.5 Itoham Yonekyu Holdings, Inc.
- 5.4.6 JBS SA
- 5.4.7 Marfrig Global Foods S.A.
- 5.4.8 Minerva SA
- 5.4.9 NH Foods Ltd
- 5.4.10 OSI Group
- 5.4.11 Starzen Co., Ltd.
- 5.4.12 Sysco Corporation
- 5.4.13 Tyson Foods Inc.
- 5.4.14 Tonnies Holding ApS & Co. KG
- 5.4.15 WH Group Limited
6 KEY STRATEGIC QUESTIONS FOR MEAT INDUSTRY CEOS
7 APPENDIX
- 7.1 Global Overview
- 7.1.1 Overview
- 7.1.2 Porter's Five Forces Framework
- 7.1.3 Global Value Chain Analysis
- 7.1.4 Market Dynamics (DROs)
- 7.2 Sources & References
- 7.3 List of Tables & Figures
- 7.4 Primary Insights
- 7.5 Data Pack
- 7.6 Glossary of Terms

