
食用肉:市場シェア分析、産業動向・統計、成長予測(2025年~2030年)
Edible Meat - Market Share Analysis, Industry Trends & Statistics, Growth Forecasts (2025 - 2030)- 発行日
- ページ情報
- 英文 486 Pages
- 納期
- 2~3営業日
- 商品コード
- 1692566
- カスタマイズ可能 お客様のご希望に応じて、既存データの加工や未掲載情報(例:国別セグメント)の追加などの対応が可能です。詳細はお問い合わせください。
- 適宜更新あり 本レポートは最新情報反映のため適宜更新し、内容構成変更を行う場合があります。ご検討の際はお問い合わせください。
- 翻訳ツール提供対象 PDF対応AI翻訳ツールの無料貸し出しサービスのご利用が可能です
概要
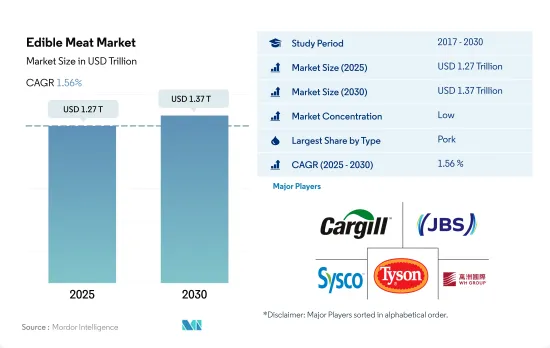
食用肉市場規模は2025年に1兆2,700億米ドルと推定され、2030年には1兆3,700億米ドルに達し、予測期間中(2025-2030年)のCAGRは1.56%で成長すると予測されます。
豚肉消費の増加が市場需要を牽引
- 世界の食用肉市場は、2022年に金額ベースで最も高い成長率を示した豚肉の消費が牽引しています。また、予測期間中のCAGRは金額ベースで2.13%を記録すると予測されています。豚肉の消費はアジア太平洋地域が大きくリードしており、2022年の市場シェアは金額ベースで68.31%でした。アジア諸国では豚肉は主食とされており、消費者は通常、冷凍や加工された豚肉ではなく、新鮮な豚肉を好みます。中国、日本、オーストラリアでは複数のケータリング事業が行われており、今後、生鮮豚肉の需要をさらに押し上げる可能性が高いです。
- 中国は世界最大の牛肉消費国に浮上し、2022年の市場シェアは金額ベースで19.35%に達します。2022年の中国市場の牛肉消費量は884万トンです。しかし、一人当たりの牛肉消費量が多いほとんどの国では、牛肉消費量が減少し、鶏肉の消費量が増加する可能性が高いです。
- また、家禽肉の消費量はレビュー期間中に世界的に大幅に増加し、2018年と比較して2022年には16.45%の成長を記録しました。栄養価が高く健康的な食品に対する世界の消費者の消費パターンの変化が鶏肉の消費を促進しています。北米は第2位の鶏肉消費地域であり、2022年の金額シェアは20%です。鶏肉は他の肉類に比べて手ごろな価格であるため、消費者、特に費用対効果の高い蛋白源を求める消費者にとって魅力的な選択肢となっています。
- 羊と羊肉の生産量は減少しており、それに伴って価格も上昇しています。2022年のマトンの価格は他のどの食肉よりも20%高かったです。供給不足と価格の高騰は羊と羊肉の消費を減少させ、その成長を妨げました。
食肉セクターへの投資の増加が市場成長を牽引
- 食用肉は2022年にアジア太平洋地域で主に消費されました。2019年から2022年までのCAGRは2.96%を記録しました。食用肉の消費の増加は、食肉商品とその原料を介してアジア諸国とより大きな世界をつなぐアジア食肉複合体をもたらしました。東南アジアで消費される食肉の多くは、主に工業化システムを通じて地元で生産されています。大企業がアジアの食用肉市場を形成する傾向が強まっています。
- アフリカは予測期間中、食用肉市場で最も急成長する地域と予想されます。2022年には3.89%の成長を記録しました。アフリカでは食用肉の消費が伸びており、投資機会も他の世界地域よりも魅力的であろう。今後の投資は、鶏肉や豚肉の飼育施設、食肉処理場、飼料生産、輸送、設備供給など、バリューチェーン全体にわたって必要となると思われます。KFC、Steers、Wimpy、Debonairsといった小売レストランチェーンの増加により、鶏肉製品の需要は急激に増加しました。
- 中東は食用肉市場で2番目に急成長している地域です。予測期間中は2.28%の成長が見込まれています。中東諸国では、食肉消費量の増加により食肉市場が厳しく拡大しています。2022年には、JBS SAが20億米ドルを投資してサウジアラビアとアラブ首長国連邦の2工場を買収し、主に牛肉や鶏肉などの冷凍食品に特化しています。2022年、Tyson Foodsはサウジアラビアを拠点とする食肉会社に投資し、Tanmiahの15%の株式とSupreme Foods Processing Companyの60%の株式を取得することで足跡を拡大する計画でした。
世界の食用肉市場の動向
各地域での生産が需要の伸びを後押ししそうだ
- 牛肉生産量は2017年から2022年にかけて6.90%増加。USDAの2022年4月の予測によると、2023年の世界の牛肉生産量はほぼ1%増の5,960万トンになると予想されています。アルゼンチンの干ばつにより牛群の離散が増え、生産量は前年比6%増加しました。同様に、肥育ストールの大型化と牛のと殺頭数の増加により、米国の生産量は2022年4月から1%増加すると予想されます。ニュージーランドの生産量は、雄の乳用子牛が肉用牛として販売されるようになったため、3%増加します。
- 投入コストが高いため、EUの生産量はと殺頭数の減少と体重の減少により1%減少します。ニュージーランド、オーストラリア、アルゼンチン、ブラジルの見通しが上方修正され、メキシコ、英国、EUの見通しの減少を相殺しました。中国の旺盛な需要がブラジルとアルゼンチンの供給を引きつけると予想されます。オーストラリアは、日本と韓国の需要増加の恩恵を受けそうです。さらに、米国の加工牛肉に対する旺盛な需要が、オーストラリアとニュージーランドからの供給を押し上げると思われます。
- 牛肉生産は北米が主流で、2022年には32.13%を生産しました。北米の牛肉生産は、干ばつによる生産コストの上昇と飼料費の増加によって大きな影響を受けました。干ばつは北米西部の産地にも悪影響を与えました。2022年1月1日、カナダの肉牛在庫は5年連続で1%減少し、350万頭に達しました。米国全体の肉牛在庫は前年比2%減の9,190万頭に達しました。南米も世界の牛肉生産に貢献しており、2022年には世界の牛肉生産のほぼ20.12%を生産します。世界の牛肉需要の増加により、生産と生産性の向上が進みました。
地域間の生産不安が価格に影響
- 牛肉の世界平均価格は2017年から2022年にかけて9.15%上昇し、米国が6.93米ドル/kgと最も高い価格を占めました。牛肉は世界中で旺盛な需要と高値に直面しており、国際市場力学が目に見えて変化しています。個々の国や地域における干ばつや消費者需要の増加といった地域的な混乱は、今や世界貿易により大きな影響を及ぼしています。
- 牛肉生産上位国の価格を左右する主な要因には、米国における需要主導型の牛肉価格高騰があります。米国の牛肉セクターは明らかに需要主導型市場にあり、2022年の価格は2017年比で40.75%上昇しました。ブラジルでは、季節的な雨の遅れにより牛の生産頭数が減少し、加工業者は特に中国市場の需要を考慮して牛の価格を引き上げ、供給を維持せざるを得なくなりました。市場はEU全域で家畜供給の減少に直面し、その結果、家畜部門の収益性が悪化しました。2023年6月の米国における様々な形態の牛肉の小売価格は、挽肉が5.028米ドル/ポンド、未調理の牛ロースが7.020米ドル/ポンド、牛ステーキが10.359米ドル/ポンドでした。
- 中国では、国内牛肉生産量の伸びが鈍化し、アフリカ豚熱の発生時に豚肉から牛肉への代替を促した国内消費量の伸びに追いつけなかったため、2021年と2022年には牛肉の輸入量が増加し、これが国内価格の上昇につながりました。豪州の供給は世界市場にも影響を与えました。連続する干ばつと大規模な牛群整理により、豪州の牛の頭数は過去30年間で最低となりました。2021年2月のオーストラリアの若齢牛の価格は、前年比で約20%上昇しました。
食用肉業界の概要
食用肉市場は細分化されており、上位5社で13.69%を占めています。この市場の主要企業は以下の通り。 Cargill Inc., JBS SA, Sysco Corporation, Tyson Foods Inc. and WH Group Limited(アルファベット順)。
その他の特典
- エクセル形式の市場予測(ME)シート
- 3ヶ月のアナリスト・サポート
目次
第1章 エグゼクティブサマリーと主な調査結果
第2章 イントロダクション
- 調査の前提条件と市場定義
- 調査範囲
- 調査手法
第3章 主要産業動向
- 価格動向
- 牛肉
- マトン
- 豚肉
- 家禽類
- 生産動向
- 牛肉
- 羊肉
- 豚肉
- 家禽類
- 規制の枠組み
- オーストラリア
- カナダ
- 中国
- フランス
- ドイツ
- インド
- イタリア
- 日本
- メキシコ
- サウジアラビア
- アラブ首長国連邦
- 英国
- 米国
- バリューチェーンと流通チャネル分析
第4章 市場セグメンテーション
- 種類
- 牛肉
- マトン
- 豚肉
- 家禽類
- その他の肉
- 形態
- 缶詰
- 生鮮・冷蔵
- 冷凍
- 加工
- 流通チャネル
- オフ・トレード
- コンビニエンスストア
- オンライン・チャネル
- スーパーマーケットとハイパーマーケット
- その他
- オン・トレード
- オフ・トレード
- 地域
- アフリカ
- タイプ別
- 形態別
- 流通チャネル別
- 国別
- エジプト
- ナイジェリア
- 南アフリカ
- その他のアフリカ
- アジア太平洋
- タイプ別
- 形態別
- 流通チャネル別
- 国別
- オーストラリア
- 中国
- インド
- インドネシア
- 日本
- マレーシア
- 韓国
- その他アジア太平洋地域
- 欧州
- タイプ別
- 形態別
- 流通チャネル別
- 国別
- フランス
- ドイツ
- イタリア
- オランダ
- ロシア
- スペイン
- 英国
- その他欧州
- 中東
- タイプ別
- 形態別
- 流通チャネル別
- 国別
- バーレーン
- クウェート
- オマーン
- カタール
- サウジアラビア
- アラブ首長国連邦
- その他中東
- 北米
- タイプ別
- 形態別
- 流通チャネル別
- 国別
- カナダ
- メキシコ
- 米国
- その他北米
- 南米
- タイプ別
- 形態別
- 流通チャネル別
- 国別
- アルゼンチン
- ブラジル
- その他南米地域
- アフリカ
第5章 競合情勢
- 主要な戦略動向
- 市場シェア分析
- 企業情勢
- 企業プロファイル
- BRF S.A.
- Cargill Inc.
- Hormel Foods Corporation
- Itoham Yonekyu Holdings, Inc.
- JBS SA
- Marfrig Global Foods S.A.
- Minerva SA
- NH Foods Ltd
- OSI Group
- Sysco Corporation
- The Kraft Heinz Company
- Tyson Foods Inc.
- Vion Group
- WH Group Limited
第6章 CEOへの主な戦略的質問
第7章 付録
- 世界概要
- 概要
- ファイブフォース分析フレームワーク
- 世界のバリューチェーン分析
- 市場力学(DROs)
- 情報源と参考文献
- 図表一覧
- 主要洞察
- データパック
- 用語集
目次
Product Code: 92388
The Edible Meat Market size is estimated at 1.27 trillion USD in 2025, and is expected to reach 1.37 trillion USD by 2030, growing at a CAGR of 1.56% during the forecast period (2025-2030).
Increased consumption of pork is driving the market demand
- The global edible meat market is driven by pork consumption, which had the highest growth rate by value in 2022. It is also anticipated that a CAGR of 2.13% will be registered during the forecast period on a value basis. The consumption of pork was largely led by the Asia-Pacific region, with a market share of 68.31% by value in 2022. Pork is considered a staple diet in Asian countries, and consumers usually prefer fresh pork instead of frozen and processed pork. Multiple catering businesses in China, Japan, and Australia are likely to further boost the demand for fresh pork in the future.
- China emerged as the world's largest consumer of beef, with a market share of 19.35% by value in 2022. In 2022, the Chinese market consumed 8.84 million tons of beef. However, most countries with high beef per capita consumption are likely to witness their level of beef consumption decline in favor of poultry meat.
- Also, the consumption of poultry increased drastically globally during the review period, registering a growth of 16.45% in 2022 compared to 2018. The changing consumption patterns of global consumers toward nutritious and healthy foods are driving poultry consumption. North America is the second-major poultry consumption region, with a share of 20% by value in 2022. The affordability of chicken compared to other meat types makes it an attractive option for consumers, especially those who are looking for cost-effective protein sources.
- The decrease in sheep and lamb production has been accompanied by higher prices, which are responsible for the greater production costs. Mutton was priced 20% higher than any other meat in 2022. Shortages in supply and high prices diminished the consumption of sheep and lamb and prevented their growth.
Increased investment in the meat sector drives market growth
- Edible meat was majorly consumed in the Asia-Pacific region in 2022. From 2019 to 2022, it registered a CAGR of 2.96%. The increased consumption of edible meat resulted in an Asian meat complex, which connects Asian countries and the larger world via meat commodities and their feedstocks. Much of the meat consumed in Southeast Asia is produced locally, primarily through industrialized systems. Large corporations increasingly shape the Asian edible meat market.
- Africa is anticipated to be the fastest-growing region in the edible meat market for the forecast period. It registered a growth of 3.89% in 2022. The consumption of edible meat is growing in Africa, and investment opportunities are likely to be more attractive than in other global regions. Future investments would be required along the entire value chain, including facilities for raising poultry and pork, abattoirs, feed production, transportation, and equipment supply. The demand for poultry products increased drastically due to the increasing number of retail restaurant chains, such as KFC, Steers, Wimpy, and Debonairs.
- The Middle East is the second fastest-growing region in the edible meat market. It is expected to register a growth of 2.28% during the forecast period. In Middle Eastern countries, the meat market is expanding rigorously due to rising meat consumption. In 2022, JBS SA invested USD 2 billion and bought two plants in Saudi Arabia and the United Arab Emirates, specializing mainly in frozen food, including beef and chicken. In 2022, Tyson Foods planned to expand its footprint by investing in a Saudi Arabia-based meat company, acquiring a 15% equity stake in Tanmiah and a 60% equity stake in Supreme Foods Processing Company.
Global Edible Meat Market Trends
Production across regions is likely to boost a growth in demand
- Beef production grew by 6.90% between 2017 and 2022. Global beef production for 2023 is anticipated to increase by nearly 1% to 59.6 million tons, according to USDA's April 2022 forecast. The drought in Argentina has led to more herd break-ups and increased production by 6% compared to the previous year. Similarly, larger fattening stalls and higher slaughter of cows are expected to boost US production by 1% from April 2022. New Zealand production will increase by 3% as male dairy calves are now marketed for beef.
- Due to the high input costs, EU production is cut by 1% due to lower slaughter numbers and lower weights. Upward revisions in forecasts for New Zealand, Australia, Argentina, and Brazil offset declines in forecasts for Mexico, the United Kingdom, and the European Union. Strong demand from China is expected to attract supplies from Brazil and Argentina. Australia is likely to benefit from increasing demand from Japan and South Korea. Additionally, strong US demand for processed beef will boost supplies from Australia and New Zealand.
- Beef production is dominated by North America, which produced 32.13% in 2022. Beef production in North America was highly impacted by the increased production costs and increased feed expenses due to dry conditions. The drought also negatively affected locations in western North America. On January 1, 2022, in Canada, beef cow inventories were down by 1% for the fifth consecutive year, reaching 3.5 million heads. The total US cattle inventories were down by 2% compared to last year, reaching 91.9 million heads. South America also caters to global beef production, producing almost 20.12% of global beef production in 2022. The increased beef demand worldwide increased production and productivity gains.
Production uncertainties across regions are impacting the prices
- The average global price of beef increased by 9.15% between 2017 and 2022, with the United States accounting for the highest price at USD 6.93/kg. Beef has faced strong demand and high prices worldwide, with a visible change in international market dynamics. Local disruptions, such as droughts and increasing consumer demand in individual countries or regions, now exert a greater impact on global trade.
- Key drivers influencing prices in top beef-producing countries include a demand-driven surge in beef prices in the United States. The US beef sector has clearly been in a demand-driven market, witnessing a 40.75% price increase in 2022 compared to 2017. In Brazil, a delay in seasonal rains leads to the production of fewer cattle, forcing processors to raise cattle prices and maintain supply, particularly given demand in the Chinese market. The market faced a reduction in livestock supply across the European Union, resulting in poor profitability of the sector. In June 2023, the retail prices of different forms of beef in the United States were USD 5.028/lb for ground beef, USD 7.020/lb for uncooked beef roasts, and USD 10.359/lb for beef steaks.
- In China, slow growth in domestic beef production, which failed to keep up with local consumption growth prompted by pork-to-beef substitution during the African swine fever outbreak, led to rising beef imports in 2021 and 2022, which, in turn, led to a rise in prices in the country. Australia's supply also impacted the world market, as consecutive years of drought and large herd liquidations resulted in the country's lowest cattle population in 30 years. Australian young stock prices were up by almost 20% in February 2021 compared to the previous year.
Edible Meat Industry Overview
The Edible Meat Market is fragmented, with the top five companies occupying 13.69%. The major players in this market are Cargill Inc., JBS SA, Sysco Corporation, Tyson Foods Inc. and WH Group Limited (sorted alphabetically).
Additional Benefits:
- The market estimate (ME) sheet in Excel format
- 3 months of analyst support
TABLE OF CONTENTS
1 EXECUTIVE SUMMARY & KEY FINDINGS
2 INTRODUCTION
- 2.1 Study Assumptions & Market Definition
- 2.2 Scope of the Study
- 2.3 Research Methodology
3 KEY INDUSTRY TRENDS
- 3.1 Price Trends
- 3.1.1 Beef
- 3.1.2 Mutton
- 3.1.3 Pork
- 3.1.4 Poultry
- 3.2 Production Trends
- 3.2.1 Beef
- 3.2.2 Mutton
- 3.2.3 Pork
- 3.2.4 Poultry
- 3.3 Regulatory Framework
- 3.3.1 Australia
- 3.3.2 Canada
- 3.3.3 China
- 3.3.4 France
- 3.3.5 Germany
- 3.3.6 India
- 3.3.7 Italy
- 3.3.8 Japan
- 3.3.9 Mexico
- 3.3.10 Saudi Arabia
- 3.3.11 United Arab Emirates
- 3.3.12 United Kingdom
- 3.3.13 United States
- 3.4 Value Chain & Distribution Channel Analysis
4 MARKET SEGMENTATION (includes market size in Value in USD, Forecasts up to 2030 and analysis of growth prospects)
- 4.1 Type
- 4.1.1 Beef
- 4.1.2 Mutton
- 4.1.3 Pork
- 4.1.4 Poultry
- 4.1.5 Other Meat
- 4.2 Form
- 4.2.1 Canned
- 4.2.2 Fresh / Chilled
- 4.2.3 Frozen
- 4.2.4 Processed
- 4.3 Distribution Channel
- 4.3.1 Off-Trade
- 4.3.1.1 Convenience Stores
- 4.3.1.2 Online Channel
- 4.3.1.3 Supermarkets and Hypermarkets
- 4.3.1.4 Others
- 4.3.2 On-Trade
- 4.3.1 Off-Trade
- 4.4 Region
- 4.4.1 Africa
- 4.4.1.1 By Type
- 4.4.1.2 By Form
- 4.4.1.3 By Distribution Channel
- 4.4.1.4 By Country
- 4.4.1.4.1 Egypt
- 4.4.1.4.2 Nigeria
- 4.4.1.4.3 South Africa
- 4.4.1.4.4 Rest of Africa
- 4.4.2 Asia-Pacific
- 4.4.2.1 By Type
- 4.4.2.2 By Form
- 4.4.2.3 By Distribution Channel
- 4.4.2.4 By Country
- 4.4.2.4.1 Australia
- 4.4.2.4.2 China
- 4.4.2.4.3 India
- 4.4.2.4.4 Indonesia
- 4.4.2.4.5 Japan
- 4.4.2.4.6 Malaysia
- 4.4.2.4.7 South Korea
- 4.4.2.4.8 Rest of Asia-Pacific
- 4.4.3 Europe
- 4.4.3.1 By Type
- 4.4.3.2 By Form
- 4.4.3.3 By Distribution Channel
- 4.4.3.4 By Country
- 4.4.3.4.1 France
- 4.4.3.4.2 Germany
- 4.4.3.4.3 Italy
- 4.4.3.4.4 Netherlands
- 4.4.3.4.5 Russia
- 4.4.3.4.6 Spain
- 4.4.3.4.7 United Kingdom
- 4.4.3.4.8 Rest of Europe
- 4.4.4 Middle East
- 4.4.4.1 By Type
- 4.4.4.2 By Form
- 4.4.4.3 By Distribution Channel
- 4.4.4.4 By Country
- 4.4.4.4.1 Bahrain
- 4.4.4.4.2 Kuwait
- 4.4.4.4.3 Oman
- 4.4.4.4.4 Qatar
- 4.4.4.4.5 Saudi Arabia
- 4.4.4.4.6 United Arab Emirates
- 4.4.4.4.7 Rest of Middle East
- 4.4.5 North America
- 4.4.5.1 By Type
- 4.4.5.2 By Form
- 4.4.5.3 By Distribution Channel
- 4.4.5.4 By Country
- 4.4.5.4.1 Canada
- 4.4.5.4.2 Mexico
- 4.4.5.4.3 United States
- 4.4.5.4.4 Rest of North America
- 4.4.6 South America
- 4.4.6.1 By Type
- 4.4.6.2 By Form
- 4.4.6.3 By Distribution Channel
- 4.4.6.4 By Country
- 4.4.6.4.1 Argentina
- 4.4.6.4.2 Brazil
- 4.4.6.4.3 Rest of South America
- 4.4.1 Africa
5 COMPETITIVE LANDSCAPE
- 5.1 Key Strategic Moves
- 5.2 Market Share Analysis
- 5.3 Company Landscape
- 5.4 Company Profiles (includes Global level Overview, Market level overview, Core Business Segments, Financials, Headcount, Key Information, Market Rank, Market Share, Products and Services, and analysis of Recent Developments)
- 5.4.1 BRF S.A.
- 5.4.2 Cargill Inc.
- 5.4.3 Hormel Foods Corporation
- 5.4.4 Itoham Yonekyu Holdings, Inc.
- 5.4.5 JBS SA
- 5.4.6 Marfrig Global Foods S.A.
- 5.4.7 Minerva SA
- 5.4.8 NH Foods Ltd
- 5.4.9 OSI Group
- 5.4.10 Sysco Corporation
- 5.4.11 The Kraft Heinz Company
- 5.4.12 Tyson Foods Inc.
- 5.4.13 Vion Group
- 5.4.14 WH Group Limited
6 KEY STRATEGIC QUESTIONS FOR MEAT INDUSTRY CEOS
7 APPENDIX
- 7.1 Global Overview
- 7.1.1 Overview
- 7.1.2 Porter's Five Forces Framework
- 7.1.3 Global Value Chain Analysis
- 7.1.4 Market Dynamics (DROs)
- 7.2 Sources & References
- 7.3 List of Tables & Figures
- 7.4 Primary Insights
- 7.5 Data Pack
- 7.6 Glossary of Terms
食用肉:市場シェア分析、産業動向・統計、成長予測(2025年~2030年)
- 発行日
- 発行
- Mordor Intelligence
- ページ情報
- 英文 486 Pages
- 納期
- 2~3営業日


