
米国の食用肉:市場シェア分析、産業動向、統計、成長予測(2025年~2030年)
United States Edible Meat - Market Share Analysis, Industry Trends & Statistics, Growth Forecasts (2025 - 2030)- 発行日
- ページ情報
- 英文 224 Pages
- 納期
- 2~3営業日
- 商品コード
- 1692041
- カスタマイズ可能 お客様のご希望に応じて、既存データの加工や未掲載情報(例:国別セグメント)の追加などの対応が可能です。詳細はお問い合わせください。
- 適宜更新あり 本レポートは最新情報反映のため適宜更新し、内容構成変更を行う場合があります。ご検討の際はお問い合わせください。
- 翻訳ツール提供対象 PDF対応AI翻訳ツールの無料貸し出しサービスのご利用が可能です
概要
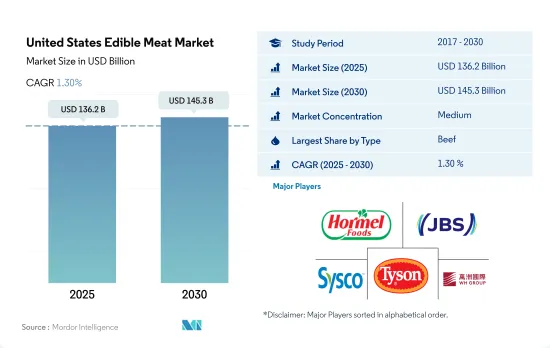
米国の食用肉市場規模は2025年に1,362億米ドルと推定され、2030年には1,453億米ドルに達すると予測され、予測期間(2025年~2030年)のCAGRは1.30%で成長します。
高い生産性と環境意識が鶏肉の需要を押し上げる
- 消費者が赤身肉よりも赤身の動物性蛋白源を好むため、鶏肉は国内で最も消費されている食肉です。消費率が高いのは、鶏肉が様々な味付け、調理法、レシピで汎用的に使用されるためで、様々な外食産業で使用されるようになっています。2021年現在、80億羽の鶏肉がアメリカ人によって消費されています。また、環境意識の高い消費者は、集約的な養鶏は牛肉よりも温室効果ガスの排出が少ないため、赤身肉から鶏肉に切り替えています。
- 牛肉は米国で2番目に消費量の多い食用肉です。2022年現在、1人当たりの年間牛肉消費量は中西部(73ポンド)が最も多く、南部と西部(各65ポンド)、北東部(63ポンド)がこれに続きます。農村部の消費者は、都市部や郊外の消費者(66ポンドと63ポンド)よりも多くの牛肉(75ポンド)を食べています。国内の各州では、ビーフバーガーやホットドッグのようなファストフードも大人気で、牛肉は最も消費され、好まれる肉の選択肢のひとつとなっています。2022年現在、米国では年間200億個のハンバーガー、1人当たり平均60枚のパテが消費されており、牛肉の用途拡大のチャンスが広がっています。
- 豚肉は、主にランチョン・ミート・ソーセージ、ホットドッグ、ハム、ベーコンなどの豚肉加工品の消費増加により、赤身市場で同国第3位となっています。このため、豚肉加工品は予測期間中に2.48%という最速のCAGRで推移すると予測されています。アジア料理、特に韓国料理やベトナム料理の影響力の高まりも、豚肉の一部のカットを新たな人気商品にしています。米国人は朝食にファーストフード・レストランを利用するようになっており、ベーコンとポーク・ソーセージが人気です。
米国の食用肉市場の動向
国内生産の増加とアジア諸国からの輸出増加が市場成長の原動力
- 米国の食肉生産者は技術主導型であり、飼料ベースの飼料を戦略的に補うことで、動物が必要とするタンパク質、ビタミン、ミネラルを満たすのに役立っています。米国は世界最大の牛肉生産国のひとつであり、2022年のシェアは30%近くに達します。2022年の牛肉生産量は1,289万トンで、2021年から15万トン増加しました。米国の牛肉生産上位の州は、オハイオ州、テキサス州、オクラホマ州、ミズーリ州です。オハイオ州は全米でもトップクラスの牛肉生産州で、2022年には約290万頭の牛がと殺されました。オハイオ州の牛肉生産量も2022年には2021年比で2%増加しました。
- 米国では主に高品質の穀物肥育牛肉が生産されています。牛肉農場と牧場は米国の農場の30%以上を占めています。米国の牛肉産業は、子牛の経営と牛の飼養という2つのセクターに分かれています。子牛の経営は、子牛を育てるために肉牛の群れを維持することが中心です。牛の飼養部門は、様々な生産手段のために牛を準備することに重点を置いています。肉牛は米国の全州で飼育されています。2023年1月現在、米国の肉牛頭数は約2,890万頭で、昨年より4%減少しています。
- 米国における牛肉生産は、アジアからの米国産牛肉に対する需要の高まりにより、今後数年間で増加すると予想されています。2021年、米国は過去5年間で初めて、食用肉をオーストラリアよりも中国に送り、日本や韓国といった重要な輸出市場でも現在リードしています。米国のアジア向け冷凍牛肉輸出は成長し、2017年から2022年にかけて金額ベースでCAGR 9.90%を記録しました。米国は、継続的なサプライチェーンの問題、輸送の問題、特に西海岸における国産品の潤沢な供給に苦慮しました。
飼料コストの上昇と牛の生産量減少が価格上昇につながる
- 牛肉価格は2017年から2022年にかけて40%の伸びを示しました。小売需要の増加が牛肉の卸売需要のニーズを押し上げました。と畜場が閉鎖されたため供給が減少し、全体的なと殺頭数が減少したため、牛肉価格の上昇につながりました。そのため、生鮮/チルドおよび冷凍牛肉への注目が高まりました。しかし、畜産農家は食肉価格が高いにもかかわらず、家畜の価格は低くなりました。2022年末の牛と子牛の頭数は約8,930万頭で、前年より3%減少しました。牛肉需要は比較的安定しており、肥育ロットへの去勢牛・未経産牛の供給は限られているため、牛肉価格はパッカー需要による下支えを受けると予想されます。
- 米国では、牛肉価格は2022年から2023年にかけて15%上昇し、2025年まで高止まりすると予測されました。この予測は、今夏、牛の取引の大部分に影響を及ぼし、多くの生産者がと殺のために牛群を早期に売却するよう促した深刻な干ばつの影響を受けており、2023年の牛群規模に影響を与えると思われます。2022年11月、米国48州の59.3%、米国の49.59%が干ばつに見舞われ、飼料コストを引き上げて飼料生産に影響を与えました。子牛生産者にとって飼料費は最大の経営コストであり、経営コストの75%を占める。
- 牛肉価格を安定させ、供給バランスを整えるためには、今後、当局の介入が必要になるかもしれないです。米国農務省が過去のように一定の規制要件を緩和すれば、企業は食肉工場での生産量を増やさなければならないです。例えば、2020年4月、米国農務省食品安全検査局は、需要の増加に伴い米国食肉供給を補うため、牛肉加工工場が加工速度を速めることを一時的に許可しました。
米国の食用肉産業の概要
米国の食用肉市場は適度に統合されており、上位5社で52.95%を占めています。この市場の主要企業は以下の通り。 Hormel Foods Corporation, JBS SA, Sysco Corporation, Tyson Foods Inc. and WH Group Limited(sorted alphabetically).
その他の特典
- エクセル形式の市場予測(ME)シート
- 3ヶ月のアナリストサポート
目次
第1章 エグゼクティブサマリーと主な調査結果
第2章 イントロダクション
- 調査の前提条件と市場定義
- 調査範囲
- 調査手法
第3章 主要産業動向
- 価格動向
- 牛肉
- マトン
- 豚肉
- 家禽類
- 生産動向
- 牛肉
- 羊肉
- 豚肉
- 家禽類
- 規制の枠組み
- 米国
- バリューチェーンと流通チャネル分析
第4章 市場セグメンテーション
- タイプ
- 牛肉
- マトン
- 豚肉
- 家禽類
- その他の肉
- 形態
- 缶詰
- 生鮮・冷蔵
- 冷凍
- 加工
- 流通チャネル
- オフ・トレード
- コンビニエンスストア
- オンライン・チャネル
- スーパーマーケットとハイパーマーケット
- その他
- オン・トレード
- オフ・トレード
第5章 競合情勢
- 主要な戦略動向
- 市場シェア分析
- 企業情勢
- 企業プロファイル
- BRF S.A.
- Cargill Inc.
- Conagra Brands Inc.
- Continental Grain Company
- Hormel Foods Corporation
- JBS SA
- OSI Group
- Perdue Farms Inc.
- Sysco Corporation
- Tyson Foods Inc.
- WH Group Limited
第6章 CEOへの主な戦略的質問
第7章 付録
- 世界概要
- 概要
- ファイブフォース分析フレームワーク
- 世界のバリューチェーン分析
- 市場力学(DROs)
- 情報源と参考文献
- 図表一覧
- 主要洞察
- データパック
- 用語集
目次
Product Code: 90333
The United States Edible Meat Market size is estimated at 136.2 billion USD in 2025, and is expected to reach 145.3 billion USD by 2030, growing at a CAGR of 1.30% during the forecast period (2025-2030).
High production and environmental consciousness are boosting demand for poultry meat
- Poultry is the most consumed meat variant in the country, owing to consumers' inclination toward a leaner animal protein source over red meat variants. The huge consumption rate is due to the versatile usage of poultry meat in various flavors, cooking methods, and recipes, increasing its usage in various food service stations. As of 2021, 8 billion chickens were consumed by Americans. Also, environment-conscious consumers are switching from red meat to poultry options, as intensive chicken farming causes lesser GHG emissions than cattle meat.
- Beef is the country's second most consumed edible meat variety in the United States. As of 2022, annual beef consumption per person was highest in the Midwest (73 pounds), followed by the South and West (65 pounds each) and the Northeast (63 pounds). Rural consumers ate more beef (75 pounds) than did urban and suburban consumers (66 and 63 pounds). Fast food options like beef burgers and hotdogs in the states of the country are also very popular, making beef one of the most consumed and favored meat options. As of 2022, 20 billion burgers with an average of 60 patties per person annually were consumed in the United States, opening opportunities to expand the application of beef.
- Pork is the third-largest type of red market in the country primarily due to the increased consumption of processed pork, such as luncheon meat sausage, hot dogs, ham, and bacon. Thus, processed pork is projected to record the fastest CAGR, amounting to 2.48%, over the forecast period. The growing influence of Asian cuisines, particularly Korean and Vietnamese, has also made some cuts of pork newly popular. Americans are increasingly turning to fast-food restaurants for breakfast, where bacon and pork sausage are both popular.
United States Edible Meat Market Trends
Increased domestic production and rising exports from asian countries is driving the market growth
- Meat producers in the United States are technology-driven, which helps in strategically supplementing forage-based diets to fulfill animal requirements for protein, vitamins, or minerals. The US is one of the largest beef producers in the entire world, with a share of nearly 30% in 2022. The country produced 12.89 million metric tons of beef in 2022, up 0.15 million metric tons from 2021. The top beef-producing states in the US are Ohio, Texas, Oklahoma, and Missouri. Ohio is ranked among the top beef-producing states throughout the nation and had around 2.9 million cattle slaughtered in 2022. Ohio's beef production also increased by 2% in 2022 compared to 2021.
- The US primarily produces high-quality, grain-fed beef. Beef farms and ranches represent over 30% of US farms. The US beef industry is divided into two sectors, namely cow-calf operations and cattle feeding. The focus of the cow-calf operation is to maintain a herd of beef cattle to raise calves. The cattle feeding sector focuses on preparing cattle for various means of production. Beef cattle are raised in all the states of the United States. As of January 2023, there were around 28.9 million beef cattle in the United States, down 4% from last year.
- Beef production in the US is anticipated to grow in the coming years due to the growing demand for American beef from Asia. In 2021, for the first time in the last five years, the United States sent more edible meat to China than Australia, and it currently leads in important export markets like Japan and South Korea. The US frozen beef exports to Asia grew, registering a CAGR of 9.90% by value from 2017 to 2022. The US struggled with ongoing supply chain issues, transportation problems, and ample supplies of domestic products, especially on its West Coast.
Rise in feed cost and lower production of cattle lead to a rise in prices
- The price of beef witnessed a 40% growth from 2017 to 2022. Rising retail demand boosted the need for the wholesale demand for beef. The supply fell as slaughterhouses were shut, and overall slaughter declined, leading to higher beef prices. Therefore, there was a higher focus on fresh/chilled and frozen beef. However, livestock producers earned low prices for their animals despite the high price of meat. The number of cattle and calves at the end of 2022 was around 89.3 million, which was a decline of 3% from the previous year. Cattle prices are expected to receive support from packer demand due to the relatively stable demand for beef and limited supplies of steers and heifers in feedlots.
- In the United States, beef prices were predicted to rise by 15% from 2022 to 2023 and stay high until 2025. This projection is influenced by a severe drought that affected most of the cattle trade this summer and prompted many producers to sell their herds early for slaughter, which will impact the herd size for 2023. In November 2022, 59.3% of the lower 48 states and 49.59% of the US were in a drought, impacting feed production by raising the cost of feed. Feed expenses are the largest operating cost for cow-calf producers, comprising 75% of the operational costs.
- Intervention from authorities may be required in the future to stabilize beef prices and create a supply balance. Companies must increase their production in meat plants to higher volumes, provided the USDA relaxes certain regulatory requirements as it has done in the past. For instance, in April 2020, the USDA's Food Safety Inspection Service temporarily permitted beef processing plants to accelerate processing speeds to supplement the US meat supply as demand increased.
United States Edible Meat Industry Overview
The United States Edible Meat Market is moderately consolidated, with the top five companies occupying 52.95%. The major players in this market are Hormel Foods Corporation, JBS SA, Sysco Corporation, Tyson Foods Inc. and WH Group Limited (sorted alphabetically).
Additional Benefits:
- The market estimate (ME) sheet in Excel format
- 3 months of analyst support
TABLE OF CONTENTS
1 EXECUTIVE SUMMARY & KEY FINDINGS
2 INTRODUCTION
- 2.1 Study Assumptions & Market Definition
- 2.2 Scope of the Study
- 2.3 Research Methodology
3 KEY INDUSTRY TRENDS
- 3.1 Price Trends
- 3.1.1 Beef
- 3.1.2 Mutton
- 3.1.3 Pork
- 3.1.4 Poultry
- 3.2 Production Trends
- 3.2.1 Beef
- 3.2.2 Mutton
- 3.2.3 Pork
- 3.2.4 Poultry
- 3.3 Regulatory Framework
- 3.3.1 United States
- 3.4 Value Chain & Distribution Channel Analysis
4 MARKET SEGMENTATION (includes market size in Value in USD, Forecasts up to 2030 and analysis of growth prospects)
- 4.1 Type
- 4.1.1 Beef
- 4.1.2 Mutton
- 4.1.3 Pork
- 4.1.4 Poultry
- 4.1.5 Other Meat
- 4.2 Form
- 4.2.1 Canned
- 4.2.2 Fresh / Chilled
- 4.2.3 Frozen
- 4.2.4 Processed
- 4.3 Distribution Channel
- 4.3.1 Off-Trade
- 4.3.1.1 Convenience Stores
- 4.3.1.2 Online Channel
- 4.3.1.3 Supermarkets and Hypermarkets
- 4.3.1.4 Others
- 4.3.2 On-Trade
- 4.3.1 Off-Trade
5 COMPETITIVE LANDSCAPE
- 5.1 Key Strategic Moves
- 5.2 Market Share Analysis
- 5.3 Company Landscape
- 5.4 Company Profiles (includes Global level Overview, Market level overview, Core Business Segments, Financials, Headcount, Key Information, Market Rank, Market Share, Products and Services, and analysis of Recent Developments)
- 5.4.1 BRF S.A.
- 5.4.2 Cargill Inc.
- 5.4.3 Conagra Brands Inc.
- 5.4.4 Continental Grain Company
- 5.4.5 Hormel Foods Corporation
- 5.4.6 JBS SA
- 5.4.7 OSI Group
- 5.4.8 Perdue Farms Inc.
- 5.4.9 Sysco Corporation
- 5.4.10 Tyson Foods Inc.
- 5.4.11 WH Group Limited
6 KEY STRATEGIC QUESTIONS FOR MEAT INDUSTRY CEOS
7 APPENDIX
- 7.1 Global Overview
- 7.1.1 Overview
- 7.1.2 Porter's Five Forces Framework
- 7.1.3 Global Value Chain Analysis
- 7.1.4 Market Dynamics (DROs)
- 7.2 Sources & References
- 7.3 List of Tables & Figures
- 7.4 Primary Insights
- 7.5 Data Pack
- 7.6 Glossary of Terms
米国の食用肉:市場シェア分析、産業動向、統計、成長予測(2025年~2030年)
- 発行日
- 発行
- Mordor Intelligence
- ページ情報
- 英文 224 Pages
- 納期
- 2~3営業日


