
インドの食用肉:市場シェア分析、産業動向・統計、成長予測(2025年~2030年)
India Edible Meat - Market Share Analysis, Industry Trends & Statistics, Growth Forecasts (2025 - 2030)- 発行日
- ページ情報
- 英文 207 Pages
- 納期
- 2~3営業日
- 商品コード
- 1692042
- カスタマイズ可能 お客様のご希望に応じて、既存データの加工や未掲載情報(例:国別セグメント)の追加などの対応が可能です。詳細はお問い合わせください。
- 適宜更新あり 本レポートは最新情報反映のため適宜更新し、内容構成変更を行う場合があります。ご検討の際はお問い合わせください。
- 翻訳ツール提供対象 PDF対応AI翻訳ツールの無料貸し出しサービスのご利用が可能です
概要
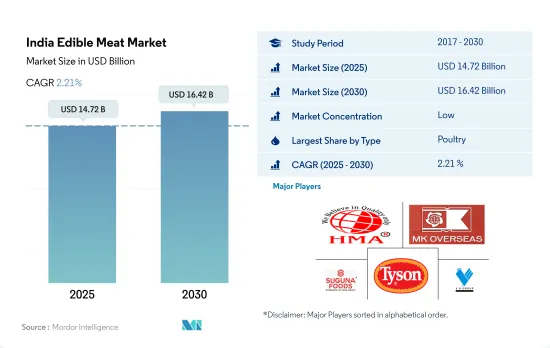
インドの食用肉の市場規模は2025年に147億2,000万米ドルと推定され、2030年には164億2,000万米ドルに達すると予測され、予測期間中(2025-2030年)のCAGRは2.21%で成長する見込みです。
政府のイニシアティブに支えられた生産拡大が市場を押し上げる
- インドの食用肉市場は、2017~2022年の間に金額ベースで19.70%成長したが、これは主に力強い所得と経済成長、都市人口の増加、中間層の急速な増加、ライフスタイルの変化、物流施設の改善、地方都市における近代的小売の台頭によるものです。同国はベジタリアンの消費者層が非常に多く、2022年には総人口の約20%を占める。しかし、タンパク質摂取に対する意識の高まりにより、予測期間中に市場は成長すると予想されます。
- 家禽肉はインドで消費される主要かつ急成長している食肉タイプであり、2017~2022年の間に金額ベースで26.77%成長しました。家禽肉の消費は、その汎用性、他の食肉よりも比較的安価であること、あらゆる宗教で家禽肉が受け入れられていること、高タンパク質/低脂肪組成であることなどにより増加しています。鶏肉は反芻動物よりも生産サイクルが短いため、市場のシグナルにより迅速に対応できます。インドで生産されるヒツジ、ヤギ、ブタ、家禽の肉の大部分は、主に生肉として国内消費に供されます。
- 牛肉は鶏肉に次いで市場で急成長している肉類であり、予測期間中のCAGRは金額ベースで1.89%と予想されます。インドにおける牛肉の消費は、牛肉をめぐる価値観の衝突によって影響を受けています。これは、ヒンドゥー教における牛の神聖さと、動物愛護団体による倫理的懸念に起因しています。インド政府は、安全で衛生的な食肉を消費者に提供するため、自治体の食肉処理場を近代化する措置を講じています。安全で衛生的な製品への需要の高まりに伴い、市場では農場の自動化、と畜場、ロジスティクス、POS低温貯蔵インフラへの投資が増加しています。
インドの食用肉市場動向
国内消費と輸出需要により生産が拡大
- 2022年、インドの牛肉生産量は2021年から3.69%増加しました。生産量の増加は、インドの輸出市場におけるカラビーフの需要増によるものです。カラビーフの輸出は、マレーシアと中東の需要増に牽引され、2023年には1.48MMTに拡大する見込みです。2023年のインドのカラビーフと牛肉の消費予測は、水牛の牛肉が依然として鶏肉に次いで同国で最も費用対効果の高い動物性蛋白源であることから、増加が見込まれます。しかし、牛肉の消費に関する宗教的タブーが成長の足かせとなっています。
- インドの生きたウシの頭数は世界で最も多く、絶対数ではブラジルと中国がこれに続きます。国内のウシの群れは、ウシ乳牛とアジアの家畜水牛で構成されています。ウシの総頭数は、2022年の3億670万頭に対し、2023年には3億750万頭に達すると予想されています。動物の繁殖能力の向上により、子牛の頭数は徐々に増加していくと思われます。
- 2022年、インドでは各地で牛の塊状皮膚病(LSD)が発生しました。発生による全体的な影響はそれほど大きくなく、現在ではほぼ終息しています。インド農業研究・インド獣医研究所(ICAR-IVRI)が独自に開発した新しい同種ワクチンは、今後数年間、ウイルスの蔓延を抑えるのに役立つと期待されています。政府は、農業・農民福祉省の畜産・酪農局(DAHD)に対し、2023/24会計年度予算で多額の予算を計上し、地域の畜産を支援しています。
緩やかな需要の伸びと政府の取り組みが相まって、牛肉価格は安定しています。
- 2022年、インドの牛肉価格は3.06米ドル/kgに達しました。価格は2017年から2022年の間に8.52%徐々に上昇しました。インドの2022年のカラビーフと牛肉の消費量は290万トンで、2021年の推定値である約280万トンから5%近く増加しました。カラビーフの消費者需要は旺盛で、その主な要因は手頃な価格設定にあります。
- 2022年(1月~6月)の水牛肉(カラビーフ)と牛肉の卸売物価指数(WPI)は6%上昇したが、これは他の食肉に比べて緩やかな上昇であり、このためこれらの赤身肉は消費者にとって比較的手頃で入手しやすいものとなっています。2023年第1四半期、インド産牛肉のおおよその卸売価格帯は1.07~2.63米ドル/kgでした。過去5年間、インドへの牛肉キログラム当たりの輸入価格は比較的安定しています。2017年には2.99米ドル/kgであったが、2022年には2.86米ドル/kgまで低下しました。この動向に基づき、2023年のインドへの牛肉1kg当たりの輸入価格は2.84米ドル/kg程度になると予測されます。
- 食肉生産量の約50%は、未登録のにわか屠畜場で生産されています。畜産物の販売・取引コストは高く、販売価格から15%から20%引かれています。政府の18億米ドルのAtma Nirbha Bharat Abhiyan刺激策では、畜産インフラ開発基金(AHIDF)の設立が発表され、その主な目的は、ミルクと食肉の加工能力と製品の種類を増やし、農家の価格実現を高めることです。2022年の物価も、食品価格、飼料価格、商品価格、燃料価格の上昇、ロシア・ウクライナ戦争によるサプライチェーンの混乱により上昇し、2022年3月のインドの食品インフレ水準は前年同月比7.7%上昇しました。
インドの食用肉産業の概要
インドの食用肉市場は断片化されており、上位5社で5.97%を占めています。この市場の主要企業は以下の通りです。 HMA Agro Industries Limited, M. K. Overseas Private Limited, Suguna Foods Private Limited, Tyson Foods Inc. and VH Group(sorted alphabetically).
その他の特典
- エクセル形式の市場予測(ME)シート
- 3ヶ月のアナリストサポート
目次
第1章 エグゼクティブサマリーと主な調査結果
第2章 イントロダクション
- 調査の前提条件と市場定義
- 調査範囲
- 調査手法
第3章 主要産業動向
- 価格動向
- 牛肉
- 羊肉
- 豚肉
- 家禽類
- 生産動向
- 牛肉
- 羊肉
- 豚肉
- 家禽類
- 規制の枠組み
- インド
- バリューチェーンと流通チャネル分析
第4章 市場セグメンテーション
- タイプ
- 牛肉
- 羊肉
- 豚肉
- 家禽類
- その他の肉
- 形態
- 缶詰
- 生鮮・冷蔵
- 冷凍
- 加工
- 流通チャネル
- オフトレード
- コンビニエンスストア
- オンライン・チャネル
- スーパーマーケットとハイパーマーケット
- その他
- オントレード
- オフトレード
第5章 競合情勢
- 主要な戦略動向
- 市場シェア分析
- 企業情勢
- 企業プロファイル
- Al Aali Exports Pvt. Ltd
- Al-Hamd Agro Food Products Pvt. Ltd
- Allanasons Private Limited
- Farm Suzanne Pvt. Ltd
- HMA Agro Industries Limited
- M. K. Overseas Private Limited
- Mark International Food Stuff Pvt. Ltd
- Mirha Exports Pvt. Ltd
- Suguna Foods Private Limited
- Tyson Foods Inc.
- VH Group
第6章 CEOへの主な戦略的質問
第7章 付録
- 世界概要
- 概要
- ファイブフォース分析フレームワーク
- 世界のバリューチェーン分析
- 市場力学(DROs)
- 情報源と参考文献
- 図表一覧
- 主要洞察
- データパック
- 用語集
目次
The India Edible Meat Market size is estimated at 14.72 billion USD in 2025, and is expected to reach 16.42 billion USD by 2030, growing at a CAGR of 2.21% during the forecast period (2025-2030).
Growing production, supported by government initiatives, is boosting the market
- The Indian edible meat market grew by 19.70%, by value, during 2017-2022, primarily driven by strong income and economic growth, rising urban population, rapidly growing middle class, changing lifestyles, improvement in logistics facilities, and the rise of modern retail in rural towns. The country has a very large vegetarian consumer base, accounting for around 20% of the total population in 2022. However, with the rising awareness of protein intake, the market is expected to grow during the forecast period.
- Poultry meat is the major and fastest-growing meat type consumed in India, which grew by 26.77%, by value, during 2017-2022. Consumption of poultry meat is increasing due to its versatility, relatively lower cost than other meat, the acceptance of chicken meat by all religions, and higher protein/lower fat composition. Poultry can respond more quickly to market signals due to shorter production cycles than ruminants. A major portion of meat from sheep, goats, pigs, and poultry produced in India is primarily used for domestic consumption in the form of fresh meat.
- Beef is the second fastest-growing meat type in the market after poultry, and it is expected to register a CAGR of 1.89%, by value, during the forecast period. The consumption of beef in India is impacted by the clash of values surrounding beef, which can be attributed to the sacredness of cows in Hinduism and the ethical concerns raised by animal rights organizations. The Government of India has taken steps to modernize municipal slaughterhouses to provide safe and hygienic meat to consumers. With the growing demand for safe and hygienic products, the market has seen increasing investments in farm automation, slaughterhouses, logistics, and point-of-sale cold storage infrastructures.
India Edible Meat Market Trends
Production is propelling due to domestic consumption and export demand
- In 2022, beef production in India grew by 3.69% from 2021. The increase in production is attributed to the rising demand for carabeef from India's export markets. The carabeef export is expected to grow to 1.48 MMT in 2023, driven by increased demand in Malaysia and the Middle East. India's carabeef and beef consumption projections for 2023 are expected to increase as water-bovine beef remains the country's most cost-effective animal protein source after poultry. However, religious taboos related to the consumption of cattle meat are a restraint to the growth.
- India has the highest number of live bovine animals worldwide, followed by Brazil and China in absolute terms. The national bovine herd is made up of bovine dairies and Asian domestic water buffaloes. The total bovine population is expected to reach 307.5 million in 2023, compared with 306.7 million bovine heads in 2022. With the improvement in the reproductive health of animals, calf crop numbers will gradually march upward.
- In 2022, India experienced an outbreak of lumpy skin disease (LSD) in cattle in various parts of the country. The overall observed impact of the outbreak was not severe, and the disease has now been largely contained. A new homologous vaccine, developed indigenously by the Indian Council for Agricultural Research-Indian Veterinary Research Institute (ICAR-IVRI), is expected to help control the spread of the virus in the coming years. The government is supporting the local livestock by providing a substantial allocation in the Fiscal Year Budget 2023/24 for the Ministry Of Agriculture and Farmers' Welfare's Department of Animal Husbandry and Dairying (DAHD).
Modest demand growth, coupled with government initiatives, is stabilizing the prices of beef
- In 2022, beef prices in India reached USD 3.06/kg. The prices gradually increased by 8.52% between 2017 and 2022. India's 2022 carabeef and beef consumption was 2.9 MMT, representing a nearly 5% increase from 2021's estimate of roughly 2.8 million metric tons. Carabeef has strong consumer demand, primarily driven by its affordable pricing.
- The wholesale price index (WPI) for buffalo meat (carabeef) and beef in 2022 (January-June) rose 6%, a modest increase compared to other meats, which makes these red meats relatively more affordable and accessible to consumers. During the first quarter of 2023, the approximate wholesale price range for Indian beef was between USD 1.07 and USD 2.63/ kilogram. Over the last five years, the import price per kilogram of beef into India has been relatively stable. In 2017, the price was USD 2.99/kg, which decreased to USD 2.86/kg in 2022. Based on this trend, the import price per kilogram of beef into India in 2023 was predicted to be around USD 2.84/kg.
- About 50% of total meat production is generated in unregistered, makeshift abattoirs. Marketing and transaction costs of livestock products are high, taking 15% to 20% from the sale price. The government's USD 1.80 billion Atma Nirbha Bharat Abhiyan stimulus package announced the creation of an Animal Husbandry Infrastructure Development Fund (AHIDF), the primary objective of which is to increase milk and meat processing capacity and product variety, increasing farmers' price realization. Prices in 2022 were also increasing due to a rise in food prices, feed prices, commodity prices, fuel prices, and supply chain disruptions due to the Russia-Ukraine war, which increased India's food inflation level by 7.7% Y-o-Y in March 2022.
India Edible Meat Industry Overview
The India Edible Meat Market is fragmented, with the top five companies occupying 5.97%. The major players in this market are HMA Agro Industries Limited, M. K. Overseas Private Limited, Suguna Foods Private Limited, Tyson Foods Inc. and VH Group (sorted alphabetically).
Additional Benefits:
- The market estimate (ME) sheet in Excel format
- 3 months of analyst support
TABLE OF CONTENTS
1 EXECUTIVE SUMMARY & KEY FINDINGS
2 INTRODUCTION
- 2.1 Study Assumptions & Market Definition
- 2.2 Scope of the Study
- 2.3 Research Methodology
3 KEY INDUSTRY TRENDS
- 3.1 Price Trends
- 3.1.1 Beef
- 3.1.2 Mutton
- 3.1.3 Pork
- 3.1.4 Poultry
- 3.2 Production Trends
- 3.2.1 Beef
- 3.2.2 Mutton
- 3.2.3 Pork
- 3.2.4 Poultry
- 3.3 Regulatory Framework
- 3.3.1 India
- 3.4 Value Chain & Distribution Channel Analysis
4 MARKET SEGMENTATION (includes market size in Value in USD, Forecasts up to 2030 and analysis of growth prospects)
- 4.1 Type
- 4.1.1 Beef
- 4.1.2 Mutton
- 4.1.3 Pork
- 4.1.4 Poultry
- 4.1.5 Other Meat
- 4.2 Form
- 4.2.1 Canned
- 4.2.2 Fresh / Chilled
- 4.2.3 Frozen
- 4.2.4 Processed
- 4.3 Distribution Channel
- 4.3.1 Off-Trade
- 4.3.1.1 Convenience Stores
- 4.3.1.2 Online Channel
- 4.3.1.3 Supermarkets and Hypermarkets
- 4.3.1.4 Others
- 4.3.2 On-Trade
- 4.3.1 Off-Trade
5 COMPETITIVE LANDSCAPE
- 5.1 Key Strategic Moves
- 5.2 Market Share Analysis
- 5.3 Company Landscape
- 5.4 Company Profiles (includes Global level Overview, Market level overview, Core Business Segments, Financials, Headcount, Key Information, Market Rank, Market Share, Products and Services, and analysis of Recent Developments)
- 5.4.1 Al Aali Exports Pvt. Ltd
- 5.4.2 Al-Hamd Agro Food Products Pvt. Ltd
- 5.4.3 Allanasons Private Limited
- 5.4.4 Farm Suzanne Pvt. Ltd
- 5.4.5 HMA Agro Industries Limited
- 5.4.6 M. K. Overseas Private Limited
- 5.4.7 Mark International Food Stuff Pvt. Ltd
- 5.4.8 Mirha Exports Pvt. Ltd
- 5.4.9 Suguna Foods Private Limited
- 5.4.10 Tyson Foods Inc.
- 5.4.11 VH Group
6 KEY STRATEGIC QUESTIONS FOR MEAT INDUSTRY CEOS
7 APPENDIX
- 7.1 Global Overview
- 7.1.1 Overview
- 7.1.2 Porter's Five Forces Framework
- 7.1.3 Global Value Chain Analysis
- 7.1.4 Market Dynamics (DROs)
- 7.2 Sources & References
- 7.3 List of Tables & Figures
- 7.4 Primary Insights
- 7.5 Data Pack
- 7.6 Glossary of Terms
- 発行日
- 発行
- Mordor Intelligence
- ページ情報
- 英文 207 Pages
- 納期
- 2~3営業日


