
米国の米タンパク:市場シェア分析、産業動向、統計、成長予測(2025年~2030年)
United States Rice Protein - Market Share Analysis, Industry Trends & Statistics, Growth Forecasts (2025 - 2030)- 発行日
- ページ情報
- 英文 168 Pages
- 納期
- 2~3営業日
- 商品コード
- 1690972
- カスタマイズ可能 お客様のご希望に応じて、既存データの加工や未掲載情報(例:国別セグメント)の追加などの対応が可能です。詳細はお問い合わせください。
- 適宜更新あり 本レポートは最新情報反映のため適宜更新し、内容構成変更を行う場合があります。ご検討の際はお問い合わせください。
- 翻訳ツール提供対象 PDF対応AI翻訳ツールの無料貸し出しサービスのご利用が可能です
概要
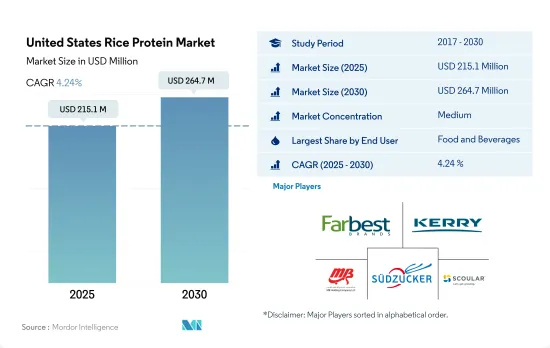
米国の米タンパク市場規模は2025年に2億1,510万米ドルと推定され、2030年には2億6,470万米ドルに達すると予測され、予測期間(2025~2030年)のCAGRは4.24%で成長します。
国内における乳糖不耐症人口の増加とタンパク質消費ニーズの増加が米タンパク質の使用を促進しています。
- 米タンパク質は、飲食品セグメントで最大の需要を示し、主に肉/鶏肉/水産物と肉代替製品が牽引しています。2022年には、このサブセグメントは、国内で消費される米タンパク質の83%以上を主張しました。米タンパク質は、ヴィーガン、グルテンフリー、高タンパク食品など複数の消費者の需要を満たします。米タンパク質は、チキンナゲットの開発のために、異なる濃度レベル(3%、6%、9%、12%)で肉の増量剤として使用されました。ベーカリー用品とベーカリーミックスのセグメントは、プロテイン動向の結果として極めて高い需要を持つ可能性があり、この傾向はさらに強まると予想されます。ヴィーガンベーカリー製品に対する需要の高まりに対応するため、食品製造業者は米タンパク質を使用してタンパク質の豊富なベーカリー製品を製造しています。
- この食材は低アレルギー性で、乳糖不耐症の人々にとって栄養価の高い代替品であることから人気を集めています。国内には乳糖不耐症の人が約3,000万人おり、米タンパクを含む代替タンパクへの高い需要につながっています。特に米をベースとしたフォーミュラは、牛乳アレルギーの幼児にとって豆乳よりも良い代替品として使用されています。
- 成長という点では、パーソナルケアと化粧品セグメントが主要カテゴリーを凌ぐ成長を見せ、予測期間中の予想CAGRは金額ベースで6.18%です。この成長は、美容製品における合成成分に対する需要の高まりに起因しています。消費者は米プロテインのような植物由来の代替品をますます受け入れるようになっており、市場の拡大に繋がっています。
米国の米プロテイン市場動向
植物性タンパク質消費量の成長が原料市場の主要企業に機会を提供
- 米国では、投資と技術革新に支えられて、植物性タンパク質の一人当たり消費量がかなりの割合で増加しており、その結果、消費量は1日当たり40.28グラムに達しています。米国では、動物が虐待される工場畜産が常態化しているからです。多くのアメリカ人は肉や動物性食品の摂取量を減らしているが、完全に排除しているわけではないです。また、ヴィーガンやベジタリアンよりもフレキシタリアンである傾向が強いです。米国では12%近くの消費者が植物性の食事を好み、7%の消費者がフレキシタリアンです。米国ではあらゆる世代の消費者が植物ベースの食事に関心を持っているが、20代と30代が最も植物ベースの食事に熱心です。
- 肉、鶏肉、ベーカリー製品など、さまざまな食品に幅広く利用されているため、一人当たりの豆タンパク消費量は常に増加しています。約41%の消費者がエンドウタンパク由来の植物性食品に関心を持っています。エンドウ豆プロテインは主にスポーツ栄養や肉の代替食品に使用されています。エンドウ豆プロテイン粉末の典型的な1食分は30グラムで、25グラムのタンパク質が含まれています。アスリートは通常1日1食を使用するが、1日3食摂取することもあります。
- 大豆プロテインと乳清プロテインは、主に飲食品、サプリメント、スポーツ栄養産業で使用されています。2021年には、約36%の消費者が大豆タンパク質を知っており、摂取したことがあるのに対し、米国では31%の人がホエイプロテインを摂取していました。同様に、大豆ベースの飲食品消費量は2014~2019年にかけて12.9%増加し、予測期間中も一貫して増加し続ける可能性が高いです。
米生産量の増加が米タンパク質加工業者を支える
- 機能性食品、特に栄養補助食品は、メーカーが植物性タンパク質ベースの製品のブレンドアプローチを受け入れていることから、米タンパク質の最大の用途セグメントの1つとして浮上しています。アーカンソー・グランドプレーリー、ミシシッピ・デルタ、ガルフコースト、カリフォルニアのサクラメントバレーは、米国産米のほぼ全量を生産する4つの地域です。これらの産地はそれぞれ、米国では長粒種、中粒種、短粒種と呼ばれる特定タイプの米に特化しています。一般的に、長粒種は米国産米の約75%を占め、中粒種は約24%、短粒種は残りの約1%です。
- 2021年の米国の粗米生産量は1億9,160万トンで、2020年産より16%減少したが、2019年産をわずかに上回りました。2022年産も前年比16%減の1億6,040万トンで、カリフォルニアの干ばつが2021年と2022年の米国産米生産減少の主要因となっています。
- 米国の長粒種米の生産は南部に集中している(例えば、アーカンソー州は通常米国長粒種米の56~58%を生産している)。カリフォルニア州は中粒種米の主要生産地で、通常70~77%を生産しているが、アーカンソー州は特にカリフォルニア州が干ばつに見舞われた年に相当量の中粒種米を生産しています。
- 米国は長粒種と中・短粒種を合わせた世界市場において、一貫して高品質米をタイムリーに供給しています。米国は世界の米生産量の2%にも満たないが、世界輸出のほぼ5%を出荷しており、2023年時点で第5位の輸出国です。
米国の米プロテイン産業概要
米国の米タンパク市場は適度に統合されており、上位5社で58.38%を占めています。この市場の主要企業は、Farbest-Tallman Foods Corporation、Kerry Group PLC、MB-Holding GmbH & Co. KG、Sudzucker Group、The Scoular Companyなどです。
その他の特典
- エクセル形式の市場予測(ME)シート
- 3ヶ月のアナリストサポート
目次
第1章 エグゼクティブサマリーと主要調査結果
第2章 イントロダクション
- 調査の前提条件と市場定義
- 調査範囲
- 調査手法
第3章 主要産業動向
- エンドユーザー市場規模
- ベビーフードと乳児用調製粉乳
- ベーカリー
- 飲料
- 朝食用シリアル
- 調味料/ソース
- 菓子類
- 乳製品と乳製品代替製品
- 高齢者栄養・医療栄養
- 肉・鶏肉・魚介類と肉代替製品
- RTE/RTC食品
- スナック
- スポーツ/パフォーマンス栄養
- 動物飼料
- パーソナルケアと化粧品
- タンパク質消費動向
- 植物
- 生産動向
- 植物
- 規制の枠組み
- 米国
- バリューチェーンと流通チャネル分析
第4章 市場セグメンテーション
- 形態
- 濃縮物
- 単離液
- テクスチャー/加水分解
- エンドユーザー
- 飲食品
- サブエンドユーザー別
- ベーカリー
- 飲料
- 肉・鶏肉・魚介類と代替肉製品
- スナック
- パーソナルケアと化粧品
- サプリメント
- サブエンドユーザー別
- 高齢者栄養と医療栄養
- スポーツ/パフォーマンス栄養
- 飲食品
第5章 競合情勢
- 主要な戦略動向
- 市場シェア分析
- 企業情勢
- 企業プロファイル
- Axiom Foods Inc.
- Farbest-Tallman Foods Corporation
- Green Source Organics
- Kerry Group PLC
- MB-Holding GmbH & Co. KG
- Sweet Additions LLC
- Sudzucker Group
- The Scoular Company
第6章 CEOへの主要戦略的質問
第7章 付録
- 世界概要
- 概要
- ファイブフォース分析フレームワーク
- 世界のバリューチェーン分析
- 市場力学(DROs)
- 情報源と参考文献
- 図表一覧
- 主要な洞察
- データパック
- 用語集
目次
The United States Rice Protein Market size is estimated at 215.1 million USD in 2025, and is expected to reach 264.7 million USD by 2030, growing at a CAGR of 4.24% during the forecast period (2025-2030).
Growing lactose-intolerant population in the country and increasing protein consumption need is driving the use of rice protein
- Rice proteins witnessed maximum demand in the food and beverage segment, majorly led by meat/poultry/seafood and meat alternative products. In 2022, the sub-segment claimed more than 83% of rice proteins consumed in the country. Rice protein satiates multiple consumer demands, such as vegan, gluten-free, and high-protein food products. Rice proteins were used as meat extenders at different concentration levels (3%, 6%, 9%, and 12%) for the development of chicken nuggets. The segment for baking supplies and baking mixes may have extremely high demand as a result of the protein trend, which is only expected to intensify. To meet the growing demand for vegan bakery products, food producers are using rice protein to create protein-rich bakery items.
- The ingredient is gaining popularity for being hypoallergenic and a nutritious alternative for people dealing with lactose intolerance. The number of lactose-intolerant people in the country is around 30 million, leading to high demand for alternative proteins, including rice protein. Especially rice-based formulas have been used as a better alternative than soy milk for children with cow's milk allergy, as the human digestibility of polished rice protein is as high as 86-90%.
- In terms of growth, the personal care and cosmetics segment is set to outpace major categories in terms of growth, with a projected CAGR of 6.18% by value during the forecast period. This growth can be attributed to the rising demand for synthetic ingredients in beauty products. Consumers are increasingly embracing plant-based substitutes such as rice proteins, thus leading to market expansion.
United States Rice Protein Market Trends
Growth in plant protein consumption provides opportunities for key players in the ingredients market
- The per capita consumption rate of plant proteins is increasing at a considerable rate in the United States, supported by investments and innovations, resulting in a consumption rate of 40.28 grams per day, primarily due to a rising number of consumers turning vegan to promote animal welfare. This is because factory farming, where animals are maltreated, is a norm in the United States. Most Americans eat less meat and animal products, but they do not eliminate their consumption entirely. They also tend to be more flexitarian than vegan or vegetarian. Nearly 12% of consumers in the country prefer a plant-based diet, whereas 7% of consumers follow a flexitarian diet. Although consumers of all generations in the United States are interested in plant-based meals, individuals in their 20s and 30s are the keenest to adopt plant-based diets.
- There is a constant rise in the per capita consumption of pea protein due to its wide applications in different food products, like meat, poultry, and bakery products. Around 41% of consumers are interested in plant-based food derived from pea protein. Pea protein is mainly used in sports nutrition and meat alternatives. A typical serving of pea protein powder is 30 grams, with 25 grams of protein. Athletes usually use one serving per day but may take as many as three servings per day.
- Soy and whey proteins are used primarily in the food and beverage, supplement, and sports nutrition industries. In 2021, around 36% of consumers were familiar with soy protein and had consumed the same, whereas 31% of individuals consumed whey protein in the US. Similarly, the consumption of soy-based food and beverages favorably increased by 12.9% during 2014-2019, and it is likely to remain consistent throughout the forecast period.
Increase in rice production to support rice protein processors
- Functional foods, particularly dietary supplements, are emerging as one of the largest application areas of rice protein, as manufacturers are embracing the blending approach for plant protein-based products. Arkansas Grand Prairie, Mississippi Delta, Gulf Coast, and Sacramento Valley of California are four regions producing almost the entire US rice crop. Each of these regions normally specializes in a specific type of rice, referred to in the United States by length of grain, i.e., long, medium, and short. In general, long-grain production accounts for approximately 75% of US rice production, medium-grain production accounts for about 24%, and short-grain accounts for the remaining approximately 1%.
- In 2021, the United States produced 191.6 million hundredweight (cwt) of rough rice, down by 16% from 2020 but still slightly above the 2019 crop. The 2022 rice crop of 160.4 million cwt was also 16% below a year earlier, with drought in California a major factor behind declining US rice production in both 2021 and 2022.
- US long-grain rice production is concentrated in the South (e.g., Arkansas typically grows 56-58% of the US long-grain crop.) California is the main producer of medium-grain rice, typically growing 70-77% of the crop, although Arkansas grows a substantial amount of medium-grain rice, especially in years when California is experiencing drought.
- The United States is a consistent, timely supplier of high-quality rice in both the long and combined medium and short-grain global markets. Although the United States accounts for less than 2% of global rice production, it ships almost 5% of global exports, and it was the fifth-largest exporter as of 2023.
United States Rice Protein Industry Overview
The United States Rice Protein Market is moderately consolidated, with the top five companies occupying 58.38%. The major players in this market are Farbest-Tallman Foods Corporation, Kerry Group PLC, MB-Holding GmbH & Co. KG, Sudzucker Group and The Scoular Company (sorted alphabetically).
Additional Benefits:
- The market estimate (ME) sheet in Excel format
- 3 months of analyst support
TABLE OF CONTENTS
1 EXECUTIVE SUMMARY & KEY FINDINGS
2 INTRODUCTION
- 2.1 Study Assumptions & Market Definition
- 2.2 Scope of the Study
- 2.3 Research Methodology
3 KEY INDUSTRY TRENDS
- 3.1 End User Market Volume
- 3.1.1 Baby Food and Infant Formula
- 3.1.2 Bakery
- 3.1.3 Beverages
- 3.1.4 Breakfast Cereals
- 3.1.5 Condiments/Sauces
- 3.1.6 Confectionery
- 3.1.7 Dairy and Dairy Alternative Products
- 3.1.8 Elderly Nutrition and Medical Nutrition
- 3.1.9 Meat/Poultry/Seafood and Meat Alternative Products
- 3.1.10 RTE/RTC Food Products
- 3.1.11 Snacks
- 3.1.12 Sport/Performance Nutrition
- 3.1.13 Animal Feed
- 3.1.14 Personal Care and Cosmetics
- 3.2 Protein Consumption Trends
- 3.2.1 Plant
- 3.3 Production Trends
- 3.3.1 Plant
- 3.4 Regulatory Framework
- 3.4.1 United States
- 3.5 Value Chain & Distribution Channel Analysis
4 MARKET SEGMENTATION (includes market size in Value in USD and Volume, Forecasts up to 2030 and analysis of growth prospects)
- 4.1 Form
- 4.1.1 Concentrates
- 4.1.2 Isolates
- 4.1.3 Textured/Hydrolyzed
- 4.2 End User
- 4.2.1 Food and Beverages
- 4.2.1.1 By Sub End User
- 4.2.1.1.1 Bakery
- 4.2.1.1.2 Beverages
- 4.2.1.1.3 Meat/Poultry/Seafood and Meat Alternative Products
- 4.2.1.1.4 Snacks
- 4.2.2 Personal Care and Cosmetics
- 4.2.3 Supplements
- 4.2.3.1 By Sub End User
- 4.2.3.1.1 Elderly Nutrition and Medical Nutrition
- 4.2.3.1.2 Sport/Performance Nutrition
- 4.2.1 Food and Beverages
5 COMPETITIVE LANDSCAPE
- 5.1 Key Strategic Moves
- 5.2 Market Share Analysis
- 5.3 Company Landscape
- 5.4 Company Profiles (includes Global Level Overview, Market Level Overview, Core Business Segments, Financials, Headcount, Key Information, Market Rank, Market Share, Products and Services, and Analysis of Recent Developments).
- 5.4.1 Axiom Foods Inc.
- 5.4.2 Farbest-Tallman Foods Corporation
- 5.4.3 Green Source Organics
- 5.4.4 Kerry Group PLC
- 5.4.5 MB-Holding GmbH & Co. KG
- 5.4.6 Sweet Additions LLC
- 5.4.7 Sudzucker Group
- 5.4.8 The Scoular Company
6 KEY STRATEGIC QUESTIONS FOR PROTEIN INGREDIENTS INDUSTRY CEOS
7 APPENDIX
- 7.1 Global Overview
- 7.1.1 Overview
- 7.1.2 Porter's Five Forces Framework
- 7.1.3 Global Value Chain Analysis
- 7.1.4 Market Dynamics (DROs)
- 7.2 Sources & References
- 7.3 List of Tables & Figures
- 7.4 Primary Insights
- 7.5 Data Pack
- 7.6 Glossary of Terms
- 発行日
- 発行
- Mordor Intelligence
- ページ情報
- 英文 168 Pages
- 納期
- 2~3営業日