|
|
市場調査レポート
商品コード
1684891
ホイールローダーの世界市場 2025~2029年Global Wheel Loaders Market 2025-2029 |
||||||

|
|||||||
カスタマイズ可能
|
|||||||


| ホイールローダーの世界市場 2025~2029年 |
|
出版日: 2025年03月07日
発行: TechNavio
ページ情報: 英文 202 Pages
納期: 即納可能
|

全表示
- 概要
- 図表
- 目次
ホイールローダー市場は、2024~2029年にかけて302億3,870万米ドル、予測期間中のCAGRは10.4%で成長すると予測されています。
当レポートでは、ホイールローダー市場の全体的な分析、市場規模・予測、動向、成長促進要因、課題、約25のベンダーを網羅したベンダー分析などを掲載しています。
現在の市場シナリオ、最新動向と促進要因、市場環境全体に関する最新分析を提供しています。市場は、公共インフラへの投資の増加、農業分野からの需要の増大、世界の住宅プロジェクトの需要拡大によって牽引されています。
| 市場範囲 | |
|---|---|
| 基準年 | 2025年 |
| 終了年 | 2029年 |
| 予測期間 | 2025~2029年 |
| 成長モメンタム | 加速 |
| 前年比2025年 | 9.2% |
| CAGR | 10.4% |
| 増分額 | 302億3,870万米ドル |
本調査は、業界の主要参加者からのインプットを含め、一次情報と二次情報を客観的に組み合わせて実施しました。レポートには、主要企業の分析に加え、包括的な市場規模データ、地域分析によるセグメント、ベンダー情勢が含まれています。レポートには過去データと予測データがあります。
本調査では、コンパクトで効率的なホイールローダーの採用が増加していることが、今後数年間のホイールローダー市場の成長を促進する主要因の1つであると分析しています。また、電動ホイールローダーの普及と従来型燃料からのシフトは、市場の大きな需要につながるでしょう。
目次
第1章 エグゼクティブサマリー
- 市場概要
第2章 Technavio分析
- 価格・ライフサイクル・顧客購入バスケット・採用率・購入基準の分析
- インプットの重要性と差別化の要因
- 混乱の要因
- 促進要因と課題の影響
第3章 市場情勢
- 市場エコシステム
- 市場の特徴
- バリューチェーン分析
第4章 市場規模
- 市場の定義
- 市場セグメント分析
- 市場規模 2024年
- 市場展望 2024~2029年
第5章 市場規模実績
- ホイールローダーの世界市場 2019~2023年
- エンドユーザー別セグメント分析 2019~2023年
- 出力別セグメント分析 2019~2023年
- 地域別セグメント分析 2019~2023年
- 国別セグメント分析 2019~2023年
第6章 定性分析
- AIの影響:ホイールローダーの世界市場
第7章 ファイブフォース分析
- ファイブフォースの要約
- 買い手の交渉力
- 供給企業の交渉力
- 新規参入業者の脅威
- 代替品の脅威
- 競争の脅威
- 市況
第8章 市場セグメンテーション:エンドユーザー別
- 市場セグメント
- 比較:エンドユーザー別
- 建設:市場規模と予測 2024~2029年
- 農業:市場規模と予測 2024~2029年
- 市場機会:エンドユーザー別
第9章 市場セグメンテーション:出力別
- 市場セグメント
- 比較:出力別
- 80馬力以上:市場規模と予測 2024~2029年
- 40馬力未満:市場規模と予測 2024~2029年
- 市場機会:出力別
第10章 顧客情勢
- 顧客情勢の概要
第11章 地域別情勢
- 地域別セグメンテーション
- 地域別比較
- アジア太平洋:市場規模と予測 2024~2029年
- 北米:市場規模と予測 2024~2029年
- 欧州:市場規模と予測 2024~2029年
- 南米:市場規模と予測 2024~2029年
- 中東・アフリカ:市場規模と予測 2024~2029年
- 米国:市場規模と予測 2024~2029年
- 中国:市場規模と予測 2024~2029年
- カナダ:市場規模と予測 2024~2029年
- 日本:市場規模と予測 2024~2029年
- インド:市場規模と予測 2024~2029年
- 英国:市場規模と予測 2024~2029年
- 韓国:市場規模と予測 2024~2029年
- ドイツ:市場規模と予測 2024~2029年
- ブラジル:市場規模と予測 2024~2029年
- フランス:市場規模と予測 2024~2029年
- 市場機会:地域情勢別
第12章 促進要因・課題・機会・抑制要因
- 市場促進要因
- 市場の課題
- 促進要因と課題の影響
- 市場の機会・抑制要因
第13章 競合情勢
- 概要
- 競合情勢
- 混乱の状況
- 業界のリスク
第14章 競合分析
- 企業プロファイル
- 企業ランキング指数
- 企業の市場ポジショニング
- AB Volvo
- AGCO Corp.
- Caterpillar Inc.
- CNH Industrial NV
- Deere and Co.
- Doosan Corp.
- Hidromek Hidrolik ve Mekanik Makina Imalat Sanayi ve Ticaret A.S.
- Hitachi Ltd.
- Hyundai Heavy Industries Co. Ltd.
- J C Bamford Excavators Ltd.
- Komatsu Ltd.
- Liebherr International AG
- Lonking Holdings Ltd.
- Schaffer Maschinenfabrik GmbH
- Yanmar Holdings Co. Ltd.
第15章 付録
Exhibits:
- Exhibits1: Executive Summary - Chart on Market Overview
- Exhibits2: Executive Summary - Data Table on Market Overview
- Exhibits3: Executive Summary - Chart on Global Market Characteristics
- Exhibits4: Executive Summary - Chart on Market By Geographical Landscape
- Exhibits5: Executive Summary - Chart on Market Segmentation by End-user
- Exhibits6: Executive Summary - Chart on Market Segmentation by Power Output
- Exhibits7: Executive Summary - Chart on Incremental Growth
- Exhibits8: Executive Summary - Data Table on Incremental Growth
- Exhibits9: Executive Summary - Chart on Company Market Positioning
- Exhibits10: Analysis of price sensitivity, lifecycle, customer purchase basket, adoption rates, and purchase criteria
- Exhibits11: Overview on criticality of inputs and factors of differentiation
- Exhibits12: Overview on factors of disruption
- Exhibits13: Impact of drivers and challenges in 2024 and 2029
- Exhibits14: Parent Market
- Exhibits15: Data Table on - Parent Market
- Exhibits16: Market characteristics analysis
- Exhibits17: Value chain analysis
- Exhibits18: Offerings of companies included in the market definition
- Exhibits19: Market segments
- Exhibits20: Chart on Global - Market size and forecast 2024-2029 ($ million)
- Exhibits21: Data Table on Global - Market size and forecast 2024-2029 ($ million)
- Exhibits22: Chart on Global Market: Year-over-year growth 2024-2029 (%)
- Exhibits23: Data Table on Global Market: Year-over-year growth 2024-2029 (%)
- Exhibits24: Historic Market Size - Data Table on Global Wheel Loaders Market 2019 - 2023 ($ million)
- Exhibits25: Historic Market Size - End-user Segment 2019 - 2023 ($ million)
- Exhibits26: Historic Market Size - Power Output Segment 2019 - 2023 ($ million)
- Exhibits27: Historic Market Size - Geography Segment 2019 - 2023 ($ million)
- Exhibits28: Historic Market Size - Country Segment 2019 - 2023 ($ million)
- Exhibits29: Five forces analysis - Comparison between 2024 and 2029
- Exhibits30: Bargaining power of buyers - Impact of key factors 2024 and 2029
- Exhibits31: Bargaining power of suppliers - Impact of key factors in 2024 and 2029
- Exhibits32: Threat of new entrants - Impact of key factors in 2024 and 2029
- Exhibits33: Threat of substitutes - Impact of key factors in 2024 and 2029
- Exhibits34: Threat of rivalry - Impact of key factors in 2024 and 2029
- Exhibits35: Chart on Market condition - Five forces 2024 and 2029
- Exhibits36: Chart on End-user - Market share 2024-2029 (%)
- Exhibits37: Data Table on End-user - Market share 2024-2029 (%)
- Exhibits38: Chart on Comparison by End-user
- Exhibits39: Data Table on Comparison by End-user
- Exhibits40: Chart on Construction - Market size and forecast 2024-2029 ($ million)
- Exhibits41: Data Table on Construction - Market size and forecast 2024-2029 ($ million)
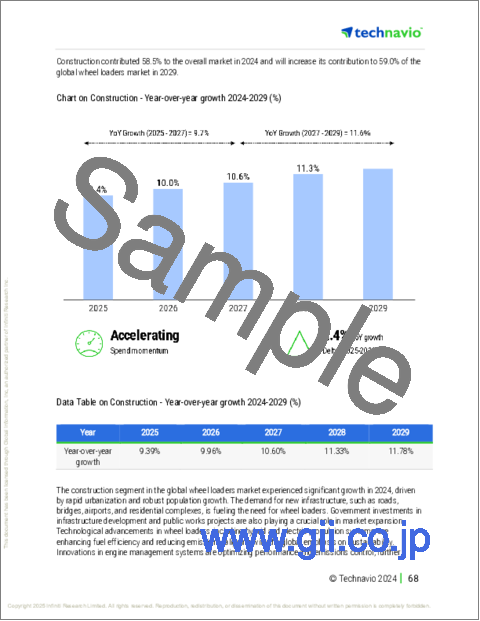
- Exhibits42: Chart on Construction - Year-over-year growth 2024-2029 (%)
- Exhibits43: Data Table on Construction - Year-over-year growth 2024-2029 (%)
- Exhibits44: Chart on Agriculture - Market size and forecast 2024-2029 ($ million)
- Exhibits45: Data Table on Agriculture - Market size and forecast 2024-2029 ($ million)
- Exhibits46: Chart on Agriculture - Year-over-year growth 2024-2029 (%)
- Exhibits47: Data Table on Agriculture - Year-over-year growth 2024-2029 (%)
- Exhibits48: Market opportunity by End-user ($ million)
- Exhibits49: Data Table on Market opportunity by End-user ($ million)
- Exhibits50: Chart on Power Output - Market share 2024-2029 (%)
- Exhibits51: Data Table on Power Output - Market share 2024-2029 (%)
- Exhibits52: Chart on Comparison by Power Output
- Exhibits53: Data Table on Comparison by Power Output
- Exhibits54: Chart on More than 80 HP - Market size and forecast 2024-2029 ($ million)
- Exhibits55: Data Table on More than 80 HP - Market size and forecast 2024-2029 ($ million)
- Exhibits56: Chart on More than 80 HP - Year-over-year growth 2024-2029 (%)
- Exhibits57: Data Table on More than 80 HP - Year-over-year growth 2024-2029 (%)
- Exhibits58: Chart on 40 to 80 HP - Market size and forecast 2024-2029 ($ million)
- Exhibits59: Data Table on 40 to 80 HP - Market size and forecast 2024-2029 ($ million)
- Exhibits60: Chart on 40 to 80 HP - Year-over-year growth 2024-2029 (%)
- Exhibits61: Data Table on 40 to 80 HP - Year-over-year growth 2024-2029 (%)
- Exhibits62: Chart on Less than 40 HP - Market size and forecast 2024-2029 ($ million)
- Exhibits63: Data Table on Less than 40 HP - Market size and forecast 2024-2029 ($ million)
- Exhibits64: Chart on Less than 40 HP - Year-over-year growth 2024-2029 (%)
- Exhibits65: Data Table on Less than 40 HP - Year-over-year growth 2024-2029 (%)
- Exhibits66: Market opportunity by Power Output ($ million)
- Exhibits67: Data Table on Market opportunity by Power Output ($ million)
- Exhibits68: Analysis of price sensitivity, lifecycle, customer purchase basket, adoption rates, and purchase criteria
- Exhibits69: Chart on Market share By Geographical Landscape 2024-2029 (%)
- Exhibits70: Data Table on Market share By Geographical Landscape 2024-2029 (%)
- Exhibits71: Chart on Geographic comparison
- Exhibits72: Data Table on Geographic comparison
- Exhibits73: Chart on APAC - Market size and forecast 2024-2029 ($ million)
- Exhibits74: Data Table on APAC - Market size and forecast 2024-2029 ($ million)
- Exhibits75: Chart on APAC - Year-over-year growth 2024-2029 (%)
- Exhibits76: Data Table on APAC - Year-over-year growth 2024-2029 (%)
- Exhibits77: Chart on North America - Market size and forecast 2024-2029 ($ million)
- Exhibits78: Data Table on North America - Market size and forecast 2024-2029 ($ million)
- Exhibits79: Chart on North America - Year-over-year growth 2024-2029 (%)
- Exhibits80: Data Table on North America - Year-over-year growth 2024-2029 (%)
- Exhibits81: Chart on Europe - Market size and forecast 2024-2029 ($ million)
- Exhibits82: Data Table on Europe - Market size and forecast 2024-2029 ($ million)
- Exhibits83: Chart on Europe - Year-over-year growth 2024-2029 (%)
- Exhibits84: Data Table on Europe - Year-over-year growth 2024-2029 (%)
- Exhibits85: Chart on South America - Market size and forecast 2024-2029 ($ million)
- Exhibits86: Data Table on South America - Market size and forecast 2024-2029 ($ million)
- Exhibits87: Chart on South America - Year-over-year growth 2024-2029 (%)
- Exhibits88: Data Table on South America - Year-over-year growth 2024-2029 (%)
- Exhibits89: Chart on Middle East and Africa - Market size and forecast 2024-2029 ($ million)
- Exhibits90: Data Table on Middle East and Africa - Market size and forecast 2024-2029 ($ million)
- Exhibits91: Chart on Middle East and Africa - Year-over-year growth 2024-2029 (%)
- Exhibits92: Data Table on Middle East and Africa - Year-over-year growth 2024-2029 (%)
- Exhibits93: Chart on US - Market size and forecast 2024-2029 ($ million)
- Exhibits94: Data Table on US - Market size and forecast 2024-2029 ($ million)
- Exhibits95: Chart on US - Year-over-year growth 2024-2029 (%)
- Exhibits96: Data Table on US - Year-over-year growth 2024-2029 (%)
- Exhibits97: Chart on China - Market size and forecast 2024-2029 ($ million)
- Exhibits98: Data Table on China - Market size and forecast 2024-2029 ($ million)
- Exhibits99: Chart on China - Year-over-year growth 2024-2029 (%)
- Exhibits100: Data Table on China - Year-over-year growth 2024-2029 (%)
- Exhibits101: Chart on Canada - Market size and forecast 2024-2029 ($ million)
- Exhibits102: Data Table on Canada - Market size and forecast 2024-2029 ($ million)
- Exhibits103: Chart on Canada - Year-over-year growth 2024-2029 (%)
- Exhibits104: Data Table on Canada - Year-over-year growth 2024-2029 (%)
- Exhibits105: Chart on Japan - Market size and forecast 2024-2029 ($ million)
- Exhibits106: Data Table on Japan - Market size and forecast 2024-2029 ($ million)
- Exhibits107: Chart on Japan - Year-over-year growth 2024-2029 (%)
- Exhibits108: Data Table on Japan - Year-over-year growth 2024-2029 (%)
- Exhibits109: Chart on India - Market size and forecast 2024-2029 ($ million)
- Exhibits110: Data Table on India - Market size and forecast 2024-2029 ($ million)
- Exhibits111: Chart on India - Year-over-year growth 2024-2029 (%)
- Exhibits112: Data Table on India - Year-over-year growth 2024-2029 (%)
- Exhibits113: Chart on UK - Market size and forecast 2024-2029 ($ million)
- Exhibits114: Data Table on UK - Market size and forecast 2024-2029 ($ million)
- Exhibits115: Chart on UK - Year-over-year growth 2024-2029 (%)
- Exhibits116: Data Table on UK - Year-over-year growth 2024-2029 (%)
- Exhibits117: Chart on South Korea - Market size and forecast 2024-2029 ($ million)
- Exhibits118: Data Table on South Korea - Market size and forecast 2024-2029 ($ million)
- Exhibits119: Chart on South Korea - Year-over-year growth 2024-2029 (%)
- Exhibits120: Data Table on South Korea - Year-over-year growth 2024-2029 (%)
- Exhibits121: Chart on Germany - Market size and forecast 2024-2029 ($ million)
- Exhibits122: Data Table on Germany - Market size and forecast 2024-2029 ($ million)
- Exhibits123: Chart on Germany - Year-over-year growth 2024-2029 (%)
- Exhibits124: Data Table on Germany - Year-over-year growth 2024-2029 (%)
- Exhibits125: Chart on Brazil - Market size and forecast 2024-2029 ($ million)
- Exhibits126: Data Table on Brazil - Market size and forecast 2024-2029 ($ million)
- Exhibits127: Chart on Brazil - Year-over-year growth 2024-2029 (%)
- Exhibits128: Data Table on Brazil - Year-over-year growth 2024-2029 (%)
- Exhibits129: Chart on France - Market size and forecast 2024-2029 ($ million)
- Exhibits130: Data Table on France - Market size and forecast 2024-2029 ($ million)
- Exhibits131: Chart on France - Year-over-year growth 2024-2029 (%)
- Exhibits132: Data Table on France - Year-over-year growth 2024-2029 (%)
- Exhibits133: Market opportunity By Geographical Landscape ($ million)
- Exhibits134: Data Tables on Market opportunity By Geographical Landscape ($ million)
- Exhibits135: Impact of drivers and challenges in 2024 and 2029
- Exhibits136: Overview on criticality of inputs and factors of differentiation
- Exhibits137: Overview on factors of disruption
- Exhibits138: Impact of key risks on business
- Exhibits139: Companies covered
- Exhibits140: Company ranking index
- Exhibits141: Matrix on companies position and classification
- Exhibits142: AB Volvo - Overview
- Exhibits143: AB Volvo - Business segments
- Exhibits144: AB Volvo - Key news
- Exhibits145: AB Volvo - Key offerings
- Exhibits146: AB Volvo - Segment focus
- Exhibits147: SWOT
- Exhibits148: AGCO Corp. - Overview
- Exhibits149: AGCO Corp. - Business segments
- Exhibits150: AGCO Corp. - Key news
- Exhibits151: AGCO Corp. - Key offerings
- Exhibits152: AGCO Corp. - Segment focus
- Exhibits153: SWOT
- Exhibits154: Caterpillar Inc. - Overview
- Exhibits155: Caterpillar Inc. - Business segments
- Exhibits156: Caterpillar Inc. - Key news
- Exhibits157: Caterpillar Inc. - Key offerings
- Exhibits158: Caterpillar Inc. - Segment focus
- Exhibits159: SWOT
- Exhibits160: CNH Industrial NV - Overview
- Exhibits161: CNH Industrial NV - Business segments
- Exhibits162: CNH Industrial NV - Key offerings
- Exhibits163: CNH Industrial NV - Segment focus
- Exhibits164: SWOT
- Exhibits165: Deere and Co. - Overview
- Exhibits166: Deere and Co. - Business segments
- Exhibits167: Deere and Co. - Key news
- Exhibits168: Deere and Co. - Key offerings
- Exhibits169: Deere and Co. - Segment focus
- Exhibits170: SWOT
- Exhibits171: Doosan Corp. - Overview
- Exhibits172: Doosan Corp. - Business segments
- Exhibits173: Doosan Corp. - Key news
- Exhibits174: Doosan Corp. - Key offerings
- Exhibits175: Doosan Corp. - Segment focus
- Exhibits176: SWOT
- Exhibits177: Hidromek Hidrolik ve Mekanik Makina Imalat Sanayi ve Ticaret A.S. - Overview
- Exhibits178: Hidromek Hidrolik ve Mekanik Makina Imalat Sanayi ve Ticaret A.S. - Product / Service
- Exhibits179: Hidromek Hidrolik ve Mekanik Makina Imalat Sanayi ve Ticaret A.S. - Key offerings
- Exhibits180: SWOT
- Exhibits181: Hitachi Ltd. - Overview
- Exhibits182: Hitachi Ltd. - Business segments
- Exhibits183: Hitachi Ltd. - Key news
- Exhibits184: Hitachi Ltd. - Key offerings
- Exhibits185: Hitachi Ltd. - Segment focus
- Exhibits186: SWOT
- Exhibits187: Hyundai Heavy Industries Co. Ltd. - Overview
- Exhibits188: Hyundai Heavy Industries Co. Ltd. - Product / Service
- Exhibits189: Hyundai Heavy Industries Co. Ltd. - Key offerings
- Exhibits190: SWOT
- Exhibits191: J C Bamford Excavators Ltd. - Overview
- Exhibits192: J C Bamford Excavators Ltd. - Product / Service
- Exhibits193: J C Bamford Excavators Ltd. - Key offerings
- Exhibits194: SWOT
- Exhibits195: Komatsu Ltd. - Overview
- Exhibits196: Komatsu Ltd. - Business segments
- Exhibits197: Komatsu Ltd. - Key news
- Exhibits198: Komatsu Ltd. - Key offerings
- Exhibits199: Komatsu Ltd. - Segment focus
- Exhibits200: SWOT
- Exhibits201: Liebherr International AG - Overview
- Exhibits202: Liebherr International AG - Product / Service
- Exhibits203: Liebherr International AG - Key offerings
- Exhibits204: SWOT
- Exhibits205: Lonking Holdings Ltd. - Overview
- Exhibits206: Lonking Holdings Ltd. - Business segments
- Exhibits207: Lonking Holdings Ltd. - Key offerings
- Exhibits208: Lonking Holdings Ltd. - Segment focus
- Exhibits209: SWOT
- Exhibits210: Schaffer Maschinenfabrik GmbH - Overview
- Exhibits211: Schaffer Maschinenfabrik GmbH - Product / Service
- Exhibits212: Schaffer Maschinenfabrik GmbH - Key offerings
- Exhibits213: SWOT
- Exhibits214: Yanmar Holdings Co. Ltd. - Overview
- Exhibits215: Yanmar Holdings Co. Ltd. - Product / Service
- Exhibits216: Yanmar Holdings Co. Ltd. - Key news
- Exhibits217: Yanmar Holdings Co. Ltd. - Key offerings
- Exhibits218: SWOT
- Exhibits219: Inclusions checklist
- Exhibits220: Exclusions checklist
- Exhibits221: Currency conversion rates for US$
- Exhibits222: Research methodology
- Exhibits223: Information sources
- Exhibits224: Data validation
- Exhibits225: Validation techniques employed for market sizing
- Exhibits226: Data synthesis
- Exhibits227: 360 degree market analysis
- Exhibits228: List of abbreviations
The wheel loaders market is forecasted to grow by USD 30238.7 million during 2024-2029, accelerating at a CAGR of 10.4% during the forecast period. The report on the wheel loaders market provides a holistic analysis, market size and forecast, trends, growth drivers, and challenges, as well as vendor analysis covering around 25 vendors.
The report offers an up-to-date analysis regarding the current market scenario, the latest trends and drivers, and the overall market environment. The market is driven by increasing investments in public infrastructure, augmented demand from agriculture sector, and growing demand for housing projects worldwide.
| Market Scope | |
|---|---|
| Base Year | 2025 |
| End Year | 2029 |
| Series Year | 2025-2029 |
| Growth Momentum | Accelerate |
| YOY 2025 | 9.2% |
| CAGR | 10.4% |
| Incremental Value | $30238.7 mn |
The study was conducted using an objective combination of primary and secondary information including inputs from key participants in the industry. The report contains a comprehensive market size data, segment with regional analysis and vendor landscape in addition to an analysis of the key companies. Reports have historic and forecast data.
Technavio's wheel loaders market is segmented as below:
By End-user
- Construction
- Agriculture
By Power Output
- More than 80 HP
- 40 to 80 HP
- Less than 40 HP
By Geographical Landscape
- APAC
- North America
- Europe
- South America
- Middle East and Africa
This study identifies the rising adoption of compact and efficient wheel loaders as one of the prime reasons driving the wheel loaders market growth during the next few years. Also, electric wheel loaders gaining traction and shift from conventional fuels will lead to sizable demand in the market.
The report on the wheel loaders market covers the following areas:
- Wheel Loaders Market sizing
- Wheel Loaders Market forecast
- Wheel Loaders Market industry analysis
The robust vendor analysis is designed to help clients improve their market position, and in line with this, this report provides a detailed analysis of several leading wheel loaders market vendors that include AB Volvo, AGCO Corp., Caterpillar Inc., CNH Industrial NV, Deere and Co., Doosan Corp., Groupe Mecalac SAS, Hidromek Hidrolik ve Mekanik Makina Imalat Sanayi ve Ticaret A.S., Hitachi Ltd., Hyundai Heavy Industries Co. Ltd., J C Bamford Excavators Ltd., Komatsu Ltd., Liebherr International AG, Lonking Holdings Ltd., Manitou BF SA, Sany Group, Schaffer Maschinenfabrik GmbH, Shandong Heavy Industry Group Co. Ltd., Wacker Neuson SE, and Yanmar Holdings Co. Ltd.. Also, the wheel loaders market analysis report includes information on upcoming trends and challenges that will influence market growth. This is to help companies strategize and leverage all forthcoming growth opportunities.
The publisher presents a detailed picture of the market by the way of study, synthesis, and summation of data from multiple sources by an analysis of key parameters such as profit, pricing, competition, and promotions. It presents various market facets by identifying the key industry influencers. The data presented is comprehensive, reliable, and a result of extensive primary and secondary research. The market research reports provide a complete competitive landscape and an in-depth vendor selection methodology and analysis using qualitative and quantitative research to forecast accurate market growth.
Table of Contents
1 Executive Summary
- 1.1 Market overview
- Executive Summary - Chart on Market Overview
- Executive Summary - Data Table on Market Overview
- Executive Summary - Chart on Global Market Characteristics
- Executive Summary - Chart on Market By Geographical Landscape
- Executive Summary - Chart on Market Segmentation by End-user
- Executive Summary - Chart on Market Segmentation by Power Output
- Executive Summary - Chart on Incremental Growth
- Executive Summary - Data Table on Incremental Growth
- Executive Summary - Chart on Company Market Positioning
2 Technavio Analysis
- 2.1 Analysis of price sensitivity, lifecycle, customer purchase basket, adoption rates, and purchase criteria
- Analysis of price sensitivity, lifecycle, customer purchase basket, adoption rates, and purchase criteria
- 2.2 Criticality of inputs and Factors of differentiation
- Overview on criticality of inputs and factors of differentiation
- 2.3 Factors of disruption
- Overview on factors of disruption
- 2.4 Impact of drivers and challenges
- Impact of drivers and challenges in 2024 and 2029
3 Market Landscape
- 3.1 Market ecosystem
- Parent Market
- Data Table on - Parent Market
- 3.2 Market characteristics
- Market characteristics analysis
- 3.3 Value chain analysis
- Value chain analysis
4 Market Sizing
- 4.1 Market definition
- Offerings of companies included in the market definition
- 4.2 Market segment analysis
- Market segments
- 4.3 Market size 2024
- 4.4 Market outlook: Forecast for 2024-2029
- Chart on Global - Market size and forecast 2024-2029 ($ million)
- Data Table on Global - Market size and forecast 2024-2029 ($ million)
- Chart on Global Market: Year-over-year growth 2024-2029 (%)
- Data Table on Global Market: Year-over-year growth 2024-2029 (%)
5 Historic Market Size
- 5.1 Global Wheel Loaders Market 2019 - 2023
- Historic Market Size - Data Table on Global Wheel Loaders Market 2019 - 2023 ($ million)
- 5.2 End-user segment analysis 2019 - 2023
- Historic Market Size - End-user Segment 2019 - 2023 ($ million)
- 5.3 Power Output segment analysis 2019 - 2023
- Historic Market Size - Power Output Segment 2019 - 2023 ($ million)
- 5.4 Geography segment analysis 2019 - 2023
- Historic Market Size - Geography Segment 2019 - 2023 ($ million)
- 5.5 Country segment analysis 2019 - 2023
- Historic Market Size - Country Segment 2019 - 2023 ($ million)
6 Qualitative Analysis
- 6.1 The AI impact on Global Wheel Loaders Market
7 Five Forces Analysis
- 7.1 Five forces summary
- Five forces analysis - Comparison between 2024 and 2029
- 7.2 Bargaining power of buyers
- Bargaining power of buyers - Impact of key factors 2024 and 2029
- 7.3 Bargaining power of suppliers
- Bargaining power of suppliers - Impact of key factors in 2024 and 2029
- 7.4 Threat of new entrants
- Threat of new entrants - Impact of key factors in 2024 and 2029
- 7.5 Threat of substitutes
- Threat of substitutes - Impact of key factors in 2024 and 2029
- 7.6 Threat of rivalry
- Threat of rivalry - Impact of key factors in 2024 and 2029
- 7.7 Market condition
- Chart on Market condition - Five forces 2024 and 2029
8 Market Segmentation by End-user
- 8.1 Market segments
- Chart on End-user - Market share 2024-2029 (%)
- Data Table on End-user - Market share 2024-2029 (%)
- 8.2 Comparison by End-user
- Chart on Comparison by End-user
- Data Table on Comparison by End-user
- 8.3 Construction - Market size and forecast 2024-2029
- Chart on Construction - Market size and forecast 2024-2029 ($ million)
- Data Table on Construction - Market size and forecast 2024-2029 ($ million)
- Chart on Construction - Year-over-year growth 2024-2029 (%)
- Data Table on Construction - Year-over-year growth 2024-2029 (%)
- 8.4 Agriculture - Market size and forecast 2024-2029
- Chart on Agriculture - Market size and forecast 2024-2029 ($ million)
- Data Table on Agriculture - Market size and forecast 2024-2029 ($ million)
- Chart on Agriculture - Year-over-year growth 2024-2029 (%)
- Data Table on Agriculture - Year-over-year growth 2024-2029 (%)
- 8.5 Market opportunity by End-user
- Market opportunity by End-user ($ million)
- Data Table on Market opportunity by End-user ($ million)
9 Market Segmentation by Power Output
- 9.1 Market segments
- Chart on Power Output - Market share 2024-2029 (%)
- Data Table on Power Output - Market share 2024-2029 (%)
- 9.2 Comparison by Power Output
- Chart on Comparison by Power Output
- Data Table on Comparison by Power Output
- 9.3 More than 80 HP - Market size and forecast 2024-2029
- Chart on More than 80 HP - Market size and forecast 2024-2029 ($ million)
- Data Table on More than 80 HP - Market size and forecast 2024-2029 ($ million)
- Chart on More than 80 HP - Year-over-year growth 2024-2029 (%)
- Data Table on More than 80 HP - Year-over-year growth 2024-2029 (%)
- 40 to 80 HP - Market size and forecast 2024-2029
- Chart on 40 to 80 HP - Market size and forecast 2024-2029 ($ million)
- Data Table on 40 to 80 HP - Market size and forecast 2024-2029 ($ million)
- Chart on 40 to 80 HP - Year-over-year growth 2024-2029 (%)
- Data Table on 40 to 80 HP - Year-over-year growth 2024-2029 (%)
- 9.5 Less than 40 HP - Market size and forecast 2024-2029
- Chart on Less than 40 HP - Market size and forecast 2024-2029 ($ million)
- Data Table on Less than 40 HP - Market size and forecast 2024-2029 ($ million)
- Chart on Less than 40 HP - Year-over-year growth 2024-2029 (%)
- Data Table on Less than 40 HP - Year-over-year growth 2024-2029 (%)
- 9.6 Market opportunity by Power Output
- Market opportunity by Power Output ($ million)
- Data Table on Market opportunity by Power Output ($ million)
10 Customer Landscape
- 10.1 Customer landscape overview
- Analysis of price sensitivity, lifecycle, customer purchase basket, adoption rates, and purchase criteria
11 Geographic Landscape
- 11.1 Geographic segmentation
- Chart on Market share By Geographical Landscape 2024-2029 (%)
- Data Table on Market share By Geographical Landscape 2024-2029 (%)
- 11.2 Geographic comparison
- Chart on Geographic comparison
- Data Table on Geographic comparison
- 11.3 APAC - Market size and forecast 2024-2029
- Chart on APAC - Market size and forecast 2024-2029 ($ million)
- Data Table on APAC - Market size and forecast 2024-2029 ($ million)
- Chart on APAC - Year-over-year growth 2024-2029 (%)
- Data Table on APAC - Year-over-year growth 2024-2029 (%)
- 11.4 North America - Market size and forecast 2024-2029
- Chart on North America - Market size and forecast 2024-2029 ($ million)
- Data Table on North America - Market size and forecast 2024-2029 ($ million)
- Chart on North America - Year-over-year growth 2024-2029 (%)
- Data Table on North America - Year-over-year growth 2024-2029 (%)
- 11.5 Europe - Market size and forecast 2024-2029
- Chart on Europe - Market size and forecast 2024-2029 ($ million)
- Data Table on Europe - Market size and forecast 2024-2029 ($ million)
- Chart on Europe - Year-over-year growth 2024-2029 (%)
- Data Table on Europe - Year-over-year growth 2024-2029 (%)
- 11.6 South America - Market size and forecast 2024-2029
- Chart on South America - Market size and forecast 2024-2029 ($ million)
- Data Table on South America - Market size and forecast 2024-2029 ($ million)
- Chart on South America - Year-over-year growth 2024-2029 (%)
- Data Table on South America - Year-over-year growth 2024-2029 (%)
- 11.7 Middle East and Africa - Market size and forecast 2024-2029
- Chart on Middle East and Africa - Market size and forecast 2024-2029 ($ million)
- Data Table on Middle East and Africa - Market size and forecast 2024-2029 ($ million)
- Chart on Middle East and Africa - Year-over-year growth 2024-2029 (%)
- Data Table on Middle East and Africa - Year-over-year growth 2024-2029 (%)
- 11.8 US - Market size and forecast 2024-2029
- Chart on US - Market size and forecast 2024-2029 ($ million)
- Data Table on US - Market size and forecast 2024-2029 ($ million)
- Chart on US - Year-over-year growth 2024-2029 (%)
- Data Table on US - Year-over-year growth 2024-2029 (%)
- 11.9 China - Market size and forecast 2024-2029
- Chart on China - Market size and forecast 2024-2029 ($ million)
- Data Table on China - Market size and forecast 2024-2029 ($ million)
- Chart on China - Year-over-year growth 2024-2029 (%)
- Data Table on China - Year-over-year growth 2024-2029 (%)
- 11.10 Canada - Market size and forecast 2024-2029
- Chart on Canada - Market size and forecast 2024-2029 ($ million)
- Data Table on Canada - Market size and forecast 2024-2029 ($ million)
- Chart on Canada - Year-over-year growth 2024-2029 (%)
- Data Table on Canada - Year-over-year growth 2024-2029 (%)
- 11.11 Japan - Market size and forecast 2024-2029
- Chart on Japan - Market size and forecast 2024-2029 ($ million)
- Data Table on Japan - Market size and forecast 2024-2029 ($ million)
- Chart on Japan - Year-over-year growth 2024-2029 (%)
- Data Table on Japan - Year-over-year growth 2024-2029 (%)
- 11.12 India - Market size and forecast 2024-2029
- Chart on India - Market size and forecast 2024-2029 ($ million)
- Data Table on India - Market size and forecast 2024-2029 ($ million)
- Chart on India - Year-over-year growth 2024-2029 (%)
- Data Table on India - Year-over-year growth 2024-2029 (%)
- 11.13 UK - Market size and forecast 2024-2029
- Chart on UK - Market size and forecast 2024-2029 ($ million)
- Data Table on UK - Market size and forecast 2024-2029 ($ million)
- Chart on UK - Year-over-year growth 2024-2029 (%)
- Data Table on UK - Year-over-year growth 2024-2029 (%)
- 11.14 South Korea - Market size and forecast 2024-2029
- Chart on South Korea - Market size and forecast 2024-2029 ($ million)
- Data Table on South Korea - Market size and forecast 2024-2029 ($ million)
- Chart on South Korea - Year-over-year growth 2024-2029 (%)
- Data Table on South Korea - Year-over-year growth 2024-2029 (%)
- 11.15 Germany - Market size and forecast 2024-2029
- Chart on Germany - Market size and forecast 2024-2029 ($ million)
- Data Table on Germany - Market size and forecast 2024-2029 ($ million)
- Chart on Germany - Year-over-year growth 2024-2029 (%)
- Data Table on Germany - Year-over-year growth 2024-2029 (%)
- 11.16 Brazil - Market size and forecast 2024-2029
- Chart on Brazil - Market size and forecast 2024-2029 ($ million)
- Data Table on Brazil - Market size and forecast 2024-2029 ($ million)
- Chart on Brazil - Year-over-year growth 2024-2029 (%)
- Data Table on Brazil - Year-over-year growth 2024-2029 (%)
- 11.17 France - Market size and forecast 2024-2029
- Chart on France - Market size and forecast 2024-2029 ($ million)
- Data Table on France - Market size and forecast 2024-2029 ($ million)
- Chart on France - Year-over-year growth 2024-2029 (%)
- Data Table on France - Year-over-year growth 2024-2029 (%)
- 11.18 Market opportunity By Geographical Landscape
- Market opportunity By Geographical Landscape ($ million)
- Data Tables on Market opportunity By Geographical Landscape ($ million)
12 Drivers, Challenges, and Opportunity/Restraints
- 12.1 Market drivers
- 12.2 Market challenges
- 12.3 Impact of drivers and challenges
- Impact of drivers and challenges in 2024 and 2029
- 12.4 Market opportunities/restraints
13 Competitive Landscape
- 13.1 Overview
- 13.2 Competitive Landscape
- Overview on criticality of inputs and factors of differentiation
- 13.3 Landscape disruption
- Overview on factors of disruption
- 13.4 Industry risks
- Impact of key risks on business
14 Competitive Analysis
- 14.1 Companies profiled
- Companies covered
- 14.2 Company ranking index
- Company ranking index
- 14.3 Market positioning of companies
- Matrix on companies position and classification
- 14.4 AB Volvo
- AB Volvo - Overview
- AB Volvo - Business segments
- AB Volvo - Key news
- AB Volvo - Key offerings
- AB Volvo - Segment focus
- SWOT
- 14.5 AGCO Corp.
- AGCO Corp. - Overview
- AGCO Corp. - Business segments
- AGCO Corp. - Key news
- AGCO Corp. - Key offerings
- AGCO Corp. - Segment focus
- SWOT
- 14.6 Caterpillar Inc.
- Caterpillar Inc. - Overview
- Caterpillar Inc. - Business segments
- Caterpillar Inc. - Key news
- Caterpillar Inc. - Key offerings
- Caterpillar Inc. - Segment focus
- SWOT
- 14.7 CNH Industrial NV
- CNH Industrial NV - Overview
- CNH Industrial NV - Business segments
- CNH Industrial NV - Key offerings
- CNH Industrial NV - Segment focus
- SWOT
- 14.8 Deere and Co.
- Deere and Co. - Overview
- Deere and Co. - Business segments
- Deere and Co. - Key news
- Deere and Co. - Key offerings
- Deere and Co. - Segment focus
- SWOT
- 14.9 Doosan Corp.
- Doosan Corp. - Overview
- Doosan Corp. - Business segments
- Doosan Corp. - Key news
- Doosan Corp. - Key offerings
- Doosan Corp. - Segment focus
- SWOT
- 14.10 Hidromek Hidrolik ve Mekanik Makina Imalat Sanayi ve Ticaret A.S.
- Hidromek Hidrolik ve Mekanik Makina Imalat Sanayi ve Ticaret A.S. - Overview
- Hidromek Hidrolik ve Mekanik Makina Imalat Sanayi ve Ticaret A.S. - Product / Service
- Hidromek Hidrolik ve Mekanik Makina Imalat Sanayi ve Ticaret A.S. - Key offerings
- SWOT
- 14.11 Hitachi Ltd.
- Hitachi Ltd. - Overview
- Hitachi Ltd. - Business segments
- Hitachi Ltd. - Key news
- Hitachi Ltd. - Key offerings
- Hitachi Ltd. - Segment focus
- SWOT
- 14.12 Hyundai Heavy Industries Co. Ltd.
- Hyundai Heavy Industries Co. Ltd. - Overview
- Hyundai Heavy Industries Co. Ltd. - Product / Service
- Hyundai Heavy Industries Co. Ltd. - Key offerings
- SWOT
- 14.13 J C Bamford Excavators Ltd.
- J C Bamford Excavators Ltd. - Overview
- J C Bamford Excavators Ltd. - Product / Service
- J C Bamford Excavators Ltd. - Key offerings
- SWOT
- 14.14 Komatsu Ltd.
- Komatsu Ltd. - Overview
- Komatsu Ltd. - Business segments
- Komatsu Ltd. - Key news
- Komatsu Ltd. - Key offerings
- Komatsu Ltd. - Segment focus
- SWOT
- 14.15 Liebherr International AG
- Liebherr International AG - Overview
- Liebherr International AG - Product / Service
- Liebherr International AG - Key offerings
- SWOT
- 14.16 Lonking Holdings Ltd.
- Lonking Holdings Ltd. - Overview
- Lonking Holdings Ltd. - Business segments
- Lonking Holdings Ltd. - Key offerings
- Lonking Holdings Ltd. - Segment focus
- SWOT
- 14.17 Schaffer Maschinenfabrik GmbH
- Schaffer Maschinenfabrik GmbH - Overview
- Schaffer Maschinenfabrik GmbH - Product / Service
- Schaffer Maschinenfabrik GmbH - Key offerings
- SWOT
- 14.18 Yanmar Holdings Co. Ltd.
- Yanmar Holdings Co. Ltd. - Overview
- Yanmar Holdings Co. Ltd. - Product / Service
- Yanmar Holdings Co. Ltd. - Key news
- Yanmar Holdings Co. Ltd. - Key offerings
- SWOT
15 Appendix
- 15.1 Scope of the report
- 15.2 Inclusions and exclusions checklist
- Inclusions checklist
- Exclusions checklist
- 15.3 Currency conversion rates for US$
- Currency conversion rates for US$
- 15.4 Research methodology
- Research methodology
- 15.5 Data procurement
- Information sources
- 15.6 Data validation
- Data validation
- 15.7 Validation techniques employed for market sizing
- Validation techniques employed for market sizing
- 15.8 Data synthesis
- Data synthesis
- 15.9 360 degree market analysis
- 360 degree market analysis
- 15.10 List of abbreviations
- List of abbreviations
