
米たんぱく質:市場シェア分析、産業動向・統計、成長予測(2025年~2030年)
Rice Protein - Market Share Analysis, Industry Trends & Statistics, Growth Forecasts (2025 - 2030)- 発行日
- ページ情報
- 英文 357 Pages
- 納期
- 2~3営業日
- 商品コード
- 1683509
- カスタマイズ可能 お客様のご希望に応じて、既存データの加工や未掲載情報(例:国別セグメント)の追加などの対応が可能です。詳細はお問い合わせください。
- 適宜更新あり 本レポートは最新情報反映のため適宜更新し、内容構成変更を行う場合があります。ご検討の際はお問い合わせください。
- 翻訳ツール提供対象 PDF対応AI翻訳ツールの無料貸し出しサービスのご利用が可能です
概要
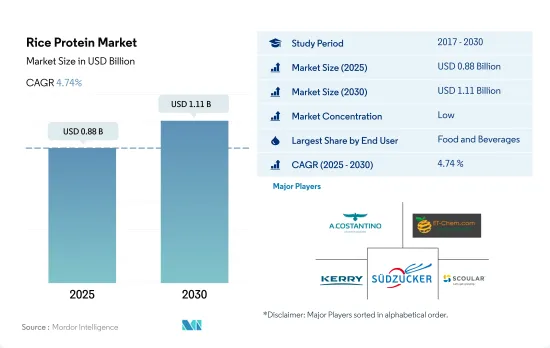
米たんぱく質の市場規模は2025年に8億8,000万米ドルと予測され、2030年には11億1,000万米ドルに達し、予測期間中(2025-2030年)にCAGR 4.74%で成長すると予測されています。
世界の乳糖不耐症人口の増加とたんぱく質消費ニーズの増加が米たんぱく質の使用を促進しています。
- 飲食品は、他のエンドユーザーセグメントの中で、米たんぱく質の最大の消費者であり続けた。このシェアは主に食肉と食肉代替食品が占めており、2022年の米タンパク消費量の82.82%を占めています。米たんぱく質は主に分離物の形で、肉のたんぱく質含有量に匹敵する能力があり、これがこのセグメントでの需要を牽引しています。米たんぱく質は、菜食主義者、グルテンフリー、高タンパク食品など、様々な顧客の要望に応えています。米たんぱく質は、チキンナゲット、ソーセージ、パテ、その他様々な製品の製造において、様々な濃度(3%、6%、9%、12%)で肉の増量剤として使用されています。
- スポーツ・パフォーマンス栄養サブセグメントが調査対象期間のセグメントを牽引し、予測期間中に最速のCAGR 5.99%を記録すると予測されています。2021年、世界のフィットネスクラブ産業の総市場規模は870億米ドルを超えました。世界中に20万以上のヘルス&フィットネスクラブがあります。米たんぱく質は体の代謝を強化し、糖質レベルを調整するのに役立ちます。米タンパクは脂肪の燃焼を助け、皮膚細胞の水分補給を改善するため、体のフィットネス維持に役立ちます。
- 乳糖不耐症の人々にとって、米タンパクは低アレルギー性で栄養価の高い代用品であるため、より身近な存在になりつつあります。2021年、世界の乳糖不耐症者の数は約68%で、米タンパクを含む代替タンパクへの高い需要につながりました。精米された米たんぱく質は人間の消化率が86~90%であるため、米ベースのフォーミュラは牛乳アレルギーの子供にとってより良い豆乳の代用品として使用されてきました。
たんぱく質補助食品への需要の増加と動物性たんぱく質への不耐性により、北米では近年米たんぱく質の市場が成長しています。
- アジア太平洋は、その大きな消費者基盤と膨大な生産量により、世界的に米たんぱく質の主要市場となっています。中国、インド、バングラデシュ、インドネシアはアジア太平洋の主要な米生産国です。同地域では、費用対効果の高さから米製品の消費量が多いです。2021年、中国は約2億1,284万トンの米を生産しました。しかし、同国は予測期間中、数量ベースでCAGR 4.8%と、最も速いペースで米の生産量を増やすと予測されています。
- 形態別では、分離物が2022年の推定数量前年比成長率1.82%でF&Bセグメントの市場をリードしています。地域別市場、特にAPACと欧州では、白米に比べ有機原料の玄米たんぱく質の需要が高まっています。しかし、糖尿病などの生活習慣病の増加に伴い、ホルモンバランスを崩す有機たんぱく質の需要が急増しました。フランスは欧州で糖尿病の有病率が最も高い(25.2%)。
- 北米ではプロテインサプリメントの需要が増加し、動物性たんぱく質に対する不耐症があるため、消費者は菜食主義に切り替えることが多くなり、米たんぱく質市場を牽引しています。菜食主義の人気が高まっているのは、アメリカ人が動物由来の食事が環境に与える悪影響を認識しているためです。このため、2022年の米たんぱく質市場の数量シェアは10.87%と急増しています。
- 中東は予測期間中、金額ベースで最高のCAGR 5.05%を記録すると予測されています。この成長はCOVID-19パンデミックの発生によるもので、そのため人々は栄養摂取量を増やすために強化製品や機能性製品でたんぱく質を摂取することを好むようになり、消費パターンが変化しました。
世界の米たんぱく質市場動向
植物性たんぱく質をベースとした食事にはいくつかの健康上の利点があるため、顧客はビーガン向けの製品に移行しています。
- 世界的に、消費者の食生活の嗜好は変化しています。特に欧州と北米の消費者の間で、乳製品と肉の代替品への嗜好が高まっています。2022年には、植物由来の牛乳が植物由来の食品売上全体の38%を占め、欧州がリードし、植物由来の肉が僅差でこれに続きます。この進化する動向は、フレキシタリアンやビーガンの消費者の数を押し上げ、メーカーが植物性たんぱく質分野でイノベーションを起こすための扉を開いています。
- 植物性たんぱく質代替食品の人気は、その栄養価によるもので、環境への影響、倫理、健康に対する懸念の高まりに起因します。炭水化物に比べて消化が遅いことで知られるたんぱく質は、少ないカロリーで満腹感を長時間持続させることで、体重管理に重要な役割を果たしています。新たな研究によると、2022年から2023年にかけて、世界で10億人以上が肥満とともに暮らしていることが明らかになりました。
- さらに、若年層のスポーツやフィットネス活動への関与の高まりと、健康上の利点を付加するために機能性成分で飲食品を強化する傾向の高まりが、植物性たんぱく質の需要を促進しています。2023年には、6歳以上の米国人(人口の約80%)が少なくとも1つのスポーツやフィットネス活動に参加し、過去最高の2億4,200万人に達し、2022年から2.2%増加しました。このアクティブなライフスタイルの変化が、植物性たんぱく質食品の需要を牽引しています。さらに、野菜と果物、全粒穀物、植物性蛋白質という3つの主要カテゴリーを強調し、食品ガイドを刷新したカナダ保健省のような政府の取り組みが、消費者の代替蛋白質に対する認識と需要を促進しています。
アジア太平洋地域が世界のコメ生産をリードし、他の主要国はこの地域からの輸入に頼っています。
- アジア太平洋は世界の米の大半を生産しています。この地域の主食です。中国、インド、バングラデシュ、インドネシアが主要な米生産国です。その他、インドネシア、バングラデシュ、ベトナム、タイ、ミャンマー、フィリピン、日本がアジアの主要米生産国です。2021年、中国は約2億1,284万トンのコメを生産しました。コメは世界の広大な地域で生産されているが、栽培に必要な物理的条件は特定の地域に限られています。
- アジアでは、年間1億3,000万ヘクタールのうち60%近くが灌漑で耕作されており、水の利用可能性に応じて、年に2~3作の単作が行われています。中国、インド、インドネシア、バングラデシュ、ベトナム、タイ、ミャンマー、フィリピン、パキスタン、ブラジルが米生産国の上位10カ国です。米の84%がわずか10カ国で収穫されているため、世界の多くの国は国内需要を満たすために輸入に頼っています。世界人口の増加が続く中、米は今後もカロリーと栄養の主要な供給源であり続けると思われます。
- コメはアジア、ラテンアメリカ、アフリカ、カリブ海諸国の多くで栄養の重要な一部とみなされており、世界で消費されるカロリーの5分の1以上を供給していると推定されています。コメは広く受け入れられているたんぱく質作物であるため、コメの生産とさまざまな製品への加工に影響を与えています。サハラ以南のアフリカは最大のコメ輸入地域であり、アジア全体の輸入量をわずかに上回り、世界の輸入量の31%以上を占めています。中東は依然として大きな世界輸入市場であり、この地域の米消費量の70%以上を占めています。
米たんぱく質産業の概要
米たんぱく質市場は断片化されており、上位5社で29.78%を占めています。この市場の主要企業は以下の通りです。A. Costantino & C. spa, ETChem, Kerry Group plc, Sudzucker AG and The Scoular Company(sorted alphabetically).
その他の特典
- エクセル形式の市場予測(ME)シート
- 3ヶ月のアナリストサポート
目次
第1章 エグゼクティブサマリーと主な調査結果
第2章 イントロダクション
- 調査の前提条件と市場定義
- 調査範囲
- 調査手法
第3章 主要産業動向
- エンドユーザー市場規模
- ベビーフードおよび乳児用調製粉乳
- ベーカリー
- 飲料
- 朝食用シリアル
- 調味料/ソース
- 菓子類
- 乳製品および乳製品代替製品
- 高齢者栄養・医療栄養
- 肉・鶏肉・魚介類および肉代替製品
- RTE/RTC食品
- スナック
- スポーツ/パフォーマンス栄養
- 動物飼料
- パーソナルケアと化粧品
- たんぱく質消費動向
- 植物
- 生産動向
- 植物
- 規制の枠組み
- 中国
- 米国
- バリューチェーンと流通チャネル分析
第4章 市場セグメンテーション
- 形態
- 濃縮物
- 単離液
- テクスチャード/加水分解物
- エンドユーザー
- 飲食品
- サブエンドユーザー別
- ベーカリー
- 飲料
- 肉・鶏肉・魚介類および代替肉製品
- スナック
- パーソナルケアと化粧品
- サプリメント
- サブエンドユーザー別
- 高齢者栄養および医療栄養
- スポーツ/パフォーマンス栄養
- 飲食品
- 地域別
- アフリカ
- 形態別
- エンドユーザー別
- 国別
- ナイジェリア
- 南アフリカ
- その他のアフリカ
- アジア太平洋
- 形態別
- エンドユーザー別
- 国別
- オーストラリア
- 中国
- インド
- インドネシア
- 日本
- マレーシア
- ニュージーランド
- 韓国
- タイ
- ベトナム
- その他アジア太平洋地域
- 欧州
- 形態別
- エンドユーザー別
- 国別
- ベルギー
- フランス
- ドイツ
- イタリア
- オランダ
- ロシア
- スペイン
- トルコ
- 英国
- その他欧州
- 中東
- 形態別
- エンドユーザー別
- 国別
- イラン
- サウジアラビア
- アラブ首長国連邦
- その他中東
- 北米
- 形態別
- エンドユーザー別
- 国別
- カナダ
- メキシコ
- 米国
- その他北米
- 南米
- 形態別
- エンドユーザー別
- 国別
- アルゼンチン
- ブラジル
- その他南米地域
- アフリカ
第5章 競合情勢
- 主要な戦略動向
- 市場シェア分析
- 企業情勢
- 企業プロファイル(世界レベルの概要、市場レベルの概要、主要事業セグメント、財務、従業員数、主要情報、市場ランク、市場シェア、製品・サービス、最近の動向分析を含む)
- A. Costantino & C. spa
- Axiom Foods Inc.
- ETChem
- Green Source Organics
- Kerry Group plc
- Sudzucker AG
- The Scoular Company
第6章 CEOへの主な戦略的質問
第7章 付録
- 世界概要
- 概要
- ファイブフォース分析フレームワーク
- 世界のバリューチェーン分析
- 市場力学(DROs)
- 情報源と参考文献
- 図表一覧
- 主要洞察
- データパック
- 用語集
目次
Product Code: 90232
The Rice Protein Market size is estimated at 0.88 billion USD in 2025, and is expected to reach 1.11 billion USD by 2030, growing at a CAGR of 4.74% during the forecast period (2025-2030).
Growing lactose-intolerant population, globally and increasing protein consumption need is driving the use of rice protein
- Food and beverages remained the largest consumer of rice protein, among other end-user segments. The share was majorly influenced by meat and meat alternatives, which accounted for 82.82% of the rice protein volume consumed in 2022. Rice protein, mainly in the isolates form, has the ability to match meat protein content, which is driving its demand in the segment. Rice protein meets a variety of customer demands, including vegan, gluten-free, and high-protein food products. Rice proteins were used as meat extenders at various concentrations (3%, 6%, 9%, and 12%) in creating chicken nuggets, sausages, patties, and various other products.
- The sports and performance nutrition sub-segment drove the segment in the studied period and is projected to register the fastest CAGR of 5.99% during the forecast period. In 2021, the total market size of the global fitness club industry was over USD 87 billion. There are over 200,000 health and fitness clubs around the world. Rice proteins help strengthen the body's metabolism and regulate sugar levels. It helps to maintain the fitness of the body as rice proteins help to burn fats and improves the hydration of the skin cell.
- People with lactose intolerance are becoming more familiar with the component because it is hypoallergenic and a nutritional substitute. In 2021, the number of lactose-intolerant people in the world was around 68%, which led to high demand for alternative proteins, including rice protein. Since polished rice protein has an 86-90% human digestion rate, rice-based formulas have been used as a better soy milk substitute for kids with cow's milk allergies.
With increasing demand for protein supplements and intolerance to animal proteins, North America witnessed a growth in the market for rice protein in recent years
- Asia-Pacific is the leading market for rice protein globally due to its large consumer base and huge production volume. China, India, Bangladesh, and Indonesia are some of the leading rice-producing countries in Asia-Pacific. Since the consumption of rice products is high in the region owing to its cost-effectiveness. In 2021, China produced around 212.84 million metric tons of rice. However, the country is projected to increase its rice production at the fastest rate, with a CAGR of 4.8%, by volume, during the forecast period.
- By form, isolates led the market in the F&B segment with an estimated Y-o-Y growth rate of 1.82% by volume in 2022. The demand for brown rice protein from organic sources is rising relative to white rice in the regional market, particularly in APAC and Europe. However, with the rising lifestyle health disorders, such as diabetes, the demand for hormonal disbalance organic protein surged. France had the highest prevalence of diabetes in Europe (25.2%).
- Due to the increasing demand for protein supplements and intolerance to animal proteins in North America, consumers are switching more frequently to vegan diets, driving the rice protein market. The increasing popularity of veganism can be attributed to Americans' awareness of the negative environmental impact of animal-based diets. This has surged the rice protein market with a volume share of 10.87% in 2022.
- The Middle East is projected to record the highest CAGR of 5.05%, by value, during the forecast period. The growth is due to the outbreak of the COVID-19 pandemic, due to which consumption patterns changed as people prefer having protein in fortified and functional products to increase their nutritional intake.
Global Rice Protein Market Trends
Due to several health benefits of plant protein-based diets, customers are moving toward vegan offerings
- Globally, consumers are shifting their dietary preferences. Notably, there is a growing preference for dairy and meat alternatives, especially among consumers in Europe and North America. In 2022, Europe led the way with plant-based milk accounting for 38% of total plant-based food sales, followed closely by plant-based meat. This evolving trend is boosting the number of flexitarian and vegan consumers and opening doors for manufacturers to innovate within the plant protein sector.
- The popularity of plant-based protein alternatives is due to their nutritional value and stems from growing concerns over environmental impact, ethics, and health. Proteins, known for their slower digestion compared to carbohydrates, play a crucial role in weight management by promoting a longer-lasting feeling of fullness with fewer calories. A new study reveals that over one billion people globally were living with obesity between 2022 and 2023.
- Moreover, the rising engagement of the younger population in sports and fitness activities, coupled with a growing trend of fortifying food and beverages with functional ingredients for added health benefits, is fueling the demand for plant-based proteins. In 2023, a record-high 242 million Americans aged 6 and older (nearly 80% of the population) participated in at least one sport or fitness activity, a 2.2% increase from 2022. This active lifestyle shift is driving the demand for plant-based protein food products. Furthermore, government initiatives, such as Canada's Health Ministry, which revamped its food guide, emphasizing three key categories: vegetables and fruits, whole grains, and plant-based proteins, are driving awareness and demand for alternative proteins among consumers.
Asia-Pacific leads global rice production, with other major countries relying on imports from this region
- Asia-Pacific produces the majority of the world's rice. It is the staple food in the region. China, India, Bangladesh, and Indonesia are some of the key leading rice-producing countries. Other top rice-producing countries in Asia include Indonesia, Bangladesh, Vietnam, Thailand, Myanmar, the Philippines, and Japan. In 2021, China produced around 212.84 million metric tons of rice. Although rice is produced over vast areas of the world, the physical requirements for growing it are limited to certain areas.
- In Asia, nearly 60% of the 130 million hectares devoted to rice production annually is irrigated, where rice is often grown in monoculture with two to three crops a year, depending upon water availability. China, India, Indonesia, Bangladesh, Vietnam, Thailand, Myanmar, the Philippines, Pakistan, and Brazil are the top 10 rice-producing countries. With 84% of rice being harvested in just ten countries, many countries globally rely on imports to meet domestic demand. As the global population continues to rise, rice will continue to be a major source of calories and nutrition.
- Rice is considered a vital part of nutrition in much of Asia, Latin America, Africa, and the Caribbean and is estimated to provide more than one-fifth of the calories consumed globally, impacting the production of rice and processing it into various products, as it is a widely accepted protein crop. Sub-Saharan Africa is the largest rice-importing region, slightly exceeding total imports by all of Asia and accounting for more than 31% of global imports. The Middle East remains a large global import market, accounting for more than 70% of the region's rice consumption.
Rice Protein Industry Overview
The Rice Protein Market is fragmented, with the top five companies occupying 29.78%. The major players in this market are A. Costantino & C. spa, ETChem, Kerry Group plc, Sudzucker AG and The Scoular Company (sorted alphabetically).
Additional Benefits:
- The market estimate (ME) sheet in Excel format
- 3 months of analyst support
TABLE OF CONTENTS
1 EXECUTIVE SUMMARY & KEY FINDINGS
2 INTRODUCTION
- 2.1 Study Assumptions & Market Definition
- 2.2 Scope of the Study
- 2.3 Research Methodology
3 KEY INDUSTRY TRENDS
- 3.1 End User Market Volume
- 3.1.1 Baby Food and Infant Formula
- 3.1.2 Bakery
- 3.1.3 Beverages
- 3.1.4 Breakfast Cereals
- 3.1.5 Condiments/Sauces
- 3.1.6 Confectionery
- 3.1.7 Dairy and Dairy Alternative Products
- 3.1.8 Elderly Nutrition and Medical Nutrition
- 3.1.9 Meat/Poultry/Seafood and Meat Alternative Products
- 3.1.10 RTE/RTC Food Products
- 3.1.11 Snacks
- 3.1.12 Sport/Performance Nutrition
- 3.1.13 Animal Feed
- 3.1.14 Personal Care and Cosmetics
- 3.2 Protein Consumption Trends
- 3.2.1 Plant
- 3.3 Production Trends
- 3.3.1 Plant
- 3.4 Regulatory Framework
- 3.4.1 China
- 3.4.2 United States
- 3.5 Value Chain & Distribution Channel Analysis
4 MARKET SEGMENTATION (includes market size in Value in USD and Volume, Forecasts up to 2030 and analysis of growth prospects)
- 4.1 Form
- 4.1.1 Concentrates
- 4.1.2 Isolates
- 4.1.3 Textured/Hydrolyzed
- 4.2 End User
- 4.2.1 Food and Beverages
- 4.2.1.1 By Sub End User
- 4.2.1.1.1 Bakery
- 4.2.1.1.2 Beverages
- 4.2.1.1.3 Meat/Poultry/Seafood and Meat Alternative Products
- 4.2.1.1.4 Snacks
- 4.2.2 Personal Care and Cosmetics
- 4.2.3 Supplements
- 4.2.3.1 By Sub End User
- 4.2.3.1.1 Elderly Nutrition and Medical Nutrition
- 4.2.3.1.2 Sport/Performance Nutrition
- 4.2.1 Food and Beverages
- 4.3 Region
- 4.3.1 Africa
- 4.3.1.1 By Form
- 4.3.1.2 By End User
- 4.3.1.3 By Country
- 4.3.1.3.1 Nigeria
- 4.3.1.3.2 South Africa
- 4.3.1.3.3 Rest of Africa
- 4.3.2 Asia-Pacific
- 4.3.2.1 By Form
- 4.3.2.2 By End User
- 4.3.2.3 By Country
- 4.3.2.3.1 Australia
- 4.3.2.3.2 China
- 4.3.2.3.3 India
- 4.3.2.3.4 Indonesia
- 4.3.2.3.5 Japan
- 4.3.2.3.6 Malaysia
- 4.3.2.3.7 New Zealand
- 4.3.2.3.8 South Korea
- 4.3.2.3.9 Thailand
- 4.3.2.3.10 Vietnam
- 4.3.2.3.11 Rest of Asia-Pacific
- 4.3.3 Europe
- 4.3.3.1 By Form
- 4.3.3.2 By End User
- 4.3.3.3 By Country
- 4.3.3.3.1 Belgium
- 4.3.3.3.2 France
- 4.3.3.3.3 Germany
- 4.3.3.3.4 Italy
- 4.3.3.3.5 Netherlands
- 4.3.3.3.6 Russia
- 4.3.3.3.7 Spain
- 4.3.3.3.8 Turkey
- 4.3.3.3.9 United Kingdom
- 4.3.3.3.10 Rest of Europe
- 4.3.4 Middle East
- 4.3.4.1 By Form
- 4.3.4.2 By End User
- 4.3.4.3 By Country
- 4.3.4.3.1 Iran
- 4.3.4.3.2 Saudi Arabia
- 4.3.4.3.3 United Arab Emirates
- 4.3.4.3.4 Rest of Middle East
- 4.3.5 North America
- 4.3.5.1 By Form
- 4.3.5.2 By End User
- 4.3.5.3 By Country
- 4.3.5.3.1 Canada
- 4.3.5.3.2 Mexico
- 4.3.5.3.3 United States
- 4.3.5.3.4 Rest of North America
- 4.3.6 South America
- 4.3.6.1 By Form
- 4.3.6.2 By End User
- 4.3.6.3 By Country
- 4.3.6.3.1 Argentina
- 4.3.6.3.2 Brazil
- 4.3.6.3.3 Rest of South America
- 4.3.1 Africa
5 COMPETITIVE LANDSCAPE
- 5.1 Key Strategic Moves
- 5.2 Market Share Analysis
- 5.3 Company Landscape
- 5.4 Company Profiles (includes Global Level Overview, Market Level Overview, Core Business Segments, Financials, Headcount, Key Information, Market Rank, Market Share, Products and Services, and Analysis of Recent Developments).
- 5.4.1 A. Costantino & C. spa
- 5.4.2 Axiom Foods Inc.
- 5.4.3 ETChem
- 5.4.4 Green Source Organics
- 5.4.5 Kerry Group plc
- 5.4.6 Sudzucker AG
- 5.4.7 The Scoular Company
6 KEY STRATEGIC QUESTIONS FOR PROTEIN INGREDIENTS INDUSTRY CEOS
7 APPENDIX
- 7.1 Global Overview
- 7.1.1 Overview
- 7.1.2 Porter's Five Forces Framework
- 7.1.3 Global Value Chain Analysis
- 7.1.4 Market Dynamics (DROs)
- 7.2 Sources & References
- 7.3 List of Tables & Figures
- 7.4 Primary Insights
- 7.5 Data Pack
- 7.6 Glossary of Terms
米たんぱく質:市場シェア分析、産業動向・統計、成長予測(2025年~2030年)
- 発行日
- 発行
- Mordor Intelligence
- ページ情報
- 英文 357 Pages
- 納期
- 2~3営業日


