
|
市場調査レポート
商品コード
1687353
アジア太平洋地域の乳製品:市場シェア分析、産業動向・統計、成長予測(2025~2030年)Asia-Pacific Dairy - Market Share Analysis, Industry Trends & Statistics, Growth Forecasts (2025 - 2030) |
||||||
カスタマイズ可能
適宜更新あり
|
|||||||
| アジア太平洋地域の乳製品:市場シェア分析、産業動向・統計、成長予測(2025~2030年) |
|
出版日: 2025年03月18日
発行: Mordor Intelligence
ページ情報: 英文 301 Pages
納期: 2~3営業日
|

全表示
- 概要
- 目次
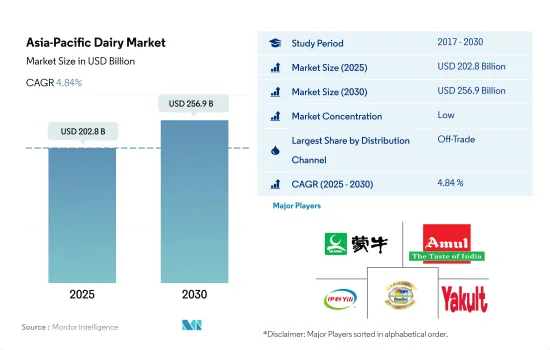
アジア太平洋地域の乳製品の市場規模は2025年に2,028億米ドルと推計され、2030年には2,569億米ドルに達し、予測期間中(2025~2030年)のCAGRは4.84%で成長すると予測されます。
スーパーマーケットやハイパーマーケットを通じた顕著な販売に牽引される流通チャネルの普及が成長を後押し
- 全体的な流通チャネルの中で、アジア太平洋地域の乳製品市場はオフトレードセグメントが支配的です。スーパーマーケットとハイパーマーケットがこのセグメントのシェアの大半を占めています。2022年には、スーパーマーケットとハイパーマーケットが金額シェアの57.9%を占めました。このセグメントが最も高いシェアを占めている主な理由は、Maruetsu、Aldi、Big Bazaar、Woolworths Group、Aeon Retailなどの人気チェーンが強力に浸透しており、輸入品と国産品の両方の乳製品を幅広く取り揃えていることです。
- 外食チャネルでは乳製品を使ったレシピの需要が高まっており、市場の成長をさらに後押ししています。オントレードチャネルにおける乳製品売上は、2021年の149億3,260万米ドルから2025年には171億420万米ドルの成長が見込まれます。このセグメントの成長は、レストランでの外食やテイクアウトの注文など、家庭外で調理された食品を消費することに起因しています。2021年時点で、インドの消費者は月に7回近く外食しており、回答者の80%以上が、外食には手頃な価格のカジュアルダイニングやクイックサービスレストランを好むと答えています。
- オンラインショッピングに関しては、アジア太平洋地域は世界最大級の市場です。そのため、販売チャネルとしてのオンライン小売店は、この地域全体で人気を集めています。2022年、アジア太平洋地域におけるeコマースを通じた乳製品の販売額は合計60億2,870万米ドルに達しましたが、2021年には56億1,830万米ドルでした。
- すべての乳製品の中で、牛乳が小売チャネル全体におけるシェアの大半を占めています。2022年には、牛乳はカテゴリー全体の55%を占め、ヨーグルトは金額シェア29.2%で2位につけています。
生乳の生産量の多さと高品質乳製品に対する消費者の嗜好の高まり
- インドと中国がこの地域の乳製品産業の主要市場であり、ニュージーランドと日本がこれに続きます。インドと中国は、2022年の乳製品販売量全体の65.25%を占めています。主な促進要因は、生乳の生産量の多さ、高品質の乳製品に対する消費者の嗜好の高まり、乳製品の製造と取引を促進するための適切な業界規制です。インド政府は、食品加工への自動ルートによる100%FDI(外国直接投資)を認めています。酪農産業は、インドの食品部門におけるFDI総額の約40%という大きな貢献をしています。また、インドは最大の生乳生産国のひとつであり、2021年には世界の生乳生産量の24%を占めました。
- 牛乳とヨーグルトは日本の乳製品市場の主要カテゴリーであり、2022年の乳製品売上高全体の83.18%を占めています。同国の市場成長は酪農場の高度化に起因しています。日本では、200頭以上の酪農家が2022年に10%増加しました。また、日本の酪農場の平均飼養頭数は103頭に達し、2021年から2022年にかけて前年比5%増となりました。中国はアジア太平洋で最も急成長している乳製品市場です。中国では、乳製品の販売額は予測期間中にCAGR 9.21%を記録し、2029年末には1,239億2,548万米ドルの市場規模に達すると予想されます。
- 無糖または減糖、低脂肪、牧草飼育、オーガニック製品などの健康的な乳製品への需要が、予測期間中の同地域の市場成長を促進すると予想されます。ニュージーランドのA2オーガニック認定牛乳サプライヤーであるAquila Sustainable Farming Ltd(ASF)は、2020年に6つのポートフォリオ農場のうち4つをA2オーガニックに転換しました。
アジア太平洋乳製品市場の動向
健康食品と飲食品への消費支出の増加と乳製品に関連する栄養上の利点が、日本、インド、オーストラリアなどの新興諸国における牛乳・乳製品の需要拡大を牽引
- 発展途上国における牛乳・乳製品の需要は、健康的な食品・飲食品に対する消費支出の増加と、さまざまなタイプの乳製品を摂取することに関連する栄養上の利点に対する意識の高まりによって伸びています。例えば、日本の生乳は、乳製品の輸入増加による日本の酪農産業の成長に伴い、今後数十年の間に普及すると予想されます。2021年には、日本の乳製品に対する1人当たりの年間支出は平均約39米ドルに達しました。
- 西洋文化の普及と食習慣の変化に伴い、インドではチーズの需要が増加しています。ファストフード業界からの需要も旺盛で、外資系外食企業が戦略的にプレゼンスを拡大しています。2021年、インドにはDomino's Pizzaの店舗が14,095店あり、2014年の830店から増加しています。
- ヨーグルトはインドではカードと呼ばれます。プレーンヨーグルトの消費量が多いのは、インド人が日常的に食事やリフレッシュメントの一部として消費しているからです。インドの一人当たりヨーグルト消費量は2023~2024年に5.2%増加しましたが、オーストラリアでは同期間に1.2%増加しました。アジアのアイスクリーム市場は成長しており、各ブランドは嗜好品と健康志向を中心とした成長動向を取り込んでいます。例えば、インドの1人当たりアイスクリーム消費量は2023~2024年に5.90%増加しました。飲食品業界における消費者支出の増加、新しいフレーバーの導入、衝動買いの増加、消費者の健康的なアイスクリーム製品に対する強い需要が、アイスクリームの消費を促進する主な要因の一部です。
アジア太平洋乳製品産業の概要
アジア太平洋乳製品市場は断片化されており、上位5社で22.28%を占めています。この市場の主要企業はChina Mengniu Dairy Company Ltd、Gujarat Co-operative Milk Marketing Federation Ltd、Inner Mongolia Yili Industrial Group、Karnataka Cooperative Milk Producers Federation Ltd、Yakult Honshaなどがあります。(順不同)
その他の特典
- エクセル形式の市場予測(ME)シート
- 3ヶ月間のアナリストサポート
目次
第1章 エグゼクティブサマリーと主な調査結果
第2章 レポートオファー
第3章 イントロダクション
- 調査の前提条件と市場定義
- 調査範囲
- 調査手法
第4章 主要産業動向
- 一人当たりの消費量
- 原材料/商品生産量
- バター
- チーズ
- 牛乳
- 規制の枠組み
- オーストラリア
- 中国
- インド
- 日本
- バリューチェーンと流通チャネル分析
第5章 市場セグメンテーション
- カテゴリー別
- バター
- 製品タイプ別
- 発酵バター
- 非発酵バター
- チーズ
- 製品タイプ別
- ナチュラルチーズ
- プロセスチーズ
- クリーム
- 製品タイプ別
- ダブルクリーム
- シングルクリーム
- ホイップクリーム
- その他
- 乳製品デザート
- 製品タイプ別
- チーズケーキ
- フローズンデザート
- アイスクリーム
- ムース
- その他
- 牛乳
- 製品タイプ別
- コンデンスミルク
- フレーバーミルク
- フレッシュミルク
- 粉ミルク
- UHTミルク
- サワーミルクドリンク
- ヨーグルト
- 製品タイプ別
- フレーバーヨーグルト
- ノンフレーバーヨーグルト
- バター
- 流通チャネル別
- オフトレード
- コンビニエンスストア
- オンライン小売
- 専門小売店
- スーパーマーケット・ハイパーマーケット
- その他(倉庫クラブ、ガソリンスタンドなど)
- オントレード
- オフトレード
- 国別
- オーストラリア
- 中国
- インド
- インドネシア
- 日本
- マレーシア
- ニュージーランド
- パキスタン
- 韓国
- その他アジア太平洋地域
第6章 競合情勢
- 主要な戦略動向
- 市場シェア分析
- 企業情勢
- 企業プロファイル.
- China Mengniu Dairy Company Ltd
- Dodla Dairy Ltd
- Fonterra Co-operative Group Limited
- Gujarat Co-operative Milk Marketing Federation Ltd
- Hatsun Agro Product Ltd
- Inner Mongolia Yili Industrial Group Co. Ltd
- Karnataka Cooperative Milk Producers Federation Ltd
- Meiji Dairies Corporation
- Nestle SA
- Yakult Honsha Co. Ltd
第7章 CEOへの主な戦略的質問
第8章 付録
- 世界概要
- 概要
- ファイブフォース分析フレームワーク
- 世界のバリューチェーン分析
- 市場力学(DROs)
- 情報源と参考文献
- 図表一覧
- 主要洞察
- データパック
- 用語集
The Asia-Pacific Dairy Market size is estimated at 202.8 billion USD in 2025, and is expected to reach 256.9 billion USD by 2030, growing at a CAGR of 4.84% during the forecast period (2025-2030).
Widespread adoption of distribution channels, led by remarkable sales through supermarkets and hypermarkets is propelling the growth
- Among overall distribution channels, the Asia-Pacific dairy market is dominated by the off-trade segment. Supermarkets and hypermarkets accounted for most of the share in the off-trade segment. In 2022, supermarkets and hypermarkets accounted for 57.9% of the value share. The major reason behind the segment holding the highest share is the strong penetration of popular chains such as Maruetsu, Aldi, Big Bazaar, Woolworths Group, and Aeon Retail, which provide a wide selection of dairy products that are both imported and made locally.
- There is an increasing demand for dairy-based recipes from foodservice channels, further boosting the market growth. Dairy sales in the on-trade channel are anticipated to grow by USD 17,104.2 million in 2025, up from USD 14,932.6 million in 2021. The growth in the segment is attributed to consuming food prepared away from home, whether while eating out at a restaurant or ordering takeout. As of 2021, Indian consumers were eating out nearly seven times a month, and over 80% of the respondents stated that they preferred affordable casual dining options and quick-service restaurants to eat out, while cafes, desserts, and ice-cream parlors were the most frequented.
- When it comes to online shopping, the Asia-Pacific region is one of the largest markets in the world. Thus, online retail stores as a sales channel are gaining popularity across the region. In 2022, the sales value of dairy products through e-commerce in the Asia-Pacific region reached a total of USD 6028.7 million, while it was USD 5618.3 million in 2021.
- Among all dairy products, milk accounted for the majority of share in overall retail channels. In 2022, milk accounted for 55% of the total category, and yogurt stood in second place with 29.2% of the value share.
High production of raw milk and rising consumer preference for quality dairy products are key market drivers in the region
- India and China are identified as the region's major markets for the dairy industry, followed by New Zealand and Japan. India and China collectively accounted for a 65.25% share of the overall dairy products volume sales across the region in 2022. The key driving factors are the high production of raw milk, rising consumer preference for quality dairy products, and adequate industry regulation to facilitate the manufacturing and trading of dairy products. The Government of India has permitted 100% FDI (Foreign Direct Investment) through an automatic route for food processing. The dairy industry accounts for a substantial FDI contribution of about 40% of the total FDIs in the Indian food sector. Also, India is one of the largest milk-producing countries, contributing 24% of global milk production in 2021.
- Milk and yogurt are the leading categories in the Japanese dairy market and collectively accounted for an 83.18% share of the overall dairy sales in 2022. The market growth in the country is attributed to the advancement of dairy farms. In Japan, dairy farms with 200 or more cows increased by 10% in 2022. Also, the average yard population of Japanese dairy farms reached 103 heads, a 5% Y-o-Y growth from 2021 to 2022. China is identified as the fastest-growing dairy market in Asia-Pacific. In China, dairy products' sales value is anticipated to register a CAGR of 9.21% during the forecast period to reach a market value of USD 123,925.48 million by the end of 2029.
- Demand for healthy dairy variants such as no or reduced sugar, low-fat content, grass-fed, and organic products is anticipated to drive market growth in the region during the forecast period. Aquila Sustainable Farming Ltd (ASF), a supplier of certified A2 organic milk in New Zealand, converted four of its six portfolio farms to A2 organic in 2020.
Asia-Pacific Dairy Market Trends
Increasing consumer spending on healthy foods and beverages, along with the nutritional benefits associated with dairy products, is driving the growing demand for milk and milk products in developing countries like Japan, India, and Australia
- Demand for milk and milk products in developing countries is growing with increasing consumer spending on healthy food and beverage products and rising awareness of the nutritional benefits associated with consuming different types of dairy products. For example, fresh milk in Japan is expected to become popular over the coming decades in line with growth in the Japanese dairy farming industry owing to the increased import of dairy products. In 2021, Japan's annual per capita expenditure on milk products amounted to around USD 39 on average.
- With the growing adoption of Western culture and changing food habits, the demand for cheese has increased in India. There is strong demand from the fast-food industry as well, with foreign foodservice operators strategically expanding their presence. In 2021, India had 14,095 Domino's Pizza outlets, which had grown from 830 in 2014.
- Yogurt is referred to as curd in India. There is a high consumption of plain yogurt as it is typically consumed as part of a meal or refreshment by the Indian population in their daily routine. The per capita yogurt consumption in India increased by 5.2% in 2023-2024, whereas in Australia, it rose by 1.2% over the same period. The ice cream market in Asia is growing, with brands tapping into growing trends revolving around indulgence and a health perspective. For example, per capita consumption of ice cream in India grew by 5.90% in 2023-2024. Rising consumer expenditure in the food and beverage industry, the introduction of new flavors, increasing impulse purchasing, and strong demand for healthy ice cream products among consumers are some of the primary factors driving the consumption of ice cream.
Asia-Pacific Dairy Industry Overview
The Asia-Pacific Dairy Market is fragmented, with the top five companies occupying 22.28%. The major players in this market are China Mengniu Dairy Company Ltd, Gujarat Co-operative Milk Marketing Federation Ltd, Inner Mongolia Yili Industrial Group Co. Ltd, Karnataka Cooperative Milk Producers Federation Ltd and Yakult Honsha Co. Ltd (sorted alphabetically).
Additional Benefits:
- The market estimate (ME) sheet in Excel format
- 3 months of analyst support
TABLE OF CONTENTS
1 EXECUTIVE SUMMARY & KEY FINDINGS
2 REPORT OFFERS
3 INTRODUCTION
- 3.1 Study Assumptions & Market Definition
- 3.2 Scope of the Study
- 3.3 Research Methodology
4 KEY INDUSTRY TRENDS
- 4.1 Per Capita Consumption
- 4.2 Raw Material/commodity Production
- 4.2.1 Butter
- 4.2.2 Cheese
- 4.2.3 Milk
- 4.3 Regulatory Framework
- 4.3.1 Australia
- 4.3.2 China
- 4.3.3 India
- 4.3.4 Japan
- 4.4 Value Chain & Distribution Channel Analysis
5 MARKET SEGMENTATION (includes market size in Value in USD and Volume, Forecasts up to 2030 and analysis of growth prospects)
- 5.1 Category
- 5.1.1 Butter
- 5.1.1.1 By Product Type
- 5.1.1.1.1 Cultured Butter
- 5.1.1.1.2 Uncultured Butter
- 5.1.2 Cheese
- 5.1.2.1 By Product Type
- 5.1.2.1.1 Natural Cheese
- 5.1.2.1.2 Processed Cheese
- 5.1.3 Cream
- 5.1.3.1 By Product Type
- 5.1.3.1.1 Double Cream
- 5.1.3.1.2 Single Cream
- 5.1.3.1.3 Whipping Cream
- 5.1.3.1.4 Others
- 5.1.4 Dairy Desserts
- 5.1.4.1 By Product Type
- 5.1.4.1.1 Cheesecakes
- 5.1.4.1.2 Frozen Desserts
- 5.1.4.1.3 Ice Cream
- 5.1.4.1.4 Mousses
- 5.1.4.1.5 Others
- 5.1.5 Milk
- 5.1.5.1 By Product Type
- 5.1.5.1.1 Condensed milk
- 5.1.5.1.2 Flavored Milk
- 5.1.5.1.3 Fresh Milk
- 5.1.5.1.4 Powdered Milk
- 5.1.5.1.5 UHT Milk
- 5.1.6 Sour Milk Drinks
- 5.1.7 Yogurt
- 5.1.7.1 By Product Type
- 5.1.7.1.1 Flavored Yogurt
- 5.1.7.1.2 Unflavored Yogurt
- 5.1.1 Butter
- 5.2 Distribution Channel
- 5.2.1 Off-Trade
- 5.2.1.1 Convenience Stores
- 5.2.1.2 Online Retail
- 5.2.1.3 Specialist Retailers
- 5.2.1.4 Supermarkets and Hypermarkets
- 5.2.1.5 Others (Warehouse clubs, gas stations, etc.)
- 5.2.2 On-Trade
- 5.2.1 Off-Trade
- 5.3 Country
- 5.3.1 Australia
- 5.3.2 China
- 5.3.3 India
- 5.3.4 Indonesia
- 5.3.5 Japan
- 5.3.6 Malaysia
- 5.3.7 New Zealand
- 5.3.8 Pakistan
- 5.3.9 South Korea
- 5.3.10 Rest of Asia Pacific
6 COMPETITIVE LANDSCAPE
- 6.1 Key Strategic Moves
- 6.2 Market Share Analysis
- 6.3 Company Landscape
- 6.4 Company Profiles (includes Global Level Overview, Market Level Overview, Core Business Segments, Financials, Headcount, Key Information, Market Rank, Market Share, Products and Services, and Analysis of Recent Developments).
- 6.4.1 China Mengniu Dairy Company Ltd
- 6.4.2 Dodla Dairy Ltd
- 6.4.3 Fonterra Co-operative Group Limited
- 6.4.4 Gujarat Co-operative Milk Marketing Federation Ltd
- 6.4.5 Hatsun Agro Product Ltd
- 6.4.6 Inner Mongolia Yili Industrial Group Co. Ltd
- 6.4.7 Karnataka Cooperative Milk Producers Federation Ltd
- 6.4.8 Meiji Dairies Corporation
- 6.4.9 Nestle SA
- 6.4.10 Yakult Honsha Co. Ltd
7 KEY STRATEGIC QUESTIONS FOR DAIRY AND DAIRY ALTERNATIVE CEOS
8 APPENDIX
- 8.1 Global Overview
- 8.1.1 Overview
- 8.1.2 Porter's Five Forces Framework
- 8.1.3 Global Value Chain Analysis
- 8.1.4 Market Dynamics (DROs)
- 8.2 Sources & References
- 8.3 List of Tables & Figures
- 8.4 Primary Insights
- 8.5 Data Pack
- 8.6 Glossary of Terms

