
|
市場調査レポート
商品コード
1685855
アジア太平洋地域のエナジードリンク:市場シェア分析、産業動向・統計、成長予測(2025年~2030年)Asia-Pacific Energy Drinks - Market Share Analysis, Industry Trends & Statistics, Growth Forecasts (2025 - 2030) |
||||||
カスタマイズ可能
適宜更新あり
|
|||||||
| アジア太平洋地域のエナジードリンク:市場シェア分析、産業動向・統計、成長予測(2025年~2030年) |
|
出版日: 2025年03月18日
発行: Mordor Intelligence
ページ情報: 英文 254 Pages
納期: 2~3営業日
|

全表示
- 概要
- 目次
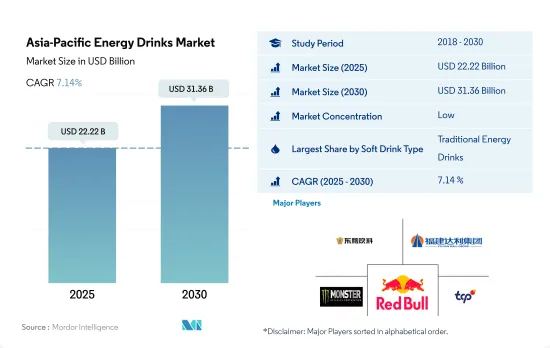
アジア太平洋地域のエナジードリンク市場規模は、2025年に222億2,000万米ドルと推定され、2030年には313億6,000万米ドルに達すると予測され、予測期間中(2025~2030年)のCAGRは7.14%で成長すると予測されます。
消費者は炭酸飲料に代わる選択肢を求め、天然/有機飲料への需要が高まっています。
- アジア太平洋地域では、特にミレニアル世代とZ世代を中心にエナジードリンクの人気が急上昇しています。この動向は、より健康的な水分補給を求める消費者の欲求に後押しされ、水に液体増強剤を入れることを選ぶ消費者が増えています。特筆すべきは、グルテンフリー、シュガーフリー、オーガニックといったクリーンラベルの属性が、スポーツ愛好家の選択を左右していることです。その結果、アジア太平洋地域市場におけるエナジードリンクの販売額は、2021年から2023年にかけて13.18%の堅調な伸びを示しました。
- 従来、カフェインの王座はコーヒーが占めていたが、現在ではエナジードリンクが、特に若年層の間でコーヒーに取って代わられています。エナジードリンクは、そのカフェイン含有量のおかげでエネルギーが高まり、頭が冴え、身体能力が向上するといったメリットを売り物にしています。市場はまた、より健康的な食品選択への広範なシフトを反映して、クリーン・ラベルの製品に対する需要の急増も目の当たりにしています。注目すべきは、2022年にはタイ人の12%とベトナム人の18%がエナジードリンクを週に複数回摂取していることです。さらに、中国、インド、オーストラリアのような国々では、炭酸入り清涼飲料から脱却し、代わりに無糖、低カロリー、天然/有機エナジードリンクが支持されています。
- エナジードリンク分野では、アジア太平洋地域のエナジードリンク市場において、天然/有機エナジードリンクがトップランナーとして浮上しています。2024年から2030年までのCAGRは8.67%と予測されています。この成長は、従来の飲料製造の潜在的危険性に対する消費者の意識の高まりと、オーガニック製品の利点に対する評価の高まりが後押ししています。
エナジードリンク市場は、糖分と天然成分を減らした製品への需要の高まりによって成長する見通しです。
- 2021年から2023年にかけて、アジア太平洋地域のエナジードリンク市場は金額ベースで13.18%の堅調な伸びを示しました。この売上高の急増は、都市化、可処分所得の増加、消費者の健康志向の高まりなどの要因によるものと考えられます。エナジードリンクは、主にパフォーマンス、持久力、覚醒度を高める効果があると認識されているため、この地域で広く消費されています。
- アジア太平洋地域のエナジードリンク市場を独占しているのは中国で、最も高い消費水準を誇っています。2023年、中国のエナジードリンク売上は2020年比で30.42%急増しました。同地域では、特に健康志向の消費者の間で、糖分が少なく天然成分を含むエナジードリンクへの動向が高まっています。注目すべきは、コーヒー豆からの抽出物のような天然抽出物を取り入れたブランドがこの地域で人気を集めていることです。例えば、2023年にMonster Energyが160mgのカフェインを含む無糖の商品を発表しました。同様に、2022年にはコカ・コーラ社が、天然フレーバーとカフェインを配合した低カロリー・砂糖不使用のエナジードリンク、フレスカエナジーを発売しました。
- アジア太平洋地域諸国の中では、ベトナムが急成長市場として際立っています。2023年から2030年にかけて、金額ベースでCAGR 6.41%を記録すると予測されています。同国では、味の嗜好が進化し、多様な商品が提供されているため、エナジードリンクの需要が高まっています。2023年には、ベトナムの消費者の19%以上がエナジードリンクを週に複数回消費すると回答し、10%以上が週に1回の消費頻度を示しました。
アジア太平洋地域のエナジードリンク市場動向
特に若い世代を中心に、即効性のあるエネルギーと覚醒への要求が高まり、売上を押し上げる
- アジア太平洋地域では、個人の身体的・精神的能力を向上させる決定的な利点があることから、エナジードリンクの消費が伸びています。
- エナジードリンクはカフェイン以外の刺激物質で構成されているため、消費者は他の炭酸飲料やカフェイン入り飲料よりも優れた効果的な代替品としてその消費に傾倒しており、これがメーカーにこの分野での技術革新を促しています。
- エナジードリンクは通常、発展途上国よりも先進国の方が高価であるが、これは原料の入手可能性やコスト、輸送コスト、そして最も重要な税制などの要因に大きく影響されています。
- アジア太平洋地域の主要ブランドは、糖分、塩分、脂肪分の削減に向けた改良努力を続けており、消費者の意識とより健康的な製品に対する需要が急速に高まっています。
アジア太平洋地域のエナジードリンク産業の概要
アジア太平洋地域のエナジードリンク市場は断片化されており、上位5社で23.44%を占めています。この市場の主要企業は以下の通り。 Eastroc Beverage(Group), Fujian Dali Food Group, Monster Beverage Corporation, Red Bull GmbH and T.C. Pharmaceutical Industries Company Limited(sorted alphabetically).
その他の特典
- エクセル形式の市場予測(ME)シート
- 3ヶ月のアナリストサポート
目次
第1章 エグゼクティブサマリーと主な調査結果
第2章 レポートのオファー
第3章 イントロダクション
- 調査の前提条件と市場定義
- 調査範囲
- 調査手法
第4章 主要産業動向
- 消費者の購買行動
- イノベーション
- ブランドシェア分析
- 規制の枠組み
第5章 市場セグメンテーション
- ソフトドリンクタイプ
- エナジーショット
- ナチュラル/オーガニックエナジードリンク
- 無糖または低カロリーのエナジードリンク
- 従来のエナジードリンク
- その他のエナジードリンク
- 包装タイプ
- ガラス瓶
- 金属缶
- ペットボトル
- 流通チャネル
- オフトレード
- コンビニエンスストア
- オンライン小売
- スーパーマーケット/ハイパーマーケット
- その他
- オントレード
- オフトレード
- 国名
- オーストラリア
- 中国
- インド
- インドネシア
- 日本
- マレーシア
- 韓国
- タイ
- ベトナム
- その他アジア太平洋地域
第6章 競合情勢
- 主要な戦略動向
- 市場シェア分析
- 企業情勢
- 企業プロファイル
- Aje Group
- Carabao Group Public Company Limited
- Congo Brands
- Eastroc Beverage(Group)Co., Ltd.
- Fujian Dali Food Group Co., Ltd.
- Hell Energy Magyarorszag Korlatolt Felelossegu Tarsasag
- Henan Zhongwo Beverage Co Ltd
- Monster Beverage Corporation
- Osotspa Public Company Limited
- PepsiCo, Inc.
- Red Bull GmbH
- T.C. Pharmaceutical Industries Company Limited
- Taisho Pharmaceutical Holdings Co., Ltd.
- The Coca-Cola Company
第7章 CEOへの主な戦略的質問
第8章 付録
- 世界概要
- 概要
- ファイブフォース分析フレームワーク
- 市場力学(DROs)
- 情報源と参考文献
- 図表一覧
- 主要洞察
- データパック
- 用語集
The Asia-Pacific Energy Drinks Market size is estimated at 22.22 billion USD in 2025, and is expected to reach 31.36 billion USD by 2030, growing at a CAGR of 7.14% during the forecast period (2025-2030).
Consumers are looking for alternative options of carbonated beverages with increasing demand for natural/organic drinks
- Asia-Pacific has witnessed a surge in the popularity of energy drinks, particularly among the millennial and Gen Z demographics. This trend is fueled by a desire for healthier hydration, with consumers increasingly opting for liquid enhancers in their water. Notably, clean-label attributes such as gluten-free, sugar-free, and organic are swaying the choices of sports enthusiasts. Consequently, the sales value of energy drinks in Asia-Pacific market saw a robust 13.18% growth from 2021 to 2023.
- Traditionally, coffee held the caffeine crown, but energy drinks have now dethroned it, especially among the younger population. Energy drinks tout benefits like heightened energy, mental acuity, and physical performance thanks to their caffeine content. The market is also witnessing a surge in demand for clean-label offerings, reflecting a broader shift toward healthier food choices. Notably, in 2022, 12% of Thais and 18% of Vietnamese were consuming energy drinks multiple times a week. Moreover, countries like China, India, and Australia are pivoting away from carbonated soft drinks, favoring sugar-free, low-calorie, and natural/organic energy drinks instead.
- Within the energy drinks segment, the natural/organic variant is emerging as the frontrunner in the Asia-Pacific energy drinks market. It is projected to witness a robust value CAGR of 8.67% from 2024 to 2030. This growth is propelled by rising consumer awareness about the potential hazards of conventional beverage production and a growing appreciation for the benefits of organic products.
The market for energy drinks is poised for growth, driven by a rising demand for products with reduced sugar content and natural ingredients
- From 2021 to 2023, the Asia-Pacific energy drinks market witnessed a robust 13.18% growth in sales by value. This surge in sales can be attributed to factors like urbanization, increasing disposable incomes, and a rising focus on health among consumers. Energy drinks are popularly consumed in the region, primarily for their perceived benefits in enhancing performance, endurance, and alertness.
- China dominates the energy drinks market in Asia-Pacific, boasting the highest consumption levels. In 2023, China saw a remarkable 30.42% surge in energy drink sales compared to 2020. The trend toward energy drinks with lower sugar content and natural ingredients is gaining traction in the region, especially among health-conscious consumers. Notably, brands incorporating natural extracts, like those from coffee beans, are gaining popularity in the region. For instance, in 2023, Monster Energy unveiled a sugar-free variant packing 160 mg of caffeine. Similarly, in 2022, The Coca-Cola Company introduced Fresca Energy, a low-calorie, sugar-free energy drink infused with natural flavors and caffeine.
- Among the Asia-Pacific countries, Vietnam stands out as a rapidly growing market. It is projected to register a CAGR of 6.41% in terms of value from 2023 to 2030. The country's evolving flavor preferences and diverse range of offerings have fueled the demand for energy drinks. In 2023, over 19% of Vietnamese consumers reported consuming energy drinks multiple times a week, while more than 10% indicated a weekly consumption frequency.
Asia-Pacific Energy Drinks Market Trends
Growing requirements for instant energy and alertness, especially among the younger generation boost the sales
- In the Asia Pacific region, consumption of energy drinks has been observed to be growing owing to their definitive advantages in developing an individual's physical and mental abilities.
- As energy drink consists of stimulants other than caffeine, consumers have been inclined towards its consumption as it becomes a better and an an effective alternative than other carbonated or caffeinated beverages, and this has urged the manufacturers to innovate in this arena.
- Energy drinks are typically more expensive in developed countries than developing countries and that is majorly influenced by factors like factors such as availability and cost of ingredients, cost of transportation and most importantly tax slabs.
- Major brands across the region are continuing to double down on their reformulation efforts across sugar, salt and fat reduction led to a rapid increase in consumer awareness and demand for healthier products.
Asia-Pacific Energy Drinks Industry Overview
The Asia-Pacific Energy Drinks Market is fragmented, with the top five companies occupying 23.44%. The major players in this market are Eastroc Beverage(Group) Co., Ltd., Fujian Dali Food Group Co., Ltd., Monster Beverage Corporation, Red Bull GmbH and T.C. Pharmaceutical Industries Company Limited (sorted alphabetically).
Additional Benefits:
- The market estimate (ME) sheet in Excel format
- 3 months of analyst support
TABLE OF CONTENTS
1 EXECUTIVE SUMMARY & KEY FINDINGS
2 REPORT OFFERS
3 INTRODUCTION
- 3.1 Study Assumptions & Market Definition
- 3.2 Scope of the Study
- 3.3 Research Methodology
4 KEY INDUSTRY TRENDS
- 4.1 Consumer Buying Behaviour
- 4.2 Innovations
- 4.3 Brand Share Analysis
- 4.4 Regulatory Framework
5 MARKET SEGMENTATION (includes market size in Value in USD and Volume, Forecasts up to 2030 and analysis of growth prospects)
- 5.1 Soft Drink Type
- 5.1.1 Energy Shots
- 5.1.2 Natural/Organic Energy Drinks
- 5.1.3 Sugar-free or Low-calories Energy Drinks
- 5.1.4 Traditional Energy Drinks
- 5.1.5 Other Energy Drinks
- 5.2 Packaging Type
- 5.2.1 Glass Bottles
- 5.2.2 Metal Can
- 5.2.3 PET Bottles
- 5.3 Distribution Channel
- 5.3.1 Off-trade
- 5.3.1.1 Convenience Stores
- 5.3.1.2 Online Retail
- 5.3.1.3 Supermarket/Hypermarket
- 5.3.1.4 Others
- 5.3.2 On-trade
- 5.3.1 Off-trade
- 5.4 Country
- 5.4.1 Australia
- 5.4.2 China
- 5.4.3 India
- 5.4.4 Indonesia
- 5.4.5 Japan
- 5.4.6 Malaysia
- 5.4.7 South Korea
- 5.4.8 Thailand
- 5.4.9 Vietnam
- 5.4.10 Rest of Asia-Pacific
6 COMPETITIVE LANDSCAPE
- 6.1 Key Strategic Moves
- 6.2 Market Share Analysis
- 6.3 Company Landscape
- 6.4 Company Profiles
- 6.4.1 Aje Group
- 6.4.2 Carabao Group Public Company Limited
- 6.4.3 Congo Brands
- 6.4.4 Eastroc Beverage(Group) Co., Ltd.
- 6.4.5 Fujian Dali Food Group Co., Ltd.
- 6.4.6 Hell Energy Magyarorszag Korlatolt Felelossegu Tarsasag
- 6.4.7 Henan Zhongwo Beverage Co Ltd
- 6.4.8 Monster Beverage Corporation
- 6.4.9 Osotspa Public Company Limited
- 6.4.10 PepsiCo, Inc.
- 6.4.11 Red Bull GmbH
- 6.4.12 T.C. Pharmaceutical Industries Company Limited
- 6.4.13 Taisho Pharmaceutical Holdings Co., Ltd.
- 6.4.14 The Coca-Cola Company
7 KEY STRATEGIC QUESTIONS FOR SOFT DRINK CEOS
8 APPENDIX
- 8.1 Global Overview
- 8.1.1 Overview
- 8.1.2 Porter's Five Forces Framework
- 8.1.3 Market Dynamics (DROs)
- 8.2 Sources & References
- 8.3 List of Tables & Figures
- 8.4 Primary Insights
- 8.5 Data Pack
- 8.6 Glossary of Terms
