
|
市場調査レポート
商品コード
1685848
米国のエナジードリンク:市場シェア分析、産業動向・統計、成長予測(2025年~2030年)United States Energy Drinks - Market Share Analysis, Industry Trends & Statistics, Growth Forecasts (2025 - 2030) |
||||||
カスタマイズ可能
適宜更新あり
|
|||||||
| 米国のエナジードリンク:市場シェア分析、産業動向・統計、成長予測(2025年~2030年) |
|
出版日: 2025年03月18日
発行: Mordor Intelligence
ページ情報: 英文 202 Pages
納期: 2~3営業日
|

全表示
- 概要
- 目次
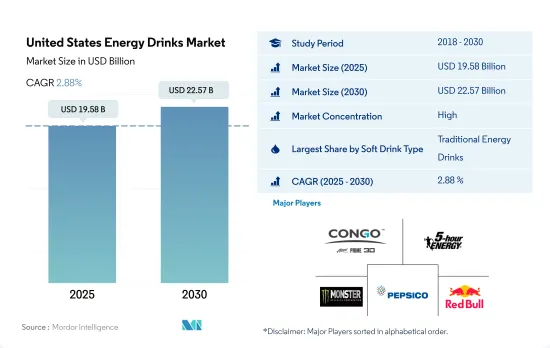
米国のエナジードリンク市場規模は2025年に195億8,000万米ドルと推定され、2030年には225億7,000万米ドルに達すると予測され、予測期間中(2025~2030年)のCAGRは2.88%で成長する見込みです。
斬新なフレーバーと成分の組み合わせによる従来のエナジードリンクの入手のしやすさが市場の成長を支えています。
- エナジードリンクは米国の消費者、特にミレニアル世代とZ世代に急速に普及しました。身体的・認知的パフォーマンスを向上させる潜在的なエネルギー・ブースターとしてのエナジードリンクに対する需要の高まりが、市場の成長を形成しています。さらに、グルテンフリー、シュガーフリー、オーガニックといった特定のクリーンラベルの謳い文句が、スポーツに興じる消費者に影響を与えています。その結果、米国におけるエナジードリンクの販売額は、2023年には2021年比で5.42%の成長率を記録しました。
- エナジードリンク市場では、従来のエナジードリンクが大きなシェアを占めています。2024年から2028年にかけては、金額ベースで8.38%の成長率を記録すると予想されています。この成長を後押ししているのは、従来のエナジードリンクが斬新なフレーバーと成分の組み合わせで入手しやすくなっていることであり、これらのエナジードリンクは単体製品として、あるいはジュースやスピリッツと組み合わせてそれぞれモクテルやカクテルの形で入手できます。2023年には、米国の18~29歳の消費者の35%以上が、エナジードリンクを定期的に飲むと回答しています。
- エナジードリンク市場の中で、米国で最も高い成長を示しているのはナチュラル/オーガニック・セグメントです。このセグメントは、2024~2030年に金額ベースでCAGR 4.38%を記録すると予測されています。米国のメーカーは、天然、天然カフェイン、植物由来のエナジードリンクのラインを導入することで、この動向に乗じています。この分野の注目すべきブランドには、Reign Storm、Zoa、Proper Wildなどがあります。
米国のエナジードリンク市場動向
低カロリー飲料を求める健康志向の消費者動向の高まりが同分野の売上を牽引
- エナジードリンクは、カフェイン含有量が高いため、精神的な覚醒度や身体的なパフォーマンスを高めながらエネルギーを増加させると主張しています。米国では、2022年には人口の85%が毎日カフェイン入り飲料を飲んでいます。
- 近年、エネルギー飲料の消費は、無糖でカロリーフリーの飲料と相まって、即席の水分補給を好む消費者の嗜好により、着実に増加しています。エナジードリンクの世界の一人当たり消費量を見ると、米国が2023年の平均消費量(リットル)の28.4%を占めて第1位となっています。
- パッケージは、エナジードリンクにとって極めて重要な特性のひとつであり、アメリカの消費者の39%が、2023年の購買決定においてパッケージの環境への影響を重視すると回答しています。
- エナジードリンクの平均販売価格は、主に砂糖、カフェイン、香料、その他の添加物を含む原材料価格の上下によって左右されます。ほとんどのエナジードリンクは高価で、2023年現在、エナジードリンクの平均コストは16オンス缶で2.50~5米ドルです。
米国のエナジードリンク産業概要
米国のエナジードリンク市場はかなり統合されており、上位5社で67.99%を占めています。この市場の主要企業は以下の通り。 Congo Brands, Living Essentials, LLC, Monster Beverage Corporation, PepsiCo, Inc. and Red Bull GmbH(sorted alphabetically).
その他の特典
- エクセル形式の市場予測(ME)シート
- 3ヶ月のアナリストサポート
目次
第1章 エグゼクティブサマリーと主な調査結果
第2章 レポートのオファー
第3章 イントロダクション
- 調査の前提条件と市場定義
- 調査範囲
- 調査手法
第4章 主要産業動向
- 消費者の購買行動
- イノベーション
- ブランドシェア分析
- 規制の枠組み
第5章 市場セグメンテーション
- ソフトドリンクタイプ
- エナジーショット
- ナチュラル/オーガニック・エナジードリンク
- 無糖または低カロリーのエナジードリンク
- 従来のエナジードリンク
- その他のエナジードリンク
- 包装タイプ
- ガラス瓶
- 金属缶
- ペットボトル
- 流通チャネル
- オフトレード
- コンビニエンスストア
- オンライン小売
- スーパーマーケット/ハイパーマーケット
- その他
- オントレード
- オフトレード
第6章 競合情勢
- 主要な戦略動向
- 市場シェア分析
- 企業情勢
- 企業プロファイル
- Congo Brands
- DAS Labs LLC
- Living Essentials, LLC
- Monster Beverage Corporation
- N.V.E. Pharmaceuticals
- PepsiCo, Inc.
- Red Bull GmbH
- Seven & I Holdings Co., Ltd.
- The Coca-Cola Company
- Woodbolt Distribution, LLC
- Zevia LLC
第7章 CEOへの主な戦略的質問
第8章 付録
- 世界概要
- 概要
- ファイブフォース分析フレームワーク
- 市場力学(DROs)
- 情報源と参考文献
- 図表一覧
- 主要洞察
- データパック
- 用語集
The United States Energy Drinks Market size is estimated at 19.58 billion USD in 2025, and is expected to reach 22.57 billion USD by 2030, growing at a CAGR of 2.88% during the forecast period (2025-2030).
Easy accessibility of traditional energy drinks in novel flavors and ingredient combinations is supporting the market's growth
- Energy drinks rapidly gained popularity among consumers in the United States, especially those from the millennial and Gen Z groups. The growing demand for energy drinks as a potential energy booster to improve physical and cognitive performance has been shaping the market's growth. Additionally, specific clean-label claims, like gluten-free, sugar-free, and organic, are influencing consumers who indulge in sports. As a result, the sales value of energy drinks in the United States registered a growth rate of 5.42% in 2023 compared to 2021.
- Traditional energy drinks hold a major market share in the energy drinks market. They are expected to register a growth rate of 8.38% by value from 2024 to 2028. The growth is boosted by the growing availability and easy accessibility of traditional energy drinks in novel flavors and ingredient combinations, wherein these energy drinks are available as a standalone product or in combination with juices or spirits in the form of mocktails and cocktails, respectively. In 2023, more than 35% of consumers in the United States aged 18- 29 years stated that they drink energy drinks regularly.
- Within the energy drinks market, the natural/organic segment is witnessing the highest growth in the United States. The segment is projected to register a CAGR of 4.38% by value during 2024-2030. US manufacturers are capitalizing on this trend by introducing lines of natural, naturally caffeinated, and plant-based energy drinks. Notable brands in this space include Reign Storm, Zoa, and Proper Wild.
United States Energy Drinks Market Trends
Growing trend of health-conscious consumers looking for low-calorie beverages fuels the segment sales
- Energy drinks claim to increase energy while enhancing mental alertness and physical performance owing to their higher caffeine content. In the US, 85% of the population drank caffeinated beverages every day in 2022.
- In recent years, the consumption of energy drinks has been increasing steadily owing to the consumer preference for instant hydration coupled with sugar-free and calorie-free beverages. Considering the worldwide per capita consumption of Energy drinks, the United States of America ranks first by scoring 28.4% of average volume in liters in 2023.
- Packaging is one of the extremely important attributes for energy drinks, with 39% of American consumers indicating that the environmental impact of packaging is important to their purchasing decisions in 2023.
- The average selling prices of energy drinks are mainly influenced by the rise and fall in raw material prices, including sugar, caffeine, flavors, and other additives. Most energy drinks are expensive, as of 2023, the average cost of an energy drink ranges between USD 2.50-USD 5 for a 16-ounce can.
United States Energy Drinks Industry Overview
The United States Energy Drinks Market is fairly consolidated, with the top five companies occupying 67.99%. The major players in this market are Congo Brands, Living Essentials, LLC, Monster Beverage Corporation, PepsiCo, Inc. and Red Bull GmbH (sorted alphabetically).
Additional Benefits:
- The market estimate (ME) sheet in Excel format
- 3 months of analyst support
TABLE OF CONTENTS
1 EXECUTIVE SUMMARY & KEY FINDINGS
2 REPORT OFFERS
3 INTRODUCTION
- 3.1 Study Assumptions & Market Definition
- 3.2 Scope of the Study
- 3.3 Research Methodology
4 KEY INDUSTRY TRENDS
- 4.1 Consumer Buying Behaviour
- 4.2 Innovations
- 4.3 Brand Share Analysis
- 4.4 Regulatory Framework
5 MARKET SEGMENTATION (includes market size in Value in USD and Volume, Forecasts up to 2030 and analysis of growth prospects)
- 5.1 Soft Drink Type
- 5.1.1 Energy Shots
- 5.1.2 Natural/Organic Energy Drinks
- 5.1.3 Sugar-free or Low-calories Energy Drinks
- 5.1.4 Traditional Energy Drinks
- 5.1.5 Other Energy Drinks
- 5.2 Packaging Type
- 5.2.1 Glass Bottles
- 5.2.2 Metal Can
- 5.2.3 PET Bottles
- 5.3 Distribution Channel
- 5.3.1 Off-trade
- 5.3.1.1 Convenience Stores
- 5.3.1.2 Online Retail
- 5.3.1.3 Supermarket/Hypermarket
- 5.3.1.4 Others
- 5.3.2 On-trade
- 5.3.1 Off-trade
6 COMPETITIVE LANDSCAPE
- 6.1 Key Strategic Moves
- 6.2 Market Share Analysis
- 6.3 Company Landscape
- 6.4 Company Profiles
- 6.4.1 Congo Brands
- 6.4.2 DAS Labs LLC
- 6.4.3 Living Essentials, LLC
- 6.4.4 Monster Beverage Corporation
- 6.4.5 N.V.E. Pharmaceuticals
- 6.4.6 PepsiCo, Inc.
- 6.4.7 Red Bull GmbH
- 6.4.8 Seven & I Holdings Co., Ltd.
- 6.4.9 The Coca-Cola Company
- 6.4.10 Woodbolt Distribution, LLC
- 6.4.11 Zevia LLC
7 KEY STRATEGIC QUESTIONS FOR SOFT DRINK CEOS
8 APPENDIX
- 8.1 Global Overview
- 8.1.1 Overview
- 8.1.2 Porter's Five Forces Framework
- 8.1.3 Market Dynamics (DROs)
- 8.2 Sources & References
- 8.3 List of Tables & Figures
- 8.4 Primary Insights
- 8.5 Data Pack
- 8.6 Glossary of Terms

