
|
市場調査レポート
商品コード
1684096
北米のジュース:市場シェア分析、産業動向、成長予測(2025年~2030年)North America Juices - Market Share Analysis, Industry Trends & Statistics, Growth Forecasts (2025 - 2030) |
||||||
カスタマイズ可能
適宜更新あり
|
|||||||
| 北米のジュース:市場シェア分析、産業動向、成長予測(2025年~2030年) |
|
出版日: 2025年03月18日
発行: Mordor Intelligence
ページ情報: 英文 237 Pages
納期: 2~3営業日
|

全表示
- 概要
- 目次
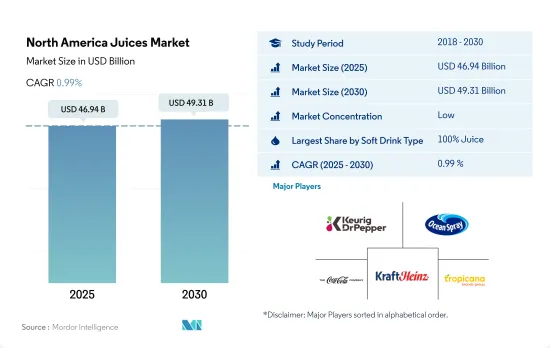
北米のジュース市場規模は2025年に469億4,000万米ドルと推定・予測され、2030年には493億1,000万米ドルに達し、予測期間中(2025年~2030年)のCAGRは0.99%で成長すると予測されます。
クリーンラベル製品を求める消費者と健康志向の高まりが売上を押し上げる
- 2019年から2023年にかけて、ジュース飲料の取引外販売額は3.80%の伸びを示しました。この急増は、消費者の嗜好がより健康的な選択肢、特にビタミンとミネラルを豊富に含む選択肢へとシフトしていることに起因しています。2022年には、20歳以上の成人の70%近くが1日1~2回フルーツジュースを摂取しており、この年の小売売上を押し上げました。
- 100%ジュースは、2020年から2023年にかけて販売額ベースでわずか2.24%の伸びを示したが、2023年には市場で最大のシェアを占めました。この成長は、小売価格の上昇と、オーガニック・ジュースやクリーン・ラベルのジュースのような代替製品への関心の高まりによって鈍化しました。果汁含有率が25%から99%のネクターが消費者の間で人気を集めています。2024年から2030年までのCAGRは1.35%を記録し、最も急成長する分野と予測されます。このようなネクターへのシフトは、この地域の1人当たりジュース消費量が高く、2022年には約1,750万リットルに達したことに起因しています。消費者は、天然甘味料として蜂蜜を使用し、保存料や人工着色料を使用しないといったクリーンラベルの特性により、ますますネクターに惹かれています。
- もうひとつの新たな動向は、果汁含有率が24%までのジュース飲料の人気が高まっていることです。これらの飲料は、2024年から2030年までのCAGRが1.27%になると予測されています。この成長は、企業が健康志向の消費者に対応するためにジュース飲料の提供を革新していることに起因しています。こうした消費者は、低カロリー、低糖分、最小限の添加物を含む飲料を積極的に求めています。さらに、米国人は食生活で栄養を優先するため、毎日の食事に必要な栄養素を満たすための新たな手段を模索しています。
堅調な果実生産・加工産業と、米国消費者の舌の肥えた嗜好に牽引されたビタミン豊富な飲料に対する消費者需要の急増が、成長を後押ししています。
- 2021年から2023年にかけて、北米のジュース市場は金額ベースで1.65%の成長を記録しました。同地域の消費者は栄養価の高い飲料への傾倒を強めており、ブランドにとって確固たる足場を築く大きなチャンスとなっています。北米ジュース市場の主要企業には、Florida's Natural、Minute Maid、Ades、Tropicana、Snapple、Clamatoなどがあります。同市場では、健康志向のジュースに対する需要も急増しています。2023年には、アメリカのジュースとスムージーの消費者の40%が、主にビタミンを増やすためにジュースの摂取量を増やしています。北米のジュース販売は、2024年から2027年にかけて金額ベースで3%成長すると予測されています。
- 米国は北米のジュース市場をリードしており、2025年の売上高は2022年比で1.27%増加すると予想されています。米国のジュース市場は、その堅調な果実生産と加工産業と密接に結びついています。2023年、米国の果実生産量は23%増の81万9,000トンに達します。カリフォルニア州が全米の果実栽培面積の約半分を占め、次いでフロリダ州が約4分の1、ワシントン州が約10分の1を占める。
- カナダは北米で2番目に大きなジュース消費市場シェアを占めています。2023年には、100%ジュースがカナダで最も売れているカテゴリーに浮上し、54.4%の数量シェアを占めています。健康的な飲食品を重視する傾向が強まっていることから、カナダでは100%ジュースの需要がさらに高まると予想されます。2023年には、カナダの消費者の57%が、心臓の健康、腸の健康、ストレス管理、免疫サポートなど、ホリスティックな健康効果を提供する食品・飲料を優先しています。100%ジュースの販売量は2024年から2030年にかけてCAGR 1.28%を記録すると予測されます。
北米のジュース市場動向
ジュースは他の清涼飲料よりも健康的であるという消費者の認識が同分野の売上を促進
- 北米、特に米国では、ジュースは特に誕生日、祝日、宗教行事などの特別な機会によく飲まれています。例えば、オレンジジュースはクリスマスの朝食に、クランベリージュースはディナーパーティーによく出されます。
- 消費者はまた、プロバイオティクス、抗酸化物質、ビタミン・ミネラル、フラボノイド、オメガ3脂肪酸など、特定の機能性成分を含むジュースにも関心を寄せています。これらの成分には、免疫力を高めたり、炎症を抑えたりするなどの健康効果があると考えられています。
- ジュース・セグメントでは、100%ジュースが健康上の利点から消費者の人気を集めています。100%ジュースの平均販売価格は、2022年時点で1リットル当たり2.65米ドルと評価されています。
- 米国では、健康志向のジュース動向も増加傾向にあります。米国でジュースとスムージーを飲む人の約40%は、ビタミン摂取量を増やす方法として、2021年と比べてより多くのジュースを飲んでいます。
北米のジュース産業の概要
北米のジュース市場は細分化されており、上位5社で13.52%を占めています。この市場の主要企業は以下の通り。 Keurig Dr Pepper, Inc., Ocean Spray Cranberries, Inc., The Coca-Cola Company, The Kraft Heinz Company and Tropicana Brands Group.
その他の特典
- エクセル形式の市場予測(ME)シート
- 3ヶ月のアナリストサポート
目次
第1章 エグゼクティブサマリーと主な調査結果
第2章 レポートのオファー
第3章 イントロダクション
- 調査の前提条件と市場定義
- 調査範囲
- 調査手法
第4章 主要産業動向
- 消費者の購買行動
- イノベーション
- ブランドシェア分析
- 規制の枠組み
第5章 市場セグメンテーション
- 清涼飲料タイプ
- 100%ジュース
- ジュース飲料(果汁24%以下)
- 濃縮ジュース
- ネクター(果汁25~99)
- 包装タイプ
- 無菌パッケージ
- 使い捨てカップ
- ガラス瓶
- 金属缶
- ペットボトル
- 流通チャネル
- オフトレード
- コンビニエンスストア
- オンライン小売
- スーパーマーケット/ハイパーマーケット
- その他
- オン・トレード
- オフトレード
- 国名
- カナダ
- メキシコ
- 米国
- その他の北米地域
第6章 競争情勢
- 主要な戦略動向
- 市場シェア分析
- 企業情勢
- 企業プロファイル
- Brynwood Partners
- Citrus World, Inc.
- Grupo Jumex, S.A. de C.V.
- Keurig Dr Pepper, Inc.
- Knouse Foods Cooperative, Inc.
- Langer Juice Company, Inc.
- National Beverage Corp.
- National Grape Co-Operative Association, Inc.
- Ocean Spray Cranberries, Inc.
- PepsiCo, Inc.
- S. Martinelli & Company
- The Coca-Cola Company
- The Kraft Heinz Company
- The Vita Coco Company Inc.
- Tropicana Brands Group
- Wm. Bolthouse Farms, Inc.
第7章 CEOへの主な戦略的質問CEOへの主な戦略的質問
第8章 付録
- 世界概要
- 概要
- ファイブフォース分析フレームワーク
- 市場力学(DROs)
- 情報源と参考文献
- 図表一覧
- 主要洞察
- データパック
- 用語集
The North America Juices Market size is estimated at 46.94 billion USD in 2025, and is expected to reach 49.31 billion USD by 2030, growing at a CAGR of 0.99% during the forecast period (2025-2030).
Consumers looking for clean-label products and increased health concerns are boosting sales
- From 2019 to 2023, off-trade sales of juice drinks saw a 3.80% growth in sales value. This surge can be attributed to a shift in consumer preferences toward healthier options, particularly those rich in vitamins and minerals. In 2022, nearly 70% of adults aged 20 and above consumed fruit juices once or twice daily, bolstering retail sales that year.
- 100% juices accounted for the largest share in the market in 2023, witnessing a growth of just 2.24% in terms of sales value from 2020 to 2023. This growth was dampened by increased retail prices and an increased interest in alternative products like organic juices and those with clean labels. Nectars, with juice content ranging from 25% to 99%, are gaining traction among consumers. They are projected to comprise the fastest-growing segment, recording a CAGR of 1.35% from 2024 to 2030. This shift toward nectars can be attributed to the region's high per capita juice consumption, which stood at approximately 17.5 million liters in 2022. Consumers are increasingly drawn to nectars due to their clean label attributes, such as the use of honey as a natural sweetener and the absence of preservatives and artificial colorings.
- Another emerging trend is the rising popularity of juice drinks with juice content up to 24%. These drinks are projected to witness a CAGR of 1.27% from 2024 to 2030. This growth can be attributed to companies innovating their juice drink offerings to cater to health-conscious consumers. These consumers are actively seeking beverages with lower calorie counts, reduced sugar content, and minimal additives. Additionally, as Americans prioritize nutrition in their diets, they are exploring new avenues to meet their daily dietary requirements.
The robust fruit production and processing industry, combined with a surge in consumer demand for vitamin-rich beverages led by the discerning tastes of US consumers, is propelling the growth
- From 2021 to 2023, the North American juice market witnessed a 1.65% growth in terms of value. Consumers in the region are increasingly gravitating toward nutrient-rich beverages, presenting a significant opportunity for brands to establish a strong foothold. Key players in the North American juice market include Florida's Natural, Minute Maid, Ades, Tropicana, Snapple, and Clamato. The market is also witnessing a surge in demand for health-conscious juices. In 2023, 40% of American juice and smoothie consumers increased their juice intake, primarily for a boost in vitamins. Juice sales in North America are projected to grow by 3% in terms of value from 2024 to 2027.
- The United States leads the North American juice market, with sales expected to rise by 1.27% in 2025 compared to 2022. The US juice market is closely tied to its robust fruit production and processing industry. In 2023, US fruit production saw a notable uptick of 23%, reaching 819,000 metric tons. California accounts for roughly half of the nation's fruit acreage, followed by Florida with nearly a quarter and Washington with around a tenth.
- Canada holds the second-largest market share for juice consumption in North America. In 2023, 100% juice emerged as the top-selling category in Canada, commanding a volume share of 54.4%. A growing emphasis on healthy food and beverage choices is expected to further boost the demand for 100% juice in Canada. In 2023, 57% of Canadian consumers prioritized food and drinks that offered holistic health benefits, spanning heart health, gut health, stress management, and immune support. The sales volume of 100% juice is projected to register a CAGR of 1.28% from 2024 to 2030.
North America Juices Market Trends
Consumer perception of juices being healthier than other soft drinks, fuels segment sales
- In North America, especially in the United States, juices are often consumed, especially on special occasions, such as birthdays, holidays, and religious festivals. For example, orange juice is often served at Christmas breakfast, while cranberry juice is often served at dinner parties.
- Consumers are also interested in juices that contain specific functional ingredients, such as probiotics, antioxidants, vitamins minerals, flavonoids, and omega-3 fatty acids. These ingredients are perceived to have health benefits, such as boosting the immune system, reducing inflammation, and other benefits.
- Under the Juice segment, 100% juices have been gaining popularity among consumers due to the health benefits associated with it. The average selling price of 100% juices is valued at USD 2.65 per liter as of 2022.
- In the US, health-conscious juice trends are also on the rise. Around 40% of US juice and smoothie drinkers are drinking more juice compared to 2021 as a way of increasing their vitamin intake.
North America Juices Industry Overview
The North America Juices Market is fragmented, with the top five companies occupying 13.52%. The major players in this market are Keurig Dr Pepper, Inc., Ocean Spray Cranberries, Inc., The Coca-Cola Company, The Kraft Heinz Company and Tropicana Brands Group (sorted alphabetically).
Additional Benefits:
- The market estimate (ME) sheet in Excel format
- 3 months of analyst support
TABLE OF CONTENTS
1 EXECUTIVE SUMMARY & KEY FINDINGS
2 REPORT OFFERS
3 INTRODUCTION
- 3.1 Study Assumptions & Market Definition
- 3.2 Scope of the Study
- 3.3 Research Methodology
4 KEY INDUSTRY TRENDS
- 4.1 Consumer Buying Behaviour
- 4.2 Innovations
- 4.3 Brand Share Analysis
- 4.4 Regulatory Framework
5 MARKET SEGMENTATION (includes market size in Value in USD and Volume, Forecasts up to 2030 and analysis of growth prospects)
- 5.1 Soft Drink Type
- 5.1.1 100% Juice
- 5.1.2 Juice Drinks (up to 24% Juice)
- 5.1.3 Juice concentrates
- 5.1.4 Nectars (25-99% Juice)
- 5.2 Packaging Type
- 5.2.1 Aseptic packages
- 5.2.2 Disposable Cups
- 5.2.3 Glass Bottles
- 5.2.4 Metal Can
- 5.2.5 PET Bottles
- 5.3 Distribution Channel
- 5.3.1 Off-trade
- 5.3.1.1 Convenience Stores
- 5.3.1.2 Online Retail
- 5.3.1.3 Supermarket/Hypermarket
- 5.3.1.4 Others
- 5.3.2 On-trade
- 5.3.1 Off-trade
- 5.4 Country
- 5.4.1 Canada
- 5.4.2 Mexico
- 5.4.3 United States
- 5.4.4 Rest of North America
6 COMPETITIVE LANDSCAPE
- 6.1 Key Strategic Moves
- 6.2 Market Share Analysis
- 6.3 Company Landscape
- 6.4 Company Profiles
- 6.4.1 Brynwood Partners
- 6.4.2 Citrus World, Inc.
- 6.4.3 Grupo Jumex, S.A. de C.V.
- 6.4.4 Keurig Dr Pepper, Inc.
- 6.4.5 Knouse Foods Cooperative, Inc.
- 6.4.6 Langer Juice Company, Inc.
- 6.4.7 National Beverage Corp.
- 6.4.8 National Grape Co-Operative Association, Inc.
- 6.4.9 Ocean Spray Cranberries, Inc.
- 6.4.10 PepsiCo, Inc.
- 6.4.11 S. Martinelli & Company
- 6.4.12 The Coca-Cola Company
- 6.4.13 The Kraft Heinz Company
- 6.4.14 The Vita Coco Company Inc.
- 6.4.15 Tropicana Brands Group
- 6.4.16 Wm. Bolthouse Farms, Inc.
7 KEY STRATEGIC QUESTIONS FOR SOFT DRINK CEOS
8 APPENDIX
- 8.1 Global Overview
- 8.1.1 Overview
- 8.1.2 Porter's Five Forces Framework
- 8.1.3 Market Dynamics (DROs)
- 8.2 Sources & References
- 8.3 List of Tables & Figures
- 8.4 Primary Insights
- 8.5 Data Pack
- 8.6 Glossary of Terms

