
|
市場調査レポート
商品コード
1684087
アジア太平洋のジュース:市場シェア分析、産業動向、成長予測(2025年~2030年)Asia-Pacific Juices - Market Share Analysis, Industry Trends & Statistics, Growth Forecasts (2025 - 2030) |
||||||
カスタマイズ可能
適宜更新あり
|
|||||||
| アジア太平洋のジュース:市場シェア分析、産業動向、成長予測(2025年~2030年) |
|
出版日: 2025年03月18日
発行: Mordor Intelligence
ページ情報: 英文 252 Pages
納期: 2~3営業日
|

全表示
- 概要
- 目次
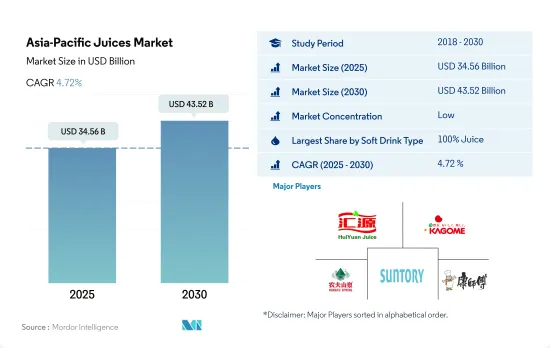
アジア太平洋のジュース市場規模は2025年に345億6,000万米ドルと推定され、2030年には435億2,000万米ドルに達すると予測され、予測期間中(2025年~2030年)のCAGRは4.72%で成長する見込みです。
同地域における機能的で付加価値の高いジュース製品に対する需要の高まりが市場成長を促進
- 2023年には100%ジュースが市場シェアを独占アジア太平洋のジュース市場は、炭酸清涼飲料の単なる代替品という枠を超えて進化しています。現在では、機能的で付加価値の高い100%ジュースやより健康的なオプションに対する需要の高まりに対応しています。この地域の消費者の大多数は、100%ジュースを毎日の食生活に欠かせないものとして取り入れています。さらに、消費者は健康的であると認識するジュースには割高な料金を支払うことを厭わないです。2022年には、売上の46%を占めるオレンジがアジアで最も好まれるフレーバーに浮上し、次いでリンゴが17%で続きます。
- ジュースの種類の中では濃縮果汁が最も高い成長を遂げ、2024年~2030年のCAGRは金額ベースで5.20%と予測されます。濃縮果汁はベーカリーや菓子類の甘味料や着色料として利用されています。濃縮果汁の需要は、オーストラリア、中国、日本、インド、ニュージーランドでの消費拡大に牽引され、今後数年間で急増すると予想されます。日本では、飲料市場における濃縮果汁の使用が顕著に増加しています。さらに、濃縮果汁を配合し、外見に好影響を与えると評価されている美容飲料が日本で人気を博しています。
- マレーシアは、2024年から2030年までの数量ベースのCAGRが5.77%と予測され、成長のトップランナーになるものと思われます。同国はトロピカル・フルーツが豊富で、フルーツ・ジュースの国内生産と消費に大きな影響を与えています。このことを認識したマレーシア政府は、補助金を通じて国内の果汁メーカーにインセンティブを与え、市場における地元製品の競合強化を図っています。
健康志向の高まりと果汁の国内生産の増加が同分野の売上を押し上げると予想されます。
- 2021年~2023年の市場は金額ベースで8.30%の好成長が見込まれます。ジュースの需要を牽引しているのは、健康志向の消費者の間で天然飲料やオーガニック飲料の人気が高まっていることです。消費者は健康志向を強めており、砂糖、カロリー、添加物の少ない飲料を求めています。その結果、ジュースは炭酸飲料やその他の砂糖入り飲料に代わる健康的な飲料として認識され、ジュースの人気急上昇に寄与しています。
- 中国は市場最大の成長国であり、2023年には突出した市場シェアを獲得します。ジュースの消費量が顕著に増加しているのは、都市化やライフスタイルの進化とともに、人々が便利で健康的な選択肢を求めているため、健康とウェルネスに対する意識が高まっていることなどが要因となっており、同国ではパッケージジュースの生産と流通が増加しています。2022年には、消費者の約55%が健康的なライフスタイルを維持し、約32%が健康増進のために健康ジュースを含む健康関連製品を購入しています。
- その他アジア太平洋を除けば、2024年から2030年までの金額ベースのCAGRは5.75%で、マレーシアが最も急成長することが予想されます。マレーシアは熱帯果実が豊富なため、果汁の国内生産と消費に重要な役割を果たしています。マレーシア政府は、国内メーカーに補助金を支給することで果汁の国内生産を後押しし、国内製品の市場競争力を高める方針を示しています。また、マレーシアは気候が温暖なため、ほとんどの果物が一年中手に入る。そのため、地元産の果物が安定的に供給され、季節に関係なく消費者の需要を満たすことができます。
アジア太平洋のジュース市場動向
炭酸飲料よりジュースの方が健康的という消費者の認識が、同分野の売上を促進
- 健康志向の消費者はジュース・メーカーの主要ターゲットです。2021年、中国のフィットネス人口は7,029万人で、全人口の5.02%を占めました。
- ジュースブランドは、フルーツジュース製品の栄養価を高めるため、ビタミン添加フルーツジュースを導入して自社製品を宣伝しています。消費者は持続可能な包装を好み、この傾向は100%リサイクルPET(rPET)市場の拡大という形で発展し続けています。
- 小売業者はサプライチェーン・マネジメントの最適化に注力し、一時的な割引を提供し、消費者にさまざまな価格帯でより多くの選択肢を提供するため、新しい製品ラインやパッケージ・オプションを導入することに取り組んでいます。
- ジュース飲料は、市場のZ世代とミレニアル世代に高い人気があります。対照的に、アジア太平洋の肥満人口は、より良い健康を維持するために食生活を大きく変えつつあります。
アジア太平洋のジュース産業の概要
アジア太平洋のジュース市場は細分化されており、上位5社で12.14%を占めています。この市場の主要企業は以下の通りです。 Beijing Huiyuan Food and Beverage, Kagome, Nongfu Spring, Suntory Holdings Limited and Tingyi(Cayman Islands)Holding Corporation(sorted alphabetically).
その他の特典
- エクセル形式の市場予測(ME)シート
- 3ヶ月間のアナリストサポート
目次
第1章 エグゼクティブサマリーと主な調査結果
第2章 レポートのオファー
第3章 イントロダクション
- 調査の前提条件と市場定義
- 調査範囲
- 調査手法
第4章 主要産業動向
- 消費者の購買行動
- イノベーション
- ブランドシェア分析
- 規制の枠組み
第5章 市場セグメンテーション
- 清涼飲料タイプ
- 100%ジュース
- ジュース飲料(果汁24%以下)
- 濃縮ジュース
- ネクター(果汁25~99)
- 包装タイプ
- 無菌パッケージ
- 使い捨てカップ
- ガラス瓶
- 金属缶
- ペットボトル
- 流通チャネル
- オフトレード
- コンビニエンスストア
- オンライン小売
- スーパーマーケット/ハイパーマーケット
- その他
- オン・トレード
- オフトレード
- 国名
- オーストラリア
- 中国
- インド
- インドネシア
- 日本
- マレーシア
- 韓国
- タイ
- ベトナム
- その他アジア太平洋
第6章 競合情勢
- 主要な戦略動向
- 市場シェア分析
- 企業情勢
- 企業プロファイル
- Aje Group
- Bega Group
- Beijing Huiyuan Food and Beverage Co., Ltd.
- Jinmailang Beverage Co., Ltd.
- Kagome Co Ltd
- Nongfu Spring Co., Ltd.
- Parle Agro Private Limited
- PepsiCo, Inc.
- Suntory Holdings Limited
- Thai Beverages PCL
- The Coca-Cola Company
- Tingyi(Cayman Islands)Holding Corporation
- Tropicana Brands Group
- Uni-President Enterprises Corp.
第7章 CEOへの主な戦略的質問CEOへの主な戦略的質問
第8章 付録
- 世界概要
- 概要
- ファイブフォース分析フレームワーク
- 市場力学(DROs)
- 情報源と参考文献
- 図表一覧
- 主要洞察
- データパック
- 用語集
The Asia-Pacific Juices Market size is estimated at 34.56 billion USD in 2025, and is expected to reach 43.52 billion USD by 2030, growing at a CAGR of 4.72% during the forecast period (2025-2030).
Increased demand for functional, value-added juice products in the region is propelling the market growth
- In 2023, 100% juices dominated the market share. The Asia-Pacific juices market is evolving beyond being a mere alternative to carbonated soft drinks. It is now catering to the rising demand for functional, value-added 100% juices and healthier options. A significant majority of consumers in the region still include 100% juices as a vital part of their daily diet. Moreover, consumers are willing to pay a premium for juices they perceive as healthy. Orange, capturing 46% of sales, emerged as the most favored flavor in Asia, followed by apple at 17% in 2022.
- Among juice types, juice concentrates are poised to witness the highest growth, with a projected CAGR of 5.20% by value during 2024-2030. These concentrates find applications as sweeteners and colorants in the bakery and confectionery industry. The demand for juice concentrates, driven by heightened consumption in Australia, China, Japan, India, and New Zealand, is expected to surge in the coming years. Japan has witnessed a notable uptick in the use of fruit juice concentrates in its beverage market. Additionally, beauty drinks, formulated with fruit juice concentrates and lauded for their positive impact on appearance, have gained popularity in Japan.
- Malaysia is poised to be the frontrunner in growth, with a projected CAGR of 5.77% by volume from 2024 to 2030. The country's abundance of tropical fruits significantly influences its domestic production and consumption of fruit juices. Recognizing this, the Malaysian government is incentivizing domestic fruit juice manufacturers through subsidies, aiming to enhance the competitiveness of local products in the market.
Rising health awareness and increasing domestic production of fruit juices are expected to boost sales in the segment
- The market witnessed a favorable growth rate of 8.30% by value during 2021-2023. The demand for juices is driven by the rising popularity of natural and organic beverages among health-conscious consumers. Consumers are becoming more health-oriented and are seeking beverages that are low in sugar, calories, and additives. As a result, it contributed to a surge in the popularity of juices since they are perceived as a healthier alternative to carbonated drinks and other sugary beverages.
- China is the largest-growing country in the market, attaining a prominent market share in 2023. The notable increase in juice consumption is attributed to factors like rising awareness of health and wellness together with urbanization and evolving lifestyles since people are looking for convenient and healthy options, leading to higher production and distribution of packaged juices in the country. In 2022, about 55% of consumers maintained a healthy lifestyle, and nearly 32% of people purchased health-related products, including healthy juice, to improve their health.
- Apart from the Rest of Asia-Pacific, Malaysia is expected to be the fastest-growing country with a CAGR of 5.75% by value from 2024 to 2030. Since Malaysia is rich in tropical fruits, the abundance of the fruits plays a crucial role in the domestic production and consumption of fruit juices. The Malaysian government has indicated that it will boost the domestic production of fruit juices by providing subsidies to domestic manufacturers, making local products competitive in the market. Also, due to the moderate climate in the country, most of the fruit is available throughout the year. Thereby, the consistent supply of locally sourced fruits ensures a steady production, meeting the consumer demand irrespective of the season.
Asia-Pacific Juices Market Trends
Consumer perception of juices being healthier than carbonated drinks, fuels segment sales
- Health- conscious consumers are the major targeted audiences for juice manufacturers. In 2021, China boasted a fitness population of 70.29 million gym-goers, which accounted for 5.02% of the entire population.
- The juice brands are advertising their products by introducing vitamin-added fruit juices to increase the nutritional profile of fruit juice products. Consumers prefer sustainable packaging and this trend continues to develop, in the form of a growing market for 100% recycled PET (rPET).
- Retailers focus on optimizing their supply chain management, offer temporary discounts, and engage themselves to introduce new product lines or packaging options to provide consumers with more choices at different price points.
- Juice beverages are highly popularized among the Gen-Z and millennials in the market. In contrast, the obese population across Asia-Pacific region are significantly changing their diety habbits in order to maintain better health.
Asia-Pacific Juices Industry Overview
The Asia-Pacific Juices Market is fragmented, with the top five companies occupying 12.14%. The major players in this market are Beijing Huiyuan Food and Beverage Co., Ltd., Kagome Co Ltd, Nongfu Spring Co., Ltd., Suntory Holdings Limited and Tingyi (Cayman Islands) Holding Corporation (sorted alphabetically).
Additional Benefits:
- The market estimate (ME) sheet in Excel format
- 3 months of analyst support
TABLE OF CONTENTS
1 EXECUTIVE SUMMARY & KEY FINDINGS
2 REPORT OFFERS
3 INTRODUCTION
- 3.1 Study Assumptions & Market Definition
- 3.2 Scope of the Study
- 3.3 Research Methodology
4 KEY INDUSTRY TRENDS
- 4.1 Consumer Buying Behaviour
- 4.2 Innovations
- 4.3 Brand Share Analysis
- 4.4 Regulatory Framework
5 MARKET SEGMENTATION (includes market size in Value in USD and Volume, Forecasts up to 2030 and analysis of growth prospects)
- 5.1 Soft Drink Type
- 5.1.1 100% Juice
- 5.1.2 Juice Drinks (up to 24% Juice)
- 5.1.3 Juice concentrates
- 5.1.4 Nectars (25-99% Juice)
- 5.2 Packaging Type
- 5.2.1 Aseptic packages
- 5.2.2 Disposable Cups
- 5.2.3 Glass Bottles
- 5.2.4 Metal Can
- 5.2.5 PET Bottles
- 5.3 Distribution Channel
- 5.3.1 Off-trade
- 5.3.1.1 Convenience Stores
- 5.3.1.2 Online Retail
- 5.3.1.3 Supermarket/Hypermarket
- 5.3.1.4 Others
- 5.3.2 On-trade
- 5.3.1 Off-trade
- 5.4 Country
- 5.4.1 Australia
- 5.4.2 China
- 5.4.3 India
- 5.4.4 Indonesia
- 5.4.5 Japan
- 5.4.6 Malaysia
- 5.4.7 South Korea
- 5.4.8 Thailand
- 5.4.9 Vietnam
- 5.4.10 Rest of Asia-Pacific
6 COMPETITIVE LANDSCAPE
- 6.1 Key Strategic Moves
- 6.2 Market Share Analysis
- 6.3 Company Landscape
- 6.4 Company Profiles
- 6.4.1 Aje Group
- 6.4.2 Bega Group
- 6.4.3 Beijing Huiyuan Food and Beverage Co., Ltd.
- 6.4.4 Jinmailang Beverage Co., Ltd.
- 6.4.5 Kagome Co Ltd
- 6.4.6 Nongfu Spring Co., Ltd.
- 6.4.7 Parle Agro Private Limited
- 6.4.8 PepsiCo, Inc.
- 6.4.9 Suntory Holdings Limited
- 6.4.10 Thai Beverages PCL
- 6.4.11 The Coca-Cola Company
- 6.4.12 Tingyi (Cayman Islands) Holding Corporation
- 6.4.13 Tropicana Brands Group
- 6.4.14 Uni-President Enterprises Corp.
7 KEY STRATEGIC QUESTIONS FOR SOFT DRINK CEOS
8 APPENDIX
- 8.1 Global Overview
- 8.1.1 Overview
- 8.1.2 Porter's Five Forces Framework
- 8.1.3 Market Dynamics (DROs)
- 8.2 Sources & References
- 8.3 List of Tables & Figures
- 8.4 Primary Insights
- 8.5 Data Pack
- 8.6 Glossary of Terms

