
ジュース市場- シェア分析、業界動向と統計、成長予測(2026年~2031年)
Juices - Market Share Analysis, Industry Trends & Statistics, Growth Forecasts (2026 - 2031)
- 発行日
- ページ情報
- 英文 380 Pages
- 納期
- 2~3営業日
- 商品コード
- 1911822
- カスタマイズ可能 お客様のご希望に応じて、既存データの加工や未掲載情報(例:国別セグメント)の追加などの対応が可能です。詳細はお問い合わせください。
- 適宜更新あり 本レポートは最新情報反映のため適宜更新し、内容構成変更を行う場合があります。ご検討の際はお問い合わせください。
- 翻訳ツール提供対象 PDF対応AI翻訳ツールの無料貸し出しサービスのご利用が可能です
概要
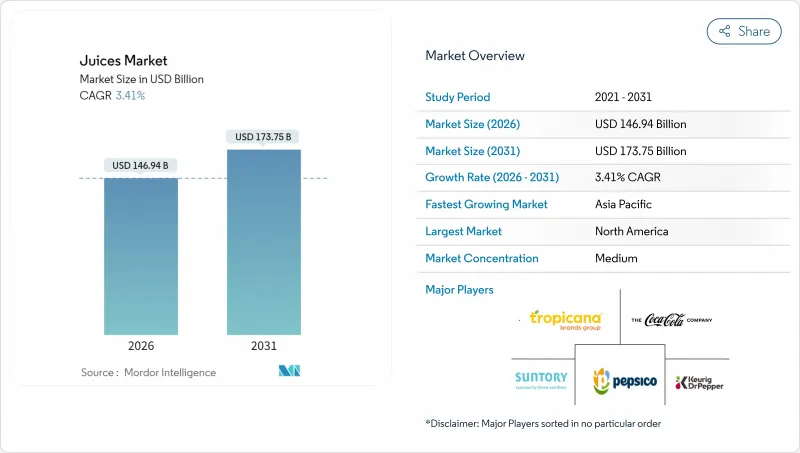
世界のジュース市場は、2025年の1,421億米ドルから2026年には1,469億4,000万米ドルへ成長し、2026年から2031年にかけてCAGR 3.41%で推移し、2031年までに1,737億5,000万米ドルに達すると予測されています。
市場の成長は、プレミアムで最小限の加工を施した製品に対する強い需要に牽引されていますが、45以上の管轄区域における砂糖税の拡大や、柑橘類やリンゴの収穫に影響を与える気候関連の課題によって相殺されています。機能性強化、アジア太平洋地域におけるコールドチェーンインフラの急速な発展、ライフサイクルの炭素排出量を30%削減する無菌カートンの採用といった要因が、価値創造に貢献しています。さらに、糖分を意識する消費者が100%果汁および濃縮還元でない(NFC)製品への移行を推進しており、北米および欧州では有機認証製品がより高い価格プレミアムを獲得しています。競合のダイナミクスは、ESG重視の調達動向に沿った、消費者直販のコールドプレスショット、プロバイオティクス配合製品、ブロックチェーンによる原産地検証など、小規模で高利益率のセグメントへと移行しつつあります。
世界のジュース市場動向と洞察
製品革新と機能性強化
製品革新と機能性強化は、世界のジュース市場に大きな影響を与えており、従来の果物・野菜ジュースを、水分補給や味覚を超えた特定の健康効果を提供する飲料へと変容させています。健康志向製品への消費者需要の高まりに応え、メーカーはプロバイオティクス、アダプトゲン、ターメリック、コラーゲンペプチド、ビタミン、抗酸化物質などの成分をジュースの配合に組み込んでいます。これらの添加は、消化器の健康、免疫力、ストレス管理、肌の健康、そして総合的なウェルビーイングに関する消費者のニーズに応えることを目的としています。強化ジュース製品の革新性は、活用される多様な機能性成分と、健康志向の商品で差別化を図る主要ブランドの戦略的取り組みに反映されています。プロバイオティクス、アダプトゲン、ターメリック、コラーゲンペプチドを配合した機能性ジュースブレンドは、特定の健康目標に対応し日々のウェルネスを促進するライフスタイル飲料として位置付けられています。例えば、ペプシコ社が北米で展開する「トロピカーナエッセンシャルズプロバイオティクス」シリーズは、乳酸菌株と100%オレンジジュースを組み合わせ、腸内環境を気にするミレニアル世代をターゲットとしています。この事例は、主要企業が機能性強化を活用しジュースカテゴリーにおける消費者の期待を再構築している実態を示しています。
砂糖を避ける傾向による100%果汁・NFCジュースへの移行
世界のジュース市場では、消費者の糖分への忌避感の高まりにより顕著な変化が生じており、購買行動や製品への期待に影響を与えています。世界的に健康意識が高まる中、従来は健康飲料とされてきたジュースを含む飲料の糖分含有量に、消費者がより注意を払うようになっております。この動向により、果物や野菜の果汁のみを使用し砂糖を添加しない「100%ジュース」、および最小限の加工で自然な風味と栄養価を保持する「NFC(濃縮還元でない)ジュース」への需要が高まっています。健康への懸念や疫学的傾向が、低糖質オプションへの選好をさらに後押ししています。国際糖尿病連合(IDF)によれば、2024年時点でポルトガルは欧州で最も高い成人糖尿病有病率14.3%を記録し、クロアチアが13.7%で続いています。これらの数値は代謝性疾患が公衆衛生に与える課題を浮き彫りにしており、同地域における低糖飲料代替品への需要拡大に寄与しています。同様の健康リスク認識の傾向は世界的に見られ、消費者が添加糖分を含まない天然の果実栄養を提供するジュースを選択するよう促しています。
45カ国以上で拡大する砂糖税
45カ国以上で実施されている砂糖税は、特に天然糖分や添加糖分が高い製品を中心に、世界のジュース市場の成長を次第に抑制しています。ジュースは栄養価の高い飲料として宣伝されることが多いもの、多くの製品には規制対象となる固有の糖分が含まれています。これにより糖分豊富なジュースの価格が上昇し、価格に敏感な消費者の需要減退や、影響を受けた市場における販売量の伸び悩みを招く可能性があります。さらに、砂糖税の拡大に伴い、メーカーは製品の再設計、減糖技術への投資、あるいは低糖・無糖代替品の開発を迫られています。こうした取り組みは生産の複雑さとコスト増につながります。欧州やラテンアメリカなど、砂糖税が公衆衛生戦略の重要な要素となりつつある地域では、ジュースブランドは、税制規制を遵守しつつ風味と栄養価を維持するという二重の課題に直面しています。
セグメント分析
ジュース飲料(果汁24%以下)は、手頃な価格と広範な流通網に支えられ、2025年の収益の47.62%を占めました。しかしながら、砂糖税の影響と健康意識の高まりにより、このセグメントの成長は鈍化傾向にあり、その価値提案が弱まりつつあります。100%果汁セグメントは、プレミアム化と非濃縮還元(NFC)製品への需要増加を背景に、2031年までCAGR3.94%で成長すると予測されています。コカ・コーラの「Simply」やペプシコの「トロピカーナピュアプレミアム」といったブランドは、フレーバーパックを排除し単一産地調達を強調することで市場シェアを拡大しています。従来、外食産業や工業用途で主流であったジュース濃縮物は、関税変動や即飲タイプへの移行という課題に直面しています。それでも、再構成インフラが整備された大量給食市場や輸出市場では、コスト優位性を維持しています。
規制枠組みがセグメント動向に大きく影響しています。EUの「フルーツジュース指令」は果汁含有率の明確な表示を義務付け、希釈飲料への誤解を招く「ナチュラル」表示を禁止しています。オーストラリアやカナダの食品規制機関でも同様の基準が採用されつつあります。セグメントの発展には明確な分岐が見られます:量販型ジュース飲料はプライベートブランドとの提携で市場シェアを守り、一方100%果汁やネクターは健康志向の訴求や原材料の透明性を活用し、高利益率に注力しています。
2025年時点でPETボトルは包装市場シェアの38.78%を占めており、消費者の親しみやすさ、再封可能性、鮮度を伝える透明性がその要因です。しかしながら、無菌包装は持続可能性への要請と常温流通のコスト優位性により、2031年までCAGR4.31%で成長しています。テトラパック社の「テトラエベロアセプティック」は、紙ベースのバリア層と植物由来ポリマーを採用し、2025年には欧州ジュースブランドの12%で採用されました。この包装はバージンPETと比較してカーボンフットプリントを30%削減し、EUの拡大生産者責任(EPR)目標に沿ったものです。
包装市場は使用事例別に細分化が進んでいます。透明性と再封可能性から、PETボトルは持ち帰り用・冷蔵小売分野で主流です。無菌紙パックは常温流通や冷蔵インフラが限られる地方市場で好まれます。ガラス包装は高級有機製品や職人工芸品分野に位置付けられ、缶は衝動買いや外出先での消費に適しています。技術進歩により、持続可能性・機能性・コストのバランスを図るハイブリッドソリューションが推進されています。例えば再生材50%含有PETボトルやバイオベースキャップ付きカートンなどです。こうした開発は、複雑な認証プロセス対応や研究開発投資が可能な大手企業に有利に働く傾向があります。
地域別分析
北米は2025年の売上高の27.94%を占め、確立された朝食習慣と冷蔵製品の広範な普及が牽引要因となりました。しかしながら、市場の成熟化と糖分含有量に対する消費者意識の高まりが、全体的な成長を鈍化させています。トロピカーナやシンプリーオレンジといった従来の大手ブランドは、スージャやエボリューションフレッシュなどの新興コールドプレスブランドに市場シェアを奪われています。カナダでは、より健康的な選択肢を求める消費者の嗜好と厳格な表示規制に支えられ、有機製品の需要が急速に拡大しています。一方、メキシコの砂糖税は製品の再設計に影響を与え続けており、メーカーが変化する消費者の嗜好と規制圧力に適応する中で、ステビアやアガベネクターなどの代替品が好まれています。
アジア太平洋地域は都市部の所得増加と高圧処理(HPP)技術・コールドチェーンインフラへの投資を背景に、5.18%のCAGRで最も急速な成長を遂げています。農夫山泉(ノンフー・スプリング)が非濃縮還元(NFC)分野に参入したことで、中国ではジュースがライフスタイル商品として位置付けられ、健康志向の都市部消費者にアピールしています。インドでは、マンゴージュースの人気が地域ごとの品種嗜好によって支えられており、各ブランドは地元調達を活用して本場の味と魅力を高めています。日本の機能性飲料市場は、高齢化社会と健康志向の高まりに対応し、電解質豊富なハイブリッド製品へと拡大しています。しかしながら、規制の分断が課題となっており、世界のジュース市場における国境を越えたSKU(在庫管理単位)の標準化を複雑化させ、特定製品ラインの拡張性を制限しています。
欧州は成熟しつつも進化を続ける市場であり、持続可能性規制や減糖イニシアチブの影響を受けています。南欧では豊富な核果類を活かしたネクターが生産されていますが、気候変動に伴う灌漑問題が長期生産のリスク要因となっています。生産者は水効率の高い手法の導入や代替作物品種の探索を加速し、これらの課題への対応を進めています。南米では、ブラジルが広大な柑橘類農園と確立された輸出ネットワークを背景に、オレンジジュースの主要輸出国として引き続き中心的な位置を占めています。しかしながら、国内消費は価格面の問題により制限されており、低所得世帯はより安価な代替品を選択する傾向にあります。一方、アルゼンチンの高インフレ率は2025年の生産量を大幅に減少させており、同地域がマクロ経済リスクに対して脆弱であること、また生産者が競争力を維持するためには費用対効果の高い戦略を採用する必要性を浮き彫りにしています。
その他の特典:
- エクセル形式の市場予測(ME)シート
- アナリストによる3ヶ月間のサポート
よくあるご質問
目次
第1章 イントロダクション
- 調査の前提条件と市場の定義
- 調査範囲
第2章 調査手法
第3章 エグゼクティブサマリー
第4章 市場情勢
- 市場概要
- 市場促進要因
- 製品革新と機能性強化
- 砂糖を避ける傾向による100%果汁およびNFCジュースへの移行
- 持続可能でリサイクル可能な飲料用カートンの採用
- ジュースショット向けデジタルD2Cサブスクリプションプラットフォーム
- アジア太平洋地域における急速なコールドチェーン及びHPP(高圧処理)能力の拡充
- 小分け包装および単品包装の需要拡大
- 市場抑制要因
- 濃縮果汁に対する地政学的な関税変動
- 保存期間延長のための加工による栄養価の低下
- 45カ国以上における砂糖税の拡大
- 気候変動による柑橘類およびリンゴの供給変動
- サプライチェーン分析
- 規制とテクノロジーの展望
- ポーターのファイブフォース分析
- 新規参入業者の脅威
- 買い手の交渉力
- 供給企業の交渉力
- 代替品の脅威
- 競争企業間の敵対関係
第5章 市場規模と成長予測
- 製品タイプ別
- 100%果汁
- 果汁飲料(果汁24%以下)
- ジュース濃縮液
- ネクター
- パッケージングタイプ別
- 無菌包装
- ガラス瓶
- 金属缶
- ペットボトル
- 使い捨てカップおよびパウチ
- カテゴリー別
- 従来型
- オーガニック
- 流通チャネル別
- 小売店向け
- スーパーマーケット/ハイパーマーケット
- コンビニエンスストア
- オンライン小売
- その他流通チャネル
- オントレード
- 小売店向け
- 地域別
- 北米
- 米国
- カナダ
- メキシコ
- その他北米地域
- 欧州
- ドイツ
- 英国
- イタリア
- フランス
- スペイン
- オランダ
- ポーランド
- ベルギー
- スウェーデン
- その他欧州地域
- アジア太平洋地域
- 中国
- インド
- 日本
- オーストラリア
- インドネシア
- 韓国
- タイ
- シンガポール
- その他アジア太平洋地域
- 南米
- ブラジル
- アルゼンチン
- コロンビア
- チリ
- ペルー
- その他南米
- 中東・アフリカ
- 南アフリカ
- サウジアラビア
- アラブ首長国連邦
- ナイジェリア
- エジプト
- モロッコ
- トルコ
- その他中東・アフリカ地域
- 北米
第6章 競合情勢
- 市場集中度
- 戦略的動向
- 市場ランキング分析
- 企業プロファイル
- The Coca-Cola Company
- PepsiCo Inc.
- Tropicana Brands Group
- Keurig Dr Pepper Inc.
- Suntory Holdings Ltd.
- Nongfu Spring Co. Ltd.
- Britvic plc
- Eckes-Granini Group GmbH
- Thai Beverage PCL
- Uni-President Enterprises Corp.
- Rauch Fruchtsafte GmbH & Co OG
- The Kraft Heinz Company
- Tingyi(Cayman Islands)Holding Corp.
- Ocean Spray Cranberries Inc.
- Del Monte Pacific Ltd.
- Nestle S.A.
- Suja Life LLC
- Bolthouse Farms Inc.
- Welch Foods Inc.
- Campbell Soup Company
第7章 市場機会と将来の展望
- 発行日
- 発行
- Mordor Intelligence
- ページ情報
- 英文 380 Pages
- 納期
- 2~3営業日