
|
市場調査レポート
商品コード
1683832
北米のフードサービス:市場シェア分析、産業動向、成長予測(2025年~2030年)North America Foodservice - Market Share Analysis, Industry Trends & Statistics, Growth Forecasts (2025 - 2030) |
||||||
カスタマイズ可能
適宜更新あり
|
|||||||
| 北米のフードサービス:市場シェア分析、産業動向、成長予測(2025年~2030年) |
|
出版日: 2025年03月18日
発行: Mordor Intelligence
ページ情報: 英文 245 Pages
納期: 2~3営業日
|

全表示
- 概要
- 目次
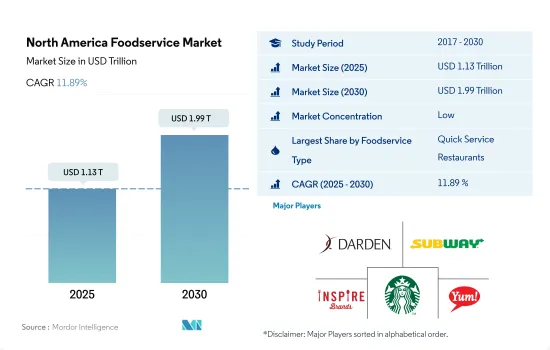
北米のフードサービス市場規模は2025年に1兆1,300億米ドルと推定・予測され、2030年には1兆9,900億米ドルに達し、予測期間(2025年~2030年)のCAGRは11.89%で成長すると予測されます。
消費者のアジア料理志向と技術進歩が市場成長を後押し
- 2022年、北米ではクイックサービスレストラン部門が最大セグメントとなりました。同市場は2017年から2022年にかけて5.33%のCAGRを記録したが、これは主にQSR業界がCOVID-19の流行とインフレによる同地域の経済不振に迅速に適応したためです。QSRの人気に寄与している要因は、特にチェーン店における低コストと品質です。例えば、2021年9月から2022年1月の間に、QSRレストランのメニュー価格は1.3%上昇しました。QSRの平均注文額は2022年も26米ドル以下であったが、FSRの平均注文額はその2倍近くでした。
- フルサービス・レストラン・セグメントは近年、この地域で大きな成長を遂げています。この成長は、このセグメントが様々な文化に様々な料理を提供し、それに応じてメニューを拡大しているためです。アジア料理は、FSRとQSRの両セグメントにおいて、米国で最も急成長している料理のひとつと言われています。同国では2021年に38,000店以上の中華料理店、25,000店以上の日本料理店、5,000店以上のタイ料理店が出店しています。
- クラウドキッチン分野は、金額ベースでCAGR 19.35%を記録すると予測されており、予測期間中に最も急速な成長が見込まれています。クラウドキッチン業界は技術の進歩により成長しています。また、主要な業界プレーヤーは、そのカテゴリの動向を追跡するためのデータベース管理システムの多くの進歩の影響を受けています。新興経済諸国における業界の課題は、クラウドキッチン事業者が販売するデリバリープラットフォームの顧客基盤に依存していることです。これは、メキシコ、プエルトリコ、ドミニカ共和国のように、インターネットの普及率が十分に高くない国では障壁となります。
フードデリバリープラットフォームの拡大とアジア系レストランへの需要が市場を後押し
- 北米諸国における市場拡大の主な理由は、フードデリバリープラットフォームが提供するサービスと、それらがレストランと顧客の双方に提供する利便性です。これらのデリバリー・プラットフォームは近年、シリコンバレーでの競合を超え、米国全土で成長しています。これらのプラットフォームは北米で1日のアクティブユーザー数が2,000万人を超え、業界の主要な利害関係者となっています。北米の主要プラットフォームには、DoorDash、GrubHub、Uber Eats、Foodpanda、Instacart、Deliveroo、Postmates、Seamless、Gopuffなどがあります。
- 北米のフードサービス市場で最大のシェアを占めているのは米国です。米国市場は2017~2022年に金額ベースで4.13%のCAGRを記録しました。この成長はフルサービスレストランとクラウドキッチンの拡大に起因しており、両レストランは2017~2022年にそれぞれ金額ベースで4.35%、12.92%のCAGRを記録しました。
- 米国とカナダのフルサービスレストランセグメントは、主に国内の膨大な移民人口により、過去数年間で著しい成長を遂げました。これにより、アジア料理(特にインド料理、中国料理、日本料理)、欧州料理、中東料理などの需要が近年高まっています。例えば、カナダは2022年に過去最高の43万1,645人の移民を永住者として受け入れました。したがって、カナダのフードサービス市場は予測期間中、金額ベースで17.99%という最速のCAGRで推移すると予測されます。
- パンデミック後の業界の回復は、メキシコのフードサービス業界の拡大に役立つ可能性があります。予測期間終了時までに、同国には100万を超えるQSR店舗と792近いクラウドキッチンが存在すると予想されます。
北米のフードサービス市場の動向
トロントがリード:758のQSR店舗がクイックサービスレストランのハブに
- クイックサービスレストランの店舗数が最も多く、予測期間中のCAGRは5.77%と予想されます。カナダのQSRチェーンは、消費者の嗜好の変化や内部競争の激化にもかかわらず成長を続けています。国際的な需要とグローバリゼーションの機会により、大規模な事業者は新たな市場に進出することができます。トロントはカナダで最もQSR店舗が多い都市で、758店舗を展開しています。
- クラウドキッチン市場の拡大は、オンラインによる食事デリバリー需要の増加、各国料理への憧れ、ハイテクを駆使した注文システムの採用によってもたらされています。カナダ人の約49.4%は、パンデミック後、少なくとも週に1回はオンラインで食品を注文しています。AIは厨房のオペレーションを最適化し、顧客にパーソナライズされた提案を提供するために利用されています。このため、クラウド・キッチン・アウトレットは予測期間中にCAGR 6.25%を記録すると予想されます。
- FSRアウトレットは同国で3番目に急成長しており、予測期間中のCAGRは5.60%と予想されます。カナダは多文化国家であり、沿岸から沿岸まで世界各国の料理が提供されています。移民人口は、高齢化が進む非移民人口よりも若いです。2021年には、カナダには830万人の移民がいた。このような要因が、カナダ全土の長期的な飲食動向に影響を及ぼしています。英国料理、タイ料理、メキシコ料理、中東料理、レバノン料理は、カナダで最も動向している国際料理のひとつです。そのため、国際料理に対する大きな需要が、大規模なフルサービス・オペレーターの全国的な事業拡大を可能にしています。
米国では2022年にフルサービス・レストランが増加し、革新的なメニューと人気料理で健康志向のミレニアル世代に対応する
- 米国では、2022年のフルサービス・レストランの平均注文額は39米ドルで、他のフードサービス業態と比較して最も高いことが観察されました。シェフ主導のフードサービスレストランは、より多くの専門的訓練を受けた有名シェフがFSRによってもたらされる成長から利益を得ることに集中するにつれて増加傾向にあります。専門的な訓練を受けたシェフはまた、味覚や健康志向の高まるミレニアル世代のニーズを満たすため、より革新的なメニューや独自のレシピを提供しています。FSRが提供する人気料理は、ブリトー、チラキレス、ポケボウルです。これらの料理の価格はそれぞれ10米ドル、13.5米ドル、17.95米ドルです。
- クイック・サービス・レストランの需要は、消費者行動の変化、人々の多忙なスケジュール、eコマース・チャネルの普及拡大により増加すると予想されます。クイック・サービス・レストランは、持ち帰り、宅配、その他多くのサービスを提供し、顧客体験を向上させ、近代化に対応しているため、特に若者に人気があります。米国の消費者の間でファーストフードに対する食欲が高まっており、クイックサービス・レストランの平均注文額は調査期間中に16.23%増加しました。2022年には、ハンバーガー、ピザ、ソーセージ、ミートボールなど、人気のあるファーストフードの価格は、それぞれ8.75米ドル、16米ドル、8.5米ドル、9.8米ドルでした。近年の鶏肉人気により、アメリカのレストラン・チェーンはメニュー・セレクションを拡大しています。2021年には消費者の21%がチキンを好むようになりました。そのため、多くのQSRやFSRレストランがメニューにフライドチキンを入れています。このような消費者の需要の変化により、事業者は最も満足度の高いメニューを提供するための競争を余儀なくされます。
北米のフードサービス業界の概要
北米のフードサービス市場は断片化されており、上位5社で10.13%を占めています。この市場の主要企業は以下の通り。 Darden Restaurants, Inc., Doctor's Associates, Inc., Inspire Brands, Inc., Starbucks Corporation and Yum!Brands, Inc.(sorted alphabetically).
その他の特典
- エクセル形式の市場予測(ME)シート
- 3ヶ月間のアナリストサポート
目次
第1章 エグゼクティブサマリーと主な調査結果
第2章 レポートのオファー
第3章 イントロダクション
- 調査の前提条件と市場定義
- 調査範囲
- 調査手法
第4章 主要産業動向
- アウトレット数
- カナダ
- メキシコ
- 米国
- 平均注文金額
- カナダ
- メキシコ
- 米国
- 規制の枠組み
- カナダ
- メキシコ
- 米国
第5章 市場セグメンテーション
- フードサービスタイプ
- カフェ&バー
- 料理別
- バー&パブ
- カフェ
- ジュース/スムージー/デザートバー
- コーヒー&ティー専門店
- クラウドキッチン
- フルサービスレストラン
- 料理別
- アジア料理
- ヨーロピアン
- ラテンアメリカ料理
- 中東料理
- 北米料理
- その他のFSR料理
- クイックサービスレストラン
- 料理別
- ベーカリー
- ハンバーガー
- アイスクリーム
- 肉料理
- ピザ
- その他のQSR料理
- カフェ&バー
- アウトレット
- チェーン店
- 独立店舗
- 場所
- レジャー
- 宿泊施設
- 小売
- 独立型
- 旅行
- 国別
- カナダ
- メキシコ
- 米国
- その他の北米地域
第6章 競争情勢
- 主要な戦略動向
- 市場シェア分析
- 企業情勢
- 企業プロファイル(世界レベルの概要、市場レベルの概要、主要な事業セグメント、財務、従業員数、主要情報、市場ランク、市場シェア、製品・サービス、最近の動向分析を含む)。
- Bloomin'Brands, Inc.
- Boston Pizza International Inc.
- Brinker International, Inc.
- Darden Restaurants, Inc.
- Doctor's Associates, Inc.
- Domino's Pizza Inc.
- Inspire Brands, Inc.
- Jab Holding Company S.A.R.L.
- McDonald's Corporation
- Papa John's International, Inc.
- Restaurant Brands International Inc.
- Seven & I Holdings Co., Ltd.
- Starbucks Corporation
- The Wendy's Company
- Yum!Brands, Inc.
第7章 CEOへの主な戦略的質問
第8章 付録
- 世界の概要
- 概要
- ファイブフォース分析フレームワーク
- 世界・バリューチェーン分析
- 市場力学(DROs)
- 情報源と参考文献
- 図表一覧
- 主要洞察
- データパック
- 用語集
The North America Foodservice Market size is estimated at 1.13 trillion USD in 2025, and is expected to reach 1.99 trillion USD by 2030, growing at a CAGR of 11.89% during the forecast period (2025-2030).
Consumer inclination towards Asian cuisine and technological advancement in the sector, boost the growth of the market
- The quick service restaurants segment was the largest segment in North America in 2022. The market recorded a CAGR of 5.33% from 2017 to 2022, primarily because the QSR industry adapted quickly to the region's poor economy due to the COVID-19 pandemic and inflation. Factors contributing to the popularity of QSRs are low cost and quality, especially in chained outlets. For instance, between September 2021 and January 2022, menu prices in QSR restaurants increased by 1.3%. The average order value in QSRs remained below USD 26 in 2022, whereas the average order value for FSRs was nearly double that value.
- The full service restaurant segment has witnessed sizable growth in the region in recent years. The growth is due to the segment providing various cuisines to various cultures and expanding the menu accordingly. Asian food is said to be one of the fastest-growing cuisines in the United States in both the FSR and QSR segments. The country had more than 38,000 Chinese restaurants, 25,000 Japanese restaurants, and 5,000 Thai restaurants in 2021.
- The cloud kitchens segment is anticipated to see the fastest growth during the forecast period, as it is projected to record a CAGR of 19.35% by value. The cloud kitchen industry has grown owing to technological advancements. The major industry players are also influenced by numerous advancements in database management systems to track the trends in their category. A challenge for the industry in developing economies in the region is that cloud kitchen operators are dependent on the customer base of the delivery platforms they sell on. This becomes a barrier in countries like Mexico, Puerto Rico, and the Dominican Republic, where internet penetration is not sufficiently high.
Expansion of food delivery platforms and demand for Asian restaurants favor the market
- The primary reason for the expansion of the market in North American countries is the services provided by food delivery platforms and the convenience they provide to both restaurants and customers. These delivery platforms have progressed beyond the Silicon Valley competition in recent years and have grown throughout the United States. These platforms have reached more than 20 million daily active users in North America and have become major industry stakeholders. Some major platforms in North America include DoorDash, GrubHub, Uber Eats, Foodpanda, Instacart, Deliveroo, Postmates, Seamless, and Gopuff.
- The United States held the largest share of the North American foodservice market. The US market recorded a CAGR of 4.13%, by value, during 2017-2022. The growth was attributed to the expansion of the full service restaurants and cloud kitchens, both of which recorded CAGRs of 4.35% and 12.92%, by value, respectively, during 2017-2022.
- The full service restaurants segment in the United States and Canada has seen tremendous growth over the past few years, mainly due to the vast immigrant population in the country. This has increased the demand for cuisines like Asian (especially Indian, Chinese, and Japanese), European, and Middle Eastern over recent years. For instance, Canada accepted a record 431,645 immigrants as permanent residents in 2022. Therefore the Canadian foodservice market is projected to record the fastest CAGR of 17.99%, by value, during the forecast period.
- The post-pandemic recovery of the industry may help in the expansion of the foodservice industry in Mexico. By the end of the forecast period, the country is expected to have over a million QSR outlets and close to 792 cloud kitchens.
North America Foodservice Market Trends
Toronto takes the lead: 758 QSR stores make it the hub of quick service restaurants
- Quick-service restaurant outlets are the most in number; they are expected to register a CAGR of 5.77% over the forecast period. The QSR chains in Canada have been growing despite changing consumer tastes and increasing internal competition. International demand and globalization opportunities allow large-scale operators to expand their footprint into new markets. Toronto is the city with the most QSR outlets in Canada, with 758 stores.
- The expansion of the cloud kitchen market is being driven by the increase in demand for online meal delivery, a desire for international cuisine, and the adoption of tech-savvy ordering systems. Around 49.4% of Canadians have been ordering food online at least once a week after the pandemic. AI is being used to optimize kitchen operations and provide personalized recommendations to customers. Thus, cloud kitchen outlets are expected to register a CAGR of 6.25% over the forecast period.
- FSR outlets are the third fastest-growing in the country, and they are expected to register a CAGR of 5.60% over the forecast period. Canada is a multicultural country, reflected in the international cuisines offered from coast to coast. The immigrant population is also younger than the aging non-immigrant population. In 2021, there were 8.3 million immigrants in Canada. Such factors influence long-term dining trends across the country. British, Thai, Mexican, Middle Eastern, and Lebanese are among the most trending international cuisines in Canada. Therefore, the huge demand for international cuisine enables large-scale, full-service operators to expand their business across the country.
Full service restaurants rose in the United States in 2022, catering to health-conscious millennials with innovative menus and popular dishes
- In the United States, the average order value was observed as the highest among the full service restaurants in 2022, compared to other foodservice types with a price of USD 39. Chef-driven dining-out restaurants are on the rise as more professionally trained and celebrity chefs focus on benefiting from the growth provided by the FSR. Professionally trained chefs also offer more innovative menus and proprietary recipes to satisfy the needs of the growing taste and health-conscious millennials. Popular dishes offered by the FSR cuisines are Burritos, Chilaquiles, and poke bowls. These cuisines are priced at USD 10, USD 13.5, and USD 17.95, respectively.
- The demand for quick service restaurants is expected to increase due to changes in consumer behavior, people's busy schedules, and growing e-commerce channel penetration. Quick service restaurants are particularly popular with young people since they offer takeaway, home delivery, and many other services to enhance customer experiences and keep up with modernization. With the growing appetite for fast food among American consumers, the average order value for quick service restaurants increased by 16.23% over the study period. In 2022, popular fast food items, including burgers, pizzas, sausages, and meatballs, were priced at USD 8.75, USD 16, USD 8.5, and USD 9.8, respectively. The popularity of chicken in recent years has led American restaurant chains to expand their menu selections. In 2021, 21% of consumers increased their taste for chicken. Thus, many QSR and FSR restaurants include fried chicken in their menus. This consumer demand shift will force operators to compete for the most satisfying offering.
North America Foodservice Industry Overview
The North America Foodservice Market is fragmented, with the top five companies occupying 10.13%. The major players in this market are Darden Restaurants, Inc., Doctor's Associates, Inc., Inspire Brands, Inc., Starbucks Corporation and Yum! Brands, Inc. (sorted alphabetically).
Additional Benefits:
- The market estimate (ME) sheet in Excel format
- 3 months of analyst support
TABLE OF CONTENTS
1 EXECUTIVE SUMMARY & KEY FINDINGS
2 REPORT OFFERS
3 INTRODUCTION
- 3.1 Study Assumptions & Market Definition
- 3.2 Scope of the Study
- 3.3 Research Methodology
4 KEY INDUSTRY TRENDS
- 4.1 Number Of Outlets
- 4.1.1 Canada
- 4.1.2 Mexico
- 4.1.3 United States
- 4.2 Average Order Value
- 4.2.1 Canada
- 4.2.2 Mexico
- 4.2.3 United States
- 4.3 Regulatory Framework
- 4.3.1 Canada
- 4.3.2 Mexico
- 4.3.3 United States
5 MARKET SEGMENTATION (includes market size in Value in USD, Forecasts up to 2030 and analysis of growth prospects)
- 5.1 Foodservice Type
- 5.1.1 Cafes & Bars
- 5.1.1.1 By Cuisine
- 5.1.1.1.1 Bars & Pubs
- 5.1.1.1.2 Cafes
- 5.1.1.1.3 Juice/Smoothie/Desserts Bars
- 5.1.1.1.4 Specialist Coffee & Tea Shops
- 5.1.2 Cloud Kitchen
- 5.1.3 Full Service Restaurants
- 5.1.3.1 By Cuisine
- 5.1.3.1.1 Asian
- 5.1.3.1.2 European
- 5.1.3.1.3 Latin American
- 5.1.3.1.4 Middle Eastern
- 5.1.3.1.5 North American
- 5.1.3.1.6 Other FSR Cuisines
- 5.1.4 Quick Service Restaurants
- 5.1.4.1 By Cuisine
- 5.1.4.1.1 Bakeries
- 5.1.4.1.2 Burger
- 5.1.4.1.3 Ice Cream
- 5.1.4.1.4 Meat-based Cuisines
- 5.1.4.1.5 Pizza
- 5.1.4.1.6 Other QSR Cuisines
- 5.1.1 Cafes & Bars
- 5.2 Outlet
- 5.2.1 Chained Outlets
- 5.2.2 Independent Outlets
- 5.3 Location
- 5.3.1 Leisure
- 5.3.2 Lodging
- 5.3.3 Retail
- 5.3.4 Standalone
- 5.3.5 Travel
- 5.4 Country
- 5.4.1 Canada
- 5.4.2 Mexico
- 5.4.3 United States
- 5.4.4 Rest of North America
6 COMPETITIVE LANDSCAPE
- 6.1 Key Strategic Moves
- 6.2 Market Share Analysis
- 6.3 Company Landscape
- 6.4 Company Profiles (includes Global Level Overview, Market Level Overview, Core Business Segments, Financials, Headcount, Key Information, Market Rank, Market Share, Products and Services, and Analysis of Recent Developments).
- 6.4.1 Bloomin' Brands, Inc.
- 6.4.2 Boston Pizza International Inc.
- 6.4.3 Brinker International, Inc.
- 6.4.4 Darden Restaurants, Inc.
- 6.4.5 Doctor's Associates, Inc.
- 6.4.6 Domino's Pizza Inc.
- 6.4.7 Inspire Brands, Inc.
- 6.4.8 Jab Holding Company S.A.R.L.
- 6.4.9 McDonald's Corporation
- 6.4.10 Papa John's International, Inc.
- 6.4.11 Restaurant Brands International Inc.
- 6.4.12 Seven & I Holdings Co., Ltd.
- 6.4.13 Starbucks Corporation
- 6.4.14 The Wendy's Company
- 6.4.15 Yum! Brands, Inc.
7 KEY STRATEGIC QUESTIONS FOR FOODSERVICE CEOS
8 APPENDIX
- 8.1 Global Overview
- 8.1.1 Overview
- 8.1.2 Porter's Five Forces Framework
- 8.1.3 Global Value Chain Analysis
- 8.1.4 Market Dynamics (DROs)
- 8.2 Sources & References
- 8.3 List of Tables & Figures
- 8.4 Primary Insights
- 8.5 Data Pack
- 8.6 Glossary of Terms
