
|
市場調査レポート
商品コード
1683493
米国の大豆タンパク:市場シェア分析、産業動向・統計、成長予測(2025年~2030年)United States Soy Protein - Market Share Analysis, Industry Trends & Statistics, Growth Forecasts (2025 - 2030) |
||||||
カスタマイズ可能
適宜更新あり
|
|||||||
| 米国の大豆タンパク:市場シェア分析、産業動向・統計、成長予測(2025年~2030年) |
|
出版日: 2025年03月18日
発行: Mordor Intelligence
ページ情報: 英文 197 Pages
納期: 2~3営業日
|

全表示
- 概要
- 目次
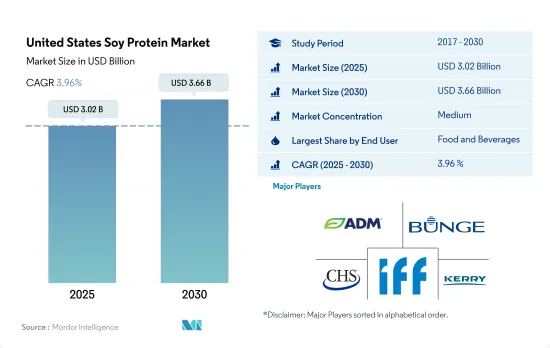
米国の大豆タンパク市場規模は2025年に30億2,000万米ドルと推定・予測され、2030年には36億6,000万米ドルに達し、予測期間中(2025-2030年)のCAGRは3.96%で成長すると予測されています。
飲食品部門は、菜食主義者の増加と大豆タンパク質の栄養価の高さから、大豆タンパク質の使用量で大きなシェアを占めています。
- 飲食品セクターが最も高い需要を記録し、全体の販売額は2016年から2022年に49.7%増加しました。大豆タンパク質は、その機能的・栄養的特性により、製パン、製菓、エマルジョン型ソーセージ、乳製品代替食品、機能性飲料、栄養価の高いバー、朝食用シリアルなど、さまざまな食品用途に利用されています。これらの特性には、脂肪や水分の吸収、乳化、ホイップなどが含まれます。大豆タンパク質は肉や乳製品のタンパク質の代用品として最も好まれており、食品メーカーが価格を抑え、製品の収益性を高めるのに役立っています。
- ベジタリアンの食生活を送るアメリカ人にとって最も経済的な代替植物性タンパク質として、大豆タンパク質の需要は飲食品セクター全体で急増しました。飲食品セクターでは、大豆タンパク質の需要は、線状繊維に重ねたときに筋肉の食感を模倣するその機能性により、食肉/食肉代替産業が主導しています。動物虐待に対する意識の高まりと、動物性タンパク質が環境に与える有害な影響により、消費者は大豆のような植物性タンパク質を選ぶようになってきています。
- サプリメントの成長を支えているのは、スポーツ・パフォーマンス栄養サブセグメントであり、このサブセグメントは予測期間中にCAGR 7.18%を記録し、最も急成長しています。大豆タンパクは、女性アスリート・トライアド・シンドローム(FATS)のような症状における利点により、女性アスリートに広く好まれています。女性アスリートにとって、大豆タンパクパウダーは、パフォーマンスを向上させ、筋肉の回復を早め、骨粗鬆症にも役立つエルゴジェニック補助食品として頻繁に使用されています。
米国の大豆タンパク市場動向
植物性タンパク質消費の成長が原料市場の主要企業に機会を提供
- 米国では、投資と技術革新に支えられて、一人当たりの植物性タンパク質消費量がかなりの割合で増加しており、その結果、消費量は一日当たり40.28グラムに達しています。米国では、動物が虐待される工場畜産が常態化しているからです。多くのアメリカ人は肉や動物性食品の摂取量を減らしているが、完全に排除しているわけではないです。また、ビーガンやベジタリアンよりもフレキシタリアンである傾向が強いです。米国では12%近くの消費者が植物性の食事を好み、7%の消費者がフレキシタリアンです。米国ではあらゆる世代の消費者が植物ベースの食事に関心を持っているが、20代と30代が最も植物ベースの食事に熱心です。
- 肉、鶏肉、ベーカリー製品など、さまざまな食品に幅広く応用されているため、一人当たりのエンドウタンパク消費量は常に増加しています。約41%の消費者がエンドウタンパク由来の植物性食品に関心を持っています。エンドウ豆プロテインは主にスポーツ栄養や肉の代替食品に使用されています。エンドウ豆プロテインパウダーの典型的な1食分は30グラムで、25グラムのタンパク質が含まれています。アスリートは通常1日1食を使用するが、1日3食摂取することもあります。
- 大豆タンパクと乳清プロテインは、主に飲食品、サプリメント、スポーツ栄養産業で使用されています。2021年には、約36%の消費者が大豆タンパク質を知っており、摂取したことがあるのに対し、米国では31%の人がホエイプロテインを摂取していました。同様に、大豆ベースの飲食品消費は2014年から2019年にかけて12.9%増加し、予測期間中も一貫して増加し続けると思われます。
高度な技術応用と消費者受容の拡大が国内での大豆生産を促進
- 大豆は温帯地域と熱帯地域の両方で生産される世界の商品です。大豆はまた、タンパク質と植物油の主要な供給源でもあります。米国の大豆タンパク質市場の主な促進要因は、食品消費パターンと要件の変化、タンパク質源のベジタリアン製品への傾斜です。大豆栄養研究所(Soy Nutrition Institute)が発表したデータによると、米国は全世界の大豆の約75%を生産しています。米国農務省(USDA)と業界のパートナーは、植物検疫証明書の問題を解決し、インドの農家に手頃な価格で飼料を提供するのに役立ちました。
- 米国ではここ数年、食肉添加物への大豆タンパクの応用が、大豆タンパク原料の売上増加に大きな役割を果たしています。動物性タンパク質製品よりも植物性タンパク質製品を好む顧客は、乳児用調製粉乳や動物飼料に大豆タンパク質を使用することに惹かれています。米国農務省(USDA)は、大豆タンパク質が心臓病のリスクを軽減すると述べており、そのため他のビーガンタンパク質の需要が高まっています。
- COVID-19の発生が食品サプライチェーンに与えた影響にもかかわらず、大豆タンパク質の生産は16.4%の伸びを示しました。中国やインドなどの主要輸入国からの需要増加により、輸出は前年比40%増となり、市場の成長をもたらしました。主要生産国でCOVID-19の使用事例が多数観察されているにもかかわらず、大豆産業は操業を続けており、米国の農家は、より少ない資源で土地を大切にしながら収量を維持または増加させるための知識と技術を駆使し、持続可能性を継続的に向上させています。
米国の大豆タンパク産業の概要
米国の大豆タンパク市場は適度に統合されており、上位5社で53.49%を占めています。この市場の主要企業は以下の通りです。 Archer Daniels Midland Company, Bunge Limited, CHS Inc., International Flavors & Fragrances, Inc. and Kerry Group PLC(sorted alphabetically).
その他の特典
- エクセル形式の市場予測(ME)シート
- 3ヶ月のアナリストサポート
目次
第1章 エグゼクティブサマリーと主な調査結果
第2章 イントロダクション
- 調査の前提条件と市場定義
- 調査範囲
- 調査手法
第3章 主要産業動向
- エンドユーザー市場規模
- ベビーフードおよび乳児用調製粉乳
- ベーカリー
- 飲料
- 朝食用シリアル
- 調味料/ソース
- 菓子類
- 乳製品および乳製品代替製品
- 高齢者栄養・医療栄養
- 肉・鶏肉・魚介類および肉代替製品
- RTE/RTC食品
- スナック
- スポーツ/パフォーマンス栄養
- 動物飼料
- パーソナルケアと化粧品
- タンパク質消費動向
- 植物
- 生産動向
- 植物
- 規制の枠組み
- 米国
- バリューチェーンと流通チャネル分析
第4章 市場セグメンテーション
- 形態
- 濃縮物
- 単離液
- テクスチャード/加水分解物
- エンドユーザー
- 飼料
- 飲食品
- サブエンドユーザー別
- ベーカリー
- 飲料
- 朝食用シリアル
- 調味料/ソース
- 乳製品・乳製品代替品
- 肉・鶏肉・魚介類および肉代替製品
- RTE/RTC食品
- スナック
- サプリメント
- サブエンドユーザー別
- ベビーフードおよび乳児用調製乳
- 高齢者栄養および医療栄養
- スポーツ/パフォーマンス栄養
第5章 競合情勢
- 主要な戦略動向
- 市場シェア分析
- 企業情勢
- 企業プロファイル(世界レベルの概要、市場レベルの概要、主要な事業セグメント、財務、従業員数、主要情報、市場ランク、市場シェア、製品・サービス、最近の動向分析を含む)
- A. Costantino & C. SpA
- Archer Daniels Midland Company
- Brenntag SE
- Bunge Limited
- CHS Inc.
- Farbest-Tallman Foods Corporation
- Foodchem International Corporation
- International Flavors & Fragrances, Inc.
- Kerry Group PLC
- The Scoular Company
第6章 CEOへの主な戦略的質問
第7章 付録
- 世界概要
- 概要
- ファイブフォース分析フレームワーク
- 世界のバリューチェーン分析
- 市場力学(DROs)
- 情報源と参考文献
- 図表一覧
- 主要洞察
- データパック
- 用語集
The United States Soy Protein Market size is estimated at 3.02 billion USD in 2025, and is expected to reach 3.66 billion USD by 2030, growing at a CAGR of 3.96% during the forecast period (2025-2030).
Food and Beverages sector accounted major share in usage of soy protein due to growing vegan population coupled with nutritional properties associated with soy protein
- The food and beverages sector registered the highest demand, with the overall sales value increasing by 49.7% in 2022 since 2016. Due to their functional and nutritional properties, they are utilized in a variety of food applications such as baking, confectionary, emulsion-type sausages, dairy replacers, functional beverages, nutritious bars, and breakfast cereals. These properties include fat and water absorption, emulsification, and whipping. Soy proteins are among the most preferred meat and dairy protein substitutes, which has helped food manufacturers control prices and enhance product profitability.
- As the most economical plant protein alternative for Americans consuming vegetarian diets, the demand for soy proteins spiked across the food and beverages sector. In the food and beverages sector, the demand for soy proteins is led by the meat/meat alternative industry, owing to its functionalities that mimic the muscle texture when layered into linear fibers. Consumers are increasingly opting for plant-based proteins like soy due to rising awareness of animal cruelty and the detrimental impacts that animal-based proteins have on the environment.
- The growth of supplements is aided by the sports and performance nutrition sub-segment, which was the fastest-growing sub-segment, recording a CAGR of 7.18% during the forecast period. Soy proteins are extensively preferred by female athletes, owing to their benefits in conditions such as Female Athlete Triad Syndrome (FATS). For female athletes, soy protein powder is frequently used as an ergogenic aid to enhance performance and speed up muscle recovery, which can help with osteoporosis.
United States Soy Protein Market Trends
Growth in plant protein consumption provides opportunities for key players in the ingredients market
- The per capita consumption rate of plant proteins is increasing at a considerable rate in the United States, supported by investments and innovations, resulting in a consumption rate of 40.28 grams per day, primarily due to a rising number of consumers turning vegan to promote animal welfare. This is because factory farming, where animals are maltreated, is a norm in the United States. Most Americans eat less meat and animal products, but they do not eliminate their consumption entirely. They also tend to be more flexitarian than vegan or vegetarian. Nearly 12% of consumers in the country prefer a plant-based diet, whereas 7% of consumers follow a flexitarian diet. Although consumers of all generations in the United States are interested in plant-based meals, individuals in their 20s and 30s are the keenest to adopt plant-based diets.
- There is a constant rise in the per capita consumption of pea protein due to its wide applications in different food products, like meat, poultry, and bakery products. Around 41% of consumers are interested in plant-based food derived from pea protein. Pea protein is mainly used in sports nutrition and meat alternatives. A typical serving of pea protein powder is 30 grams, with 25 grams of protein. Athletes usually use one serving per day but may take as many as three servings per day.
- Soy and whey proteins are used primarily in the food and beverage, supplement, and sports nutrition industries. In 2021, around 36% of consumers were familiar with soy protein and had consumed the same, whereas 31% of individuals consumed whey protein in the US. Similarly, the consumption of soy-based food and beverages favorably increased by 12.9% during 2014-2019, and it is likely to remain consistent throughout the forecast period.
Advanced technological applications, coupled with growing consumer acceptance, drive the production of soybeans in the country
- Soy is a global merchandise commodity produced in both temperate and tropical regions. It also serves as a key source of protein and vegetable oils. The major driving factors for the US soy protein market are the changes in food consumption patterns and requirements and an inclination toward vegetarian products for protein sources. As per the data released by the Soy Nutrition Institute, the United States produces about 75% of all soybeans worldwide. The US Department of Agriculture (USDA) and industry partners solved phytosanitary certificate issues, which helped farmers provide feed to Indian farmers at affordable prices.
- In the United States, the application of soy protein in meat additives has been playing a major role in increasing the sales of soy protein ingredients over the past few years. Customers who favor plant-based protein products over animal-based protein products are drawn to soy protein's use in infant formula and animal feed. The US Department of Agriculture (USDA) stated that soy protein reduces the risk of heart disease, thus increasing the demand for other vegan proteins.
- Despite the impact of the COVID-19 outbreak on the food supply chain, soy protein production observed a hike of 16.4% in growth rate. Due to increasing demand from major importers like China and India, exports increased by 40% from the previous year, which resulted in the market's growth. Even with the high number of COVID-19 cases observed in the major producing countries, the soybean industry continues to operate, with farmers in the United States using knowledge and technologies to maintain or increase yields while using fewer resources and caring for their land, continuously improving sustainability.
United States Soy Protein Industry Overview
The United States Soy Protein Market is moderately consolidated, with the top five companies occupying 53.49%. The major players in this market are Archer Daniels Midland Company, Bunge Limited, CHS Inc., International Flavors & Fragrances, Inc. and Kerry Group PLC (sorted alphabetically).
Additional Benefits:
- The market estimate (ME) sheet in Excel format
- 3 months of analyst support
TABLE OF CONTENTS
1 EXECUTIVE SUMMARY & KEY FINDINGS
2 INTRODUCTION
- 2.1 Study Assumptions & Market Definition
- 2.2 Scope of the Study
- 2.3 Research Methodology
3 KEY INDUSTRY TRENDS
- 3.1 End User Market Volume
- 3.1.1 Baby Food and Infant Formula
- 3.1.2 Bakery
- 3.1.3 Beverages
- 3.1.4 Breakfast Cereals
- 3.1.5 Condiments/Sauces
- 3.1.6 Confectionery
- 3.1.7 Dairy and Dairy Alternative Products
- 3.1.8 Elderly Nutrition and Medical Nutrition
- 3.1.9 Meat/Poultry/Seafood and Meat Alternative Products
- 3.1.10 RTE/RTC Food Products
- 3.1.11 Snacks
- 3.1.12 Sport/Performance Nutrition
- 3.1.13 Animal Feed
- 3.1.14 Personal Care and Cosmetics
- 3.2 Protein Consumption Trends
- 3.2.1 Plant
- 3.3 Production Trends
- 3.3.1 Plant
- 3.4 Regulatory Framework
- 3.4.1 United States
- 3.5 Value Chain & Distribution Channel Analysis
4 MARKET SEGMENTATION (includes market size in Value in USD and Volume, Forecasts up to 2030 and analysis of growth prospects)
- 4.1 Form
- 4.1.1 Concentrates
- 4.1.2 Isolates
- 4.1.3 Textured/Hydrolyzed
- 4.2 End User
- 4.2.1 Animal Feed
- 4.2.2 Food and Beverages
- 4.2.2.1 By Sub End User
- 4.2.2.1.1 Bakery
- 4.2.2.1.2 Beverages
- 4.2.2.1.3 Breakfast Cereals
- 4.2.2.1.4 Condiments/Sauces
- 4.2.2.1.5 Dairy and Dairy Alternative Products
- 4.2.2.1.6 Meat/Poultry/Seafood and Meat Alternative Products
- 4.2.2.1.7 RTE/RTC Food Products
- 4.2.2.1.8 Snacks
- 4.2.3 Supplements
- 4.2.3.1 By Sub End User
- 4.2.3.1.1 Baby Food and Infant Formula
- 4.2.3.1.2 Elderly Nutrition and Medical Nutrition
- 4.2.3.1.3 Sport/Performance Nutrition
5 COMPETITIVE LANDSCAPE
- 5.1 Key Strategic Moves
- 5.2 Market Share Analysis
- 5.3 Company Landscape
- 5.4 Company Profiles (includes Global Level Overview, Market Level Overview, Core Business Segments, Financials, Headcount, Key Information, Market Rank, Market Share, Products and Services, and Analysis of Recent Developments).
- 5.4.1 A. Costantino & C. SpA
- 5.4.2 Archer Daniels Midland Company
- 5.4.3 Brenntag SE
- 5.4.4 Bunge Limited
- 5.4.5 CHS Inc.
- 5.4.6 Farbest-Tallman Foods Corporation
- 5.4.7 Foodchem International Corporation
- 5.4.8 International Flavors & Fragrances, Inc.
- 5.4.9 Kerry Group PLC
- 5.4.10 The Scoular Company
6 KEY STRATEGIC QUESTIONS FOR PROTEIN INGREDIENTS INDUSTRY CEOS
7 APPENDIX
- 7.1 Global Overview
- 7.1.1 Overview
- 7.1.2 Porter's Five Forces Framework
- 7.1.3 Global Value Chain Analysis
- 7.1.4 Market Dynamics (DROs)
- 7.2 Sources & References
- 7.3 List of Tables & Figures
- 7.4 Primary Insights
- 7.5 Data Pack
- 7.6 Glossary of Terms

