
|
市場調査レポート
商品コード
1692033
タンパク質- 市場シェア分析、産業動向・統計、成長予測(2025年~2030年)Protein - Market Share Analysis, Industry Trends & Statistics, Growth Forecasts (2025 - 2030) |
||||||
カスタマイズ可能
適宜更新あり
|
|||||||
| タンパク質- 市場シェア分析、産業動向・統計、成長予測(2025年~2030年) |
|
出版日: 2025年03月18日
発行: Mordor Intelligence
ページ情報: 英文 537 Pages
納期: 2~3営業日
|

全表示
- 概要
- 目次
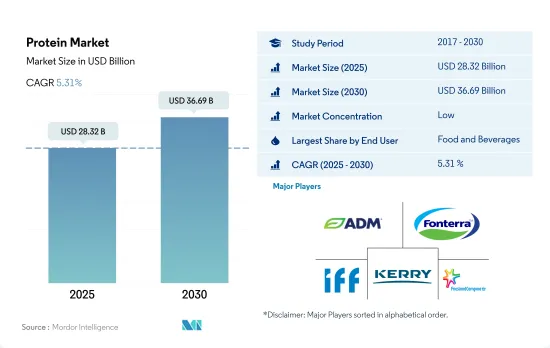
タンパク質市場規模は2025年に283億2,000万米ドルと推定・予測され、2030年には366億9,000万米ドルに達し、予測期間(2025年~2030年)のCAGRは5.31%で成長すると予測されます。
持続可能な代替蛋白源は、主に飲食品セグメントに応用され、市場需要を押し上げます。
- 金額ベースでも数量ベースでも、飲食品は2023年においても同市場の支配的なエンドユーザー・セグメントであり続けた。需要は主に乳製品と食肉の代替用途が牽引し、消費者は植物性タンパク質が豊富な代替品を求めています。2023年には、食肉と乳製品の代替産業が合わせて金額ベースで40.74%のシェアを占めました。植物性タンパク質への高い嗜好性により、消費者の肉離れが進んでおり、これが需要を牽引する大きな要因となっています。2023年現在、欧州では260万人が菜食主義者で、欧州人口の3.2%を占める。彼らはタンパク質含有量の高い肉や乳製品の代替品を求めていました。
- 植物性タンパク質タイプの用途では、飲食品セグメントが動物飼料セグメントに僅差で続いた。植物蛋白質は、動物飼料分野で使用される他の蛋白質の中で、金額ベースで89%のシェアを占めています。植物性タンパク質は、より優れたタンパク質消化率、良好なアミノ酸プロファイル、長い保存性など、ミルク代替品や魚粉よりも多くの利点を提供します。このセグメントは、2024年から2029年にかけて4.64%のCAGRで推移すると予想されています。
- 成長という点では、パーソナルケアと化粧品分野が他の分野を上回り、清潔で自然なパーソナルケア製品への関心の高まりにより、2024年から2029年にかけて金額ベースでCAGR 6.41%を記録すると予想されます。タンパク質は、ジェル、シャンプー、コンディショナー、クリームなど、さまざまな化粧品に使用されています。コラーゲン、エラスチン、ケラチンなど、体内に自然に存在するタンパク質も、皮膚や毛髪を自然に強化する高い効果を考慮し、人気を集めています。タンパク質成分は皮膚や毛髪への効果が証明されており、パーソナルケアと化粧品分野での需要を押し上げています。
植物由来の肉に対する需要の高まりが、北米でのタンパク質消費を促進しています。
- 消費者はより健康的なスナックの代替品を求めており、タンパク質強化食品の成長に大きな展望を与えています。2023年には世界の消費者の約60%がマインドフル・スナッキングをより意識するようになり(前年比4%ポイント増)、61%がより健康的な代替スナックを常に探すようになった(同7%ポイント増)。北米、ラテンアメリカ、欧州、アジア全体では、より健康的なライフスタイルが、より体に良いスナックを選ぶ主な理由となっています。
- 北米は引き続き世界最大のタンパク質消費国であり、主に米国が牽引しています。タンパク質原料の様々な原材料の生産量の増加と消費者の意識の変化が市場に影響を与えています。例えば、米国は2023年に約2,266億ポンドの食用牛乳を生産しました。
- アジア太平洋は、多様なタンパク質源に対する消費者の需要に牽引され、2023年には第2位の市場となりました。消費者の嗜好が植物性へとシフトしたことが大きく影響しました。アジア太平洋地域は、植物性タンパク質の生産に必要な原材料の供給が豊富で、メーカーや消費者にとって比較的費用対効果の高い選択肢となっています。アジア太平洋は、2024年から2029年にかけて5.42%のCAGRで推移すると予測されています。
- 中東は、健康志向の高まりにより天然で持続可能な原料への需要が急速に高まっているため、最も急成長する市場になると予測されます。同地域は、2024~2029年に数量ベースでCAGR 5.57%を記録するとみられています。これは、消費者の嗜好が、より健康的で免疫力を高め、加工度の低い、「フリーフロム」食品へと変化していることに起因しています。2022年には、アラブのミレニアル世代の約25%が便利で簡単に入手できる食品を求めていました。
世界のタンパク質市場の動向
化粧品と栄養化粧品における動物性蛋白質の消費と使用が市場の世界的成長を支えています。
- 動物性タンパク質の世界の消費は大幅な成長を遂げており、中でも乳製品は重要かつ拡大中のセグメントです。特にアスリートの間で、乳製品タンパク質の健康上の利点に対する認識が高まっていることが、世界の一人当たりの動物性タンパク質消費に拍車をかけています。例えばインドでは、2022年から2023年にかけて、インドの消費者の37%が1日の平均牛乳摂取量を1.5~2リットルと報告し、さらに10%が1日3リットル以上摂取しています。これらの数字は、特定の地域における一人当たりの消費水準の高さを浮き彫りにしており、動物性タンパク質に対する世界の需要の大きさを裏付けています。
- さらに、動物性タンパク質の世界の消費量は依然として大きく、鶏肉がその主要部分を占めています。例えば、牛肉、豚肉、鶏肉、羊肉からのタンパク質の利用可能量は、2030年までにそれぞれ5.9%、13.1%、17.8%、15.7%増加すると予測されています。この大幅な量の伸びは、動物性蛋白源に対する世界の需要の大きさと、この需要を満たす上での鶏肉産業の重要な役割を浮き彫りにしています。さらに、牛肉、豚肉、鶏肉は大幅に消費されており、動物性タンパク質の消費パターンが浮き彫りになっています。
- 伝統的な食品用途にとどまらず、医薬品、パーソナルケア、栄養補助食品産業からのコラーゲンやゼラチンのような動物由来タンパク質に対する需要の増加が、市場の成長を大きく後押ししています。例えば、コラーゲンやゼラチンのようなタンパク質は、化粧品や栄養補助食品に広く使用されています。さまざまな用途でコラーゲンやゼラチンの動物性タンパク質に対する需要が高まっているため、予測期間中のCAGRはそれぞれ6.07%と4.70%と予想されます。
動物性タンパク質原料の供給において乳製品原料が重要な役割を果たす
- ホエイとカゼインタンパク質の生産は、主にチーズ生産工場からの供給に依存しています。カゼインとカゼイネートについては、国内工場が脱脂粉乳生産からカゼイン生産に移行する動機付けとして、1ポンド当たり約2.40米ドルの価格帯が不可欠です。2023年から2024年にかけて、世界のチーズ生産量は2,220万トンに達し、カゼイン、カゼイネート、乳清タンパク質のような乳製品タンパク質の生産状況に影響を与えました。米国は年間558万4,857トンのチーズを生産し、世界をリードしています。
- 米国では、乳原料メーカーが乳タンパク質の生産にますます特化しており、ミセルカゼイン濃縮原料の導入が拍車をかけて、2023年には生産量が倍増します。ミセルカゼインは、90%の未変性タンパク質含有量と高い生物学的利用可能カルシウムレベルを有し、2019年から2029年の間に顕著な市場浸透を達成すると予想されます。乳製品ベースのタンパク質に対する需要の高まりは、より高いタンパク質濃度を持つ原料の探索に大きく起因しています。
- アミノ酸プロファイルで知られる豚肉は、ゼラチン製造の原料です。年間2,300万頭の豚を生産するフランスは、極めて重要な役割を果たしています。この国の食肉加工産業は、10万人以上の専門家を雇用しており、欧州第2位の規模を誇っています。豚肉に続いて、水牛と牛が重要な原料として登場し、ゼラチンとコラーゲンタンパク質の生産を強化しています。インドは牛と水牛の頭数で世界をリードしており、2023年の国の牛の頭数は3億760万頭と報告されています。
タンパク質業界の概要
タンパク質市場は断片化されており、上位5社で23.09%を占めています。この市場の主要企業は以下の通り。 Archer Daniels Midland Company, Fonterra Co-operative Group Limited, International Flavors & Fragrances Inc., Kerry Group PLC and Royal FrieslandCampina N.V(sorted alphabetically).
その他の特典
- エクセル形式の市場予測(ME)シート
- 3ヶ月のアナリスト・サポート
目次
第1章 エグゼクティブサマリーと主な調査結果
第2章 イントロダクション
- 調査の前提条件と市場定義
- 調査範囲
- 調査手法
第3章 主要産業動向
- エンドユーザー市場規模
- ベビーフードおよび乳児用調製粉乳
- ベーカリー
- 飲料
- 朝食用シリアル
- 調味料/ソース
- 菓子類
- 乳製品および乳製品代替製品
- 高齢者栄養・医療栄養
- 肉・鶏肉・魚介類および肉代替製品
- RTE/RTC食品
- スナック
- スポーツ/パフォーマンス栄養
- 動物飼料
- パーソナルケアと化粧品
- タンパク質消費動向
- 動物性
- 植物
- 生産動向
- 動物
- 植物
- 規制の枠組み
- オーストラリア
- ブラジル、アルゼンチン
- カナダ
- 中国
- フランス
- ドイツ
- インド
- イタリア
- 日本
- 南アフリカ
- UAEおよびサウジアラビア
- 英国
- 米国
- バリューチェーンと流通チャネル分析
第4章 市場セグメンテーション
- 由来
- 動物性
- タンパク質タイプ別
- カゼインとカゼイネート
- コラーゲン
- 卵タンパク質
- ゼラチン
- 昆虫タンパク質
- ミルクタンパク質
- ホエイタンパク質
- その他の動物性タンパク質
- 微生物
- タンパク質タイプ別
- 藻類タンパク質
- マイコタンパク質
- 植物性
- タンパク質タイプ別
- ヘンプ・タンパク質
- エンドウ豆タンパク質
- ジャガイモ・タンパク質
- 米タンパク質
- 大豆タンパク質
- 小麦タンパク質
- その他の植物性タンパク質
- 動物性
- エンドユーザー
- 動物飼料
- 食品・飲料
- サブエンドユーザー別
- ベーカリー
- 飲料
- 朝食用シリアル
- 調味料/ソース
- 菓子類
- 乳製品・乳製品代替品
- 肉・鶏肉・魚介類および肉代替製品
- RTE/RTC食品
- スナック
- パーソナルケアと化粧品
- サプリメント
- サブエンドユーザー別
- ベビーフードおよび乳児用調製粉乳
- 高齢者栄養と医療栄養
- スポーツ/パフォーマンス栄養
- 地域別
- アフリカ
- 由来別
- エンドユーザー別
- 国別
- ナイジェリア
- 南アフリカ
- その他のアフリカ
- アジア太平洋
- 由来別
- エンドユーザー別
- 国別
- オーストラリア
- 中国
- インド
- インドネシア
- 日本
- マレーシア
- ニュージーランド
- 韓国
- タイ
- ベトナム
- その他のアジア太平洋
- 欧州
- 由来別
- エンドユーザー別
- 国別
- ベルギー
- フランス
- ドイツ
- イタリア
- オランダ
- ロシア
- スペイン
- トルコ
- 英国
- その他の欧州
- 中東
- 由来別
- エンドユーザー別
- 国別
- イラン
- サウジアラビア
- アラブ首長国連邦
- その他の中東
- 北米
- 由来別
- エンドユーザー別
- 国別
- カナダ
- メキシコ
- 米国
- その他の北米
- 南米
- 由来別
- エンドユーザー別
- 国別
- アルゼンチン
- ブラジル
- その他の南米
- アフリカ
第5章 競合情勢
- 主要な戦略動向
- 市場シェア分析
- 企業情勢
- 企業プロファイル.
- Archer Daniels Midland Company
- Arla Foods amba
- Bunge Limited
- Cargill Incorporated
- Corbion Biotech, Inc.
- Darling Ingredients Inc.
- Fonterra Co-operative Group Limited
- FUJI OIL HOLDINGS INC.
- Gelita AG
- Glanbia PLC
- Groupe LACTALIS
- Hilmar Cheese Company, Inc.
- Ingredion Incorporated
- International Flavors & Fragrances Inc.
- Kerry Group PLC
- Roquette Frere
- Royal FrieslandCampina N.V
- Sudzucker AG
- Wilmar International Ltd
第6章 CEOへの主な戦略的質問
第7章 付録
- 世界概要
- 概要
- ファイブフォース分析フレームワーク
- 世界のバリューチェーン分析
- 市場力学(DROs)
- 情報源と参考文献
- 図表一覧
- 主要洞察
- データパック
- 用語集
The Protein Market size is estimated at 28.32 billion USD in 2025, and is expected to reach 36.69 billion USD by 2030, growing at a CAGR of 5.31% during the forecast period (2025-2030).
Sustainable alternative protein sources boosting market demand with applications mostly in the food and beverages segment
- Both in terms of value and volume, food and beverages remained the dominant end-user segment of the market in 2023. The demand was mainly led by dairy and meat alternative applications, with consumers demanding plant-based protein-rich alternatives. In 2023, the meat and dairy alternatives industries together held a share of 40.74% by value. The high preference for plant protein has consumers shifting away from meat, which is a major driving factor for the demand. As of 2023, 2.6 million people in Europe were vegan, representing 3.2% of the European population. They were seeking meat and dairy alternatives with higher protein content.
- The food and beverage segment was closely followed by the animal feed segment in terms of applications of plant protein types. The plant protein type holds an 89% share by value among all other proteins used in the animal feed segment. It offers numerous advantages over milk substitutes and fish meals, like better protein digestibility, a favorable amino acid profile, and long shelf life. The segment is anticipated to register a value CAGR of 4.64% from 2024 to 2029.
- In terms of growth, the personal care and cosmetics segment outpaced other segments and is expected to record a CAGR of 6.41% by value from 2024 to 2029 due to increased interest in clean and natural personal care products. Proteins are used in a range of cosmetics products, including gels, shampoos, conditioners, and creams. Proteins naturally found in the body, such as collagen, elastin, and keratin, are also gaining popularity, considering their higher efficacy in naturally strengthening skin and hair. Protein ingredients have proven effects on skin and hair, which is boosting their demand in the personal care and cosmetics segment.
The increasing demand for plant-based meats is fueling the consumption of protein in North America
- Consumers are looking for healthier snack alternatives, giving a larger landscape for the growth of protein-fortified foods. Around 60% of global consumers were more aware of mindful snacking in 2023 (up 4% points from the prior year), while 61% always looked for healthier alternatives to snacks (up 7% points). Across North America, Latin America, Europe, and Asia, a healthier lifestyle is the predominant reason for opting for better-for-you snacks.
- North America remained the largest consumer of protein across the world, largely driven by the United States. The rising production of various raw materials for protein ingredients and changing consumer perceptions impact the market. For instance, the United States produced about 226.6 billion pounds of milk for human consumption in 2023.
- Asia-Pacific was the second-largest market in 2023, driven by consumer demand for diverse protein sources. The shift in consumer preferences toward plant-based options had a significant impact. It had an abundant supply of raw materials required for plant protein production, making it a relatively cost-effective option for manufacturers and consumers. Asia-Pacific is projected to register a value CAGR of 5.42% during 2024-2029.
- The Middle East is projected to be the fastest-growing market, as the demand for natural and sustainable ingredients is rapidly growing due to the rise in health consciousness. The region is set to record a CAGR of 5.57% by volume during 2024-2029. This is attributed to shifting consumer preferences toward more health-, immunity-boosting, less processed, and 'free-from' food products. In 2022, approximately 25% of Arab millennials sought convenient and easily accessible food products.
Global Protein Market Trends
Consumption and usage of animal protein in cosmetics and nutricosmetics are supporting the market's growth globally
- Global consumption of animal protein is experiencing substantial growth, with dairy products representing a significant and expanding segment. Increasing awareness about the health benefits of dairy proteins, especially among athletes, is fueling global per capita animal protein consumption. For instance, in India, from 2022 to 2023, a considerable population of 37% of Indian consumers reported an average daily milk intake of 1.5 to 2 liters, while a further 10% consumed over 3 liters per day. These figures highlight the high per capita consumption levels in certain regions and underscore the substantial demand for animal protein globally.
- Further, the global consumption of animal protein remains significant, with poultry representing a major component. For instance, protein availability from beef, pork, poultry, and sheep meat is projected to grow by 5.9%, 13.1%, 17.8%, and 15.7%, respectively, by 2030. This substantial volume growth highlights the scale of global demand for animal-based protein sources and the poultry industry's considerable role in meeting this demand. Furthermore, beef, pork, and poultry are substantially consumed, highlighting animal protein consumption patterns.
- Beyond traditional food applications, the increasing demand for animal-derived proteins, like collagen and gelatin, from the pharmaceutical, personal care, and nutraceutical industries is significantly boosting the market's growth. For instance, proteins like collagen and gelatin are extensively used in cosmetics and nutraceuticals. Owing to the rising demand for collagen and gelatin animal proteins in different applications, they are anticipated to register a CAGR of 6.07% and 4.70%, respectively, during the forecast period.
Dairy ingredients play a significant role in supplying animal protein raw materials
- Whey and casein protein production primarily hinges on supply from cheese production plants, as these proteins are major byproducts of cheese. For caseins and caseinates, a price point of approximately USD 2.40 per pound is essential to motivate domestic plants to shift fluid skim milk from non-fat dry milk production to casein production. Between 2023 and 2024, global cheese production reached 22.2 million metric tons, influencing the production landscape for dairy proteins like casein, caseinates, and whey proteins. The United States produced 5,584,857 tons of cheese annually, leading the world.
- In the United States, milk ingredient manufacturers have increasingly specialized in milk protein production and witnessed a doubling in production in 2023, spurred by the introduction of micellar casein concentrate ingredients. Micellar casein, with its 90% undenatured protein content and elevated bioavailable calcium levels, is expected to achieve notable market penetration between 2019-2029. The rising demand for dairy-based proteins is largely attributed to the search for ingredients with higher protein concentrations.
- Pork, known for its amino acid profile, is the raw material for gelatin production. France, with an annual production of 23 million pigs, plays a pivotal role. The nation's meat processing industry, employing over 100,000 professionals, ranks as Europe's second-largest. Following pork, buffalo and cattle emerge as key raw materials, bolstering gelatin and collagen protein production. India has the global lead in cattle and buffalo numbers and reported its national cattle herd at 307.6 million head in 2023, a slight increase from the USDA's estimate of 307.5 million head.
Protein Industry Overview
The Protein Market is fragmented, with the top five companies occupying 23.09%. The major players in this market are Archer Daniels Midland Company, Fonterra Co-operative Group Limited, International Flavors & Fragrances Inc., Kerry Group PLC and Royal FrieslandCampina N.V (sorted alphabetically).
Additional Benefits:
- The market estimate (ME) sheet in Excel format
- 3 months of analyst support
TABLE OF CONTENTS
1 EXECUTIVE SUMMARY & KEY FINDINGS
2 INTRODUCTION
- 2.1 Study Assumptions & Market Definition
- 2.2 Scope of the Study
- 2.3 Research Methodology
3 KEY INDUSTRY TRENDS
- 3.1 End User Market Volume
- 3.1.1 Baby Food and Infant Formula
- 3.1.2 Bakery
- 3.1.3 Beverages
- 3.1.4 Breakfast Cereals
- 3.1.5 Condiments/Sauces
- 3.1.6 Confectionery
- 3.1.7 Dairy and Dairy Alternative Products
- 3.1.8 Elderly Nutrition and Medical Nutrition
- 3.1.9 Meat/Poultry/Seafood and Meat Alternative Products
- 3.1.10 RTE/RTC Food Products
- 3.1.11 Snacks
- 3.1.12 Sport/Performance Nutrition
- 3.1.13 Animal Feed
- 3.1.14 Personal Care and Cosmetics
- 3.2 Protein Consumption Trends
- 3.2.1 Animal
- 3.2.2 Plant
- 3.3 Production Trends
- 3.3.1 Animal
- 3.3.2 Plant
- 3.4 Regulatory Framework
- 3.4.1 Australia
- 3.4.2 Brazil and Argentina
- 3.4.3 Canada
- 3.4.4 China
- 3.4.5 France
- 3.4.6 Germany
- 3.4.7 India
- 3.4.8 Italy
- 3.4.9 Japan
- 3.4.10 South Africa
- 3.4.11 UAE and Saudi Arabia
- 3.4.12 United Kingdom
- 3.4.13 United States
- 3.5 Value Chain & Distribution Channel Analysis
4 MARKET SEGMENTATION (includes market size in Value in USD and Volume, Forecasts up to 2030 and analysis of growth prospects)
- 4.1 Source
- 4.1.1 Animal
- 4.1.1.1 By Protein Type
- 4.1.1.1.1 Casein and Caseinates
- 4.1.1.1.2 Collagen
- 4.1.1.1.3 Egg Protein
- 4.1.1.1.4 Gelatin
- 4.1.1.1.5 Insect Protein
- 4.1.1.1.6 Milk Protein
- 4.1.1.1.7 Whey Protein
- 4.1.1.1.8 Other Animal Protein
- 4.1.2 Microbial
- 4.1.2.1 By Protein Type
- 4.1.2.1.1 Algae Protein
- 4.1.2.1.2 Mycoprotein
- 4.1.3 Plant
- 4.1.3.1 By Protein Type
- 4.1.3.1.1 Hemp Protein
- 4.1.3.1.2 Pea Protein
- 4.1.3.1.3 Potato Protein
- 4.1.3.1.4 Rice Protein
- 4.1.3.1.5 Soy Protein
- 4.1.3.1.6 Wheat Protein
- 4.1.3.1.7 Other Plant Protein
- 4.1.1 Animal
- 4.2 End User
- 4.2.1 Animal Feed
- 4.2.2 Food and Beverages
- 4.2.2.1 By Sub End User
- 4.2.2.1.1 Bakery
- 4.2.2.1.2 Beverages
- 4.2.2.1.3 Breakfast Cereals
- 4.2.2.1.4 Condiments/Sauces
- 4.2.2.1.5 Confectionery
- 4.2.2.1.6 Dairy and Dairy Alternative Products
- 4.2.2.1.7 Meat/Poultry/Seafood and Meat Alternative Products
- 4.2.2.1.8 RTE/RTC Food Products
- 4.2.2.1.9 Snacks
- 4.2.3 Personal Care and Cosmetics
- 4.2.4 Supplements
- 4.2.4.1 By Sub End User
- 4.2.4.1.1 Baby Food and Infant Formula
- 4.2.4.1.2 Elderly Nutrition and Medical Nutrition
- 4.2.4.1.3 Sport/Performance Nutrition
- 4.3 Region
- 4.3.1 Africa
- 4.3.1.1 By Source
- 4.3.1.2 By End User
- 4.3.1.3 By Country
- 4.3.1.3.1 Nigeria
- 4.3.1.3.2 South Africa
- 4.3.1.3.3 Rest of Africa
- 4.3.2 Asia-Pacific
- 4.3.2.1 By Source
- 4.3.2.2 By End User
- 4.3.2.3 By Country
- 4.3.2.3.1 Australia
- 4.3.2.3.2 China
- 4.3.2.3.3 India
- 4.3.2.3.4 Indonesia
- 4.3.2.3.5 Japan
- 4.3.2.3.6 Malaysia
- 4.3.2.3.7 New Zealand
- 4.3.2.3.8 South Korea
- 4.3.2.3.9 Thailand
- 4.3.2.3.10 Vietnam
- 4.3.2.3.11 Rest of Asia-Pacific
- 4.3.3 Europe
- 4.3.3.1 By Source
- 4.3.3.2 By End User
- 4.3.3.3 By Country
- 4.3.3.3.1 Belgium
- 4.3.3.3.2 France
- 4.3.3.3.3 Germany
- 4.3.3.3.4 Italy
- 4.3.3.3.5 Netherlands
- 4.3.3.3.6 Russia
- 4.3.3.3.7 Spain
- 4.3.3.3.8 Turkey
- 4.3.3.3.9 United Kingdom
- 4.3.3.3.10 Rest of Europe
- 4.3.4 Middle East
- 4.3.4.1 By Source
- 4.3.4.2 By End User
- 4.3.4.3 By Country
- 4.3.4.3.1 Iran
- 4.3.4.3.2 Saudi Arabia
- 4.3.4.3.3 United Arab Emirates
- 4.3.4.3.4 Rest of Middle East
- 4.3.5 North America
- 4.3.5.1 By Source
- 4.3.5.2 By End User
- 4.3.5.3 By Country
- 4.3.5.3.1 Canada
- 4.3.5.3.2 Mexico
- 4.3.5.3.3 United States
- 4.3.5.3.4 Rest of North America
- 4.3.6 South America
- 4.3.6.1 By Source
- 4.3.6.2 By End User
- 4.3.6.3 By Country
- 4.3.6.3.1 Argentina
- 4.3.6.3.2 Brazil
- 4.3.6.3.3 Rest of South America
- 4.3.1 Africa
5 COMPETITIVE LANDSCAPE
- 5.1 Key Strategic Moves
- 5.2 Market Share Analysis
- 5.3 Company Landscape
- 5.4 Company Profiles (includes Global Level Overview, Market Level Overview, Core Business Segments, Financials, Headcount, Key Information, Market Rank, Market Share, Products and Services, and Analysis of Recent Developments).
- 5.4.1 Archer Daniels Midland Company
- 5.4.2 Arla Foods amba
- 5.4.3 Bunge Limited
- 5.4.4 Cargill Incorporated
- 5.4.5 Corbion Biotech, Inc.
- 5.4.6 Darling Ingredients Inc.
- 5.4.7 Fonterra Co-operative Group Limited
- 5.4.8 FUJI OIL HOLDINGS INC.
- 5.4.9 Gelita AG
- 5.4.10 Glanbia PLC
- 5.4.11 Groupe LACTALIS
- 5.4.12 Hilmar Cheese Company, Inc.
- 5.4.13 Ingredion Incorporated
- 5.4.14 International Flavors & Fragrances Inc.
- 5.4.15 Kerry Group PLC
- 5.4.16 Roquette Frere
- 5.4.17 Royal FrieslandCampina N.V
- 5.4.18 Sudzucker AG
- 5.4.19 Wilmar International Ltd
6 KEY STRATEGIC QUESTIONS FOR PROTEIN INGREDIENTS INDUSTRY CEOS
7 APPENDIX
- 7.1 Global Overview
- 7.1.1 Overview
- 7.1.2 Porter's Five Forces Framework
- 7.1.3 Global Value Chain Analysis
- 7.1.4 Market Dynamics (DROs)
- 7.2 Sources & References
- 7.3 List of Tables & Figures
- 7.4 Primary Insights
- 7.5 Data Pack
- 7.6 Glossary of Terms

