|
|
市場調査レポート
商品コード
1288947
農業用生物製剤の世界市場の主な動向:農業用生物製剤、生物防除剤、生物殺菌剤、生物殺虫剤、生物殺線虫剤、バイオスティミュラント、バイオ肥料、接種剤、フェロモン、バイオ種子処理 - 地域別の将来予測 (2028年まで)Top Trends in the Agricultural Biologicals Market by Agricultural Biologicals, Biocontrols, Bio fungicides, Bioinsecticides, Bio nematicides, Biostimulants, Biofertilizers, Inoculants, Pheromones, Biological Seed Treatment - Global Forecast to 2028 |
||||||
|
|
|||||||
カスタマイズ可能
|
|||||||


| 農業用生物製剤の世界市場の主な動向:農業用生物製剤、生物防除剤、生物殺菌剤、生物殺虫剤、生物殺線虫剤、バイオスティミュラント、バイオ肥料、接種剤、フェロモン、バイオ種子処理 - 地域別の将来予測 (2028年まで) |
|
出版日: 2023年06月02日
発行: MarketsandMarkets
ページ情報: 英文 356 Pages
納期: 即納可能
|

- 全表示
- 概要
- 目次
世界の農業用生物製剤の市場規模は、2023年の147億米ドルから13.7%のCAGRで成長し、2028年には279億米ドルに達すると予測されます。
農業用生物製剤の市場は、いくつかの要因によって近年著しい成長を遂げています。主な要因の1つは、持続可能な農法に対する需要の高まりと、農業での合成化学物質の使用を削減する必要性です。農業用生物製剤は、一般的に生分解性が高く、生態系への悪影響が少ないため、より環境に優しい選択肢となります。農業用生物製剤市場の成長に寄与するもう一つの要因は、農業用生物製剤の利点に対する農家の意識が高まっていることです。農業用生物製剤は、作物の収量を向上させ、栄養分の吸収を促進し、植物の成長を促し、害虫や病気から自然に保護することができます。さらに、農業用生物製剤は、土壌の健康状態を改善し、全体的に持続可能な農法を促進するのに役立ちます。農業用生物製剤の市場には、生物農薬、バイオ肥料、生物刺激剤、その他の微生物ベースの製品など、さまざまな製品が含まれます。生物農薬は害虫や病気の管理に使用され、生物肥料は有益な栄養素で土壌を豊かにするのに役立ちます。一方、バイオ肥料は、植物の成長と発達を促進するために使用されます。
"生物殺線虫剤市場は予測期間中に最も高い成長率で成長する"
生物殺線虫剤市場は、予測期間中に最も高い成長率を示すと予測されています。生物殺線虫剤は、農業における線虫の蔓延を制御・管理するために特別に処方された生物農薬の一種です。線虫は、植物の根を食害し、栄養の吸収を阻害し、病気を媒介することによって、作物に大きなダメージを与える可能性がある微細な虫です。生物殺線虫剤市場の予想成長には、いくつかの要因が寄与しています。まず第一に、従来の化学的な殺線虫剤が環境と健康に与える影響に対する懸念が高まっています。このような化学薬品ベースの薬剤は土壌中に残留することが多く、水質汚染や非標的生物への有害な影響につながります。
"生物防除剤市場は、予測期間中、農業用生物製剤の中で最大のサブカテゴリーとなる"
生物防除剤市場は、予測期間中、農業用生物製剤の中で最大のサブカテゴリー市場になると予測されています。生物防除剤とは、農業における害虫、病気、雑草を管理するために、有益な生物から得られる天然物質を使用することを指します。生物防除剤は、従来の化学農薬や除草剤に代わる、環境に優しく持続可能な方法です。さらに、従来の農薬に対する規制の強化が、生物防除剤の採用を後押ししています。多くの国では、環境に悪影響を与えるとして、より厳しい規制を実施し、特定の化学農薬の使用を段階的に廃止しています。このような規制状況は、生物防除剤が注目され、市場シェアを拡大する上で有利な市場情勢を作り出しています。
"バイオスティミュラント市場では、2023年に欧州が最大の市場となる"
バイオスティミュラント市場における欧州の優位性には、いくつかの要因があります。まず、欧州は持続可能な農業と環境スチュワードシップに強い関心を寄せています。同地域では、有機農法への移行や農業における化学物質の投入量の削減が顕著に見られます。バイオスティミュラントは、作物を強化するための自然で環境に優しいアプローチを提供するため、こうした持続可能な農業の目標によく合致しています。さらに、欧州ではバイオスティミュラントに対する規制の枠組みが整っています。欧州連合(EU)は、バイオスティミュラント製品の安全性と有効性を確保するために、特定の規制とガイドラインを制定しています。この規制の明確さは、製造業者や農家に信頼をもたらし、この地域におけるバイオスティミュラント製品の開発、登録、商業化を促進します。
目次
第1章 イントロダクション
第2章 調査手法
第3章 エグゼクティブサマリー
第4章 重要考察
第5章 市場概要
- イントロダクション
- マクロ経済指標
- 市場力学
- 特許分析
- バイオスティミュラントの特許分析
- 規制の枠組み
- サプライチェーン分析
- バリューチェーン分析
第6章 農業用生物製剤
- 概要
- 競合情勢
- 企業評価クアドラント:主要企業
- 製品のフットプリント
- 地域別の市場分析
第7章 生物防除剤
- 概要
- 競合情勢
- 企業評価クアドラント:主要企業
- 製品のフットプリント
- 地域別の市場分析
第8章 バイオ肥料
- 概要
- 競合情勢
- 企業評価クアドラント:主要企業
- 地域別の市場分析
第9章 バイオスティミュラント
- 概要
- 競合情勢
- 製品のフットプリント
- 市場シェア分析
- 地域別の市場分析
第10章 生物殺虫剤
- 概要
- 競合情勢
- 競合リーダーシップマッピング
- 企業ランキング分析 (2022年)
- 地域別の市場分析
第11章 生物殺菌剤
- 概要
- 競合情勢
- 競合リーダーシップマッピング
- 地域別の市場分析
第12章 生物殺線虫剤
- 概要
- 競合情勢
- 地域別の市場分析
第13章 バイオ種子処理
- 概要
- 競合情勢
- 企業評価クアドラント
- 製品のフットプリント
- 地域別の市場分析
第14章 農業用接種剤
- 概要
- 主要企業が採用した戦略
- 企業評価クアドラント:主要企業
- 製品のフットプリント
- 市場シェア分析
- 地域別の市場分析
第15章 農業用フェロモン
- 概要
- 競合情勢
- 企業評価クアドラント
- 地域別の市場分析
第16章 企業プロファイル
- 主要企業
- BASF SE
- BAYER AG
- SYNGENTA AG
- NOVOZYMES
- UPL
- CORTEVA AGRISCIENCE
- FMC CORPORATION
- PRO FARM GROUP INC.
- LALLEMAND INC.
- VEGALAB SA
- VALENT BIOSCIENCES LLC
- KOPPERT
- STOCKTON BIO-AG
- IPL BIOLOGICALS LIMITED
- CERTIS USA LLC
- GOWAN COMPANY
- KAN BIOSYS
- SYMBORG
- RIZOBACTER
- BIOMAX NATURALS
- BIOBEST GROUP NV
- AGRILIFE
- HAIFA NEGEV TECHNOLOGIES LTD
- PIVOT BIO
- PRECISION LABORATORIES LLC
第17章 付録
The agricultural biologicals market is projected to grow at a CAGR of 13.7% from an estimated value of USD 14.7 billion in 2023 to reach USD 27.9 billion by 2028. The market for agriculture biologicals has been experiencing significant growth in recent years due to several factors. One of the key drivers is the increasing demand for sustainable agricultural practices and the need to reduce the use of synthetic chemicals in farming. Agriculture biologicals offer a more environmentally friendly alternative, as they are typically biodegradable and have minimal negative impact on ecosystems. Another factor contributing to the growth of the agriculture biologicals market is the rising awareness among farmers about the benefits of these products. They can improve crop yields, enhance nutrient uptake, stimulate plant growth, and provide natural protection against pests and diseases. Additionally, agriculture biologicals can help in improving soil health and promoting overall sustainable farming practices. The market for agriculture biologicals encompasses a wide range of products, including biopesticides, biofertilizers, biostimulants, and other microbial-based products. Biopesticides are used for pest and disease management, while biofertilizers help in enriching the soil with beneficial nutrients. Biostimulants, on the other hand, are used to enhance plant growth and development.
"Bionematicides market to grow at the highest rate during the forecast period."
The bionematicides market is projected to experience the highest growth rate during the forecast period. Bionematicides are a type of biopesticide specifically formulated to control and manage nematode infestations in agriculture. Nematodes are microscopic worms that can cause significant damage to crops by feeding on plant roots, impairing nutrient uptake, and transmitting diseases. Several factors contribute to the anticipated growth of the bionematicides market. First and foremost, there is a growing concern regarding the environmental and health impacts of conventional chemical nematicides. These chemical-based solutions often persist in the soil, leading to water contamination and detrimental effects on non-target organisms.
"Biocontrols market to be the largest subcategory market among agricultural biologicals during the forecast period."
The biocontrols market is projected to emerge as the largest subcategory market within the agriculture biologicals sector during the forecast period. Biocontrols refer to the use of beneficial living organisms or natural substances derived from them to manage pests, diseases, and weeds in agriculture. They offer an environmentally friendly and sustainable alternative to conventional chemical pesticides and herbicides. Furthermore, increasing regulatory restrictions on conventional pesticides are driving the adoption of biocontrols. Many countries are implementing stricter regulations and phasing out the use of certain chemical pesticides due to their negative environmental impacts. This regulatory environment creates a favorable market landscape for biocontrols to gain prominence and market share.
"In the biostimulants market, Europe is estimated to be the largest market in 2023."
Several factors contribute to Europe's dominance in the biostimulant market. Firstly, Europe has a strong focus on sustainable agriculture and environmental stewardship. The region has witnessed a significant shift towards organic farming practices and the reduction of chemical inputs in agriculture. Biostimulants align well with these sustainable farming goals, as they offer a natural and eco-friendly approach to crop enhancement. Additionally, Europe has a favorable regulatory framework for biostimulants. The European Union (EU) has established specific regulations and guidelines for biostimulant products, ensuring their safety and efficacy. This regulatory clarity provides confidence to manufacturers and farmers, facilitating the development, registration, and commercialization of biostimulant products in the region.
The top trends in the agricultural biologicals market are segmented market-wise, with a detailed analysis of each market by studying the individual competitive landscapes.
Breakdown of the profile of primary participants is as follows:
- By Company Type: Tier 1 - 60 %, Tier 2 - 20%, and Tier 3 - 20%
- By Designation: CXOs - 50%, Managers - 30%, and Executives - 20%
- By Region: Asia Pacific - 50%, Europe - 20%, North America - 20%, and RoW - 10%
Leading players profiled in this report
- BASF SE (Germany)
- Bayer AG (Germany)
- Syngenta AG (Switzerland)
- Novozymes (Denmark)
- UPL (India)
- Corteva Agriscience (US)
- FMC Corporation (US)
- Pro Farm Group Inc. (US)
- Lallemand Inc. (Canada)
- Vegalab SA (Switzerland)
- Valent BioSciences LLC (US)
- Koppert (Netherlands)
- Stockton bio-ag (Israel)
- IPL Biologicals Limited (India)
- Certis USA LLC (US)
- Gowan Company (US)
- Kan Biosys (India)
- Symborg (Spain)
- Rizobacter (Argentina)
- Biomax Naturals (Mumbai)
- Biobest Group NV (Belgium)
- AgriLife (India)
- Haifa Negev Technologies Ltd (Israel)
- Pivot Bio (California)
- Precision Laboratories LLC (US)
Research Coverage
This report segments the agricultural biologicals market on the basis of key trends. In terms of insights, this research report focuses on various levels of analyses-competitive landscape, end-use analysis, and company profiles-which together comprise and discuss the basic views on the emerging & high-growth segments of the agricultural biologicals industry, the high-growth regions, countries, government initiatives, market disruption, drivers, restraints, opportunities, and challenges.
Reasons to buy this report
- To get a comprehensive overview of the agricultural biologicals market
- To gain wide-ranging information about the top players in this industry, their product portfolios, and key strategies adopted by them
- To gain insights about the major countries/regions, in which the agricultural biologicals market is flourishing
The report will help the market leaders/new entrants in this market with information on the closest approximations of the revenue numbers for the overall top trends in agricultural biologicals market and the subsegments. This report will help stakeholders understand the competitive landscape and gain more insights to position their businesses better and to plan suitable go-to-market strategies. The report also helps stakeholders understand the pulse of the market and provides them with information on key market drivers, restraints, challenges, and opportunities.
The report provides insights on the following pointers:
- Analysis of key drivers (Initiatives by government agencies and increasing awareness about the need for sustainability in modern agriculture), restraints (Technological and environmental constraints for the use of biologicals), opportunity (Advancements in microbial research across the globe), and challenges (Lack of awareness & low adoption rate of biologicals) influencing the growth of the top trends in agricultural biologicals market.
- Product Development/Innovation: Detailed insights on upcoming technologies, research & development activities, and new product & service launches in the top trends in agricultural biologicals market.
- Market Development: Comprehensive information about lucrative markets - the report analyses the top trends in agricultural biologicals market across varied regions.
- Market Diversification: Exhaustive information about new products & services, untapped geographies, recent developments, and investments in the top trends in agricultural biologicals market.
- Competitive Assessment: In-depth assessment of market shares, growth strategies and service offerings of leading players Syngenta AG (Switzerland), UPL Limited (India), Nufarm (US), Corteva Agriscience (US), BASF SE (Germany), and Novozymes (Denmark) are among others in the top trends in agricultural biologicals market strategies.
TABLE OF CONTENTS
1 INTRODUCTION
- 1.1 STUDY OBJECTIVES
- 1.2 COMPETITIVE INTELLIGENCE
- 1.3 MARKET DEFINITION
- 1.4 YEARS CONSIDERED
- 1.5 CURRENCY CONSIDERED
- TABLE 1 USD EXCHANGE RATE, 2019-2022
- 1.6 STAKEHOLDERS
- 1.7 SUMMARY OF CHANGES
- 1.8 RECESSION IMPACT ANALYSIS
2 RESEARCH METHODOLOGY
- 2.1 RESEARCH DATA
- FIGURE 1 TOP 10 TRENDS IN AGRICULTURAL BIOLOGICALS MARKET: RESEARCH DESIGN
- 2.1.1 SECONDARY DATA
- 2.1.1.1 Key data from secondary sources
- 2.1.2 PRIMARY DATA
- 2.1.2.1 Breakdown of primaries
- 2.1.2.2 Key primary insights
- 2.2 MARKET SIZE ESTIMATION
- 2.2.1 APPROACH ONE: BOTTOM-UP APPROACH
- 2.2.2 APPROACH TWO: TOP-DOWN APPROACH (BASED ON GLOBAL MARKET)
- 2.3 DATA TRIANGULATION
- FIGURE 2 DATA TRIANGULATION METHODOLOGY
- 2.4 STUDY ASSUMPTIONS
- 2.5 STUDY LIMITATIONS AND RISK ASSESSMENT
- 2.6 RECESSION IMPACT ANALYSIS
- 2.6.1 MACROINDICATORS OF RECESSION
- FIGURE 3 INDICATORS OF RECESSION
- FIGURE 4 WORLD INFLATION RATE, 2011-2021
- FIGURE 5 GLOBAL GDP, 2011-2021 (USD TRILLION)
3 EXECUTIVE SUMMARY
- FIGURE 6 GLOBAL AGRICULTURAL BIOLOGICALS MARKET, 2021-2028 (USD MILLION)
- FIGURE 7 INCREASING DEMAND FOR BIOCONTROL TO DRIVE MARKET GROWTH
- FIGURE 8 SNAPSHOT: NORTH AMERICA TO ACCOUNT FOR LARGEST MARKET SHARE
4 PREMIUM INSIGHTS
- 4.1 OPPORTUNITIES FOR KEY PLAYERS OPERATING IN MARKET
- FIGURE 9 SHIFT TOWARD SUSTAINABLE AGRICULTURE TO DRIVE MARKET GROWTH
- 4.2 AGRICULTURAL BIOLOGICALS MARKET, BY FUNCTION
- FIGURE 10 BIOCONTROLS: LARGEST SEGMENT IN MARKET
- 4.3 NORTH AMERICA: AGRICULTURAL BIOLOGICALS MARKET, BY KEY FUNCTION & COUNTRY
- FIGURE 11 BIOCONTROL ESTIMATED TO DOMINATE AGRICULTURAL BIOLOGICALS MARKET IN 2023
- 4.4 AGRICULTURAL BIOLOGICALS MARKET, BY FUNCTION AND REGION
- FIGURE 12 EUROPE TO ACCOUNT FOR LARGEST MARKET SHARE FOR BIOSTIMUL ANTS IN 2023
5 MARKET OVERVIEW
- 5.1 INTRODUCTION
- 5.2 MACROECONOMIC INDICATORS
- 5.2.1 INTRODUCTION
- 5.2.2 INCREASE IN ORGANIC AGRICULTURAL FARM AREAS
- FIGURE 13 GROWTH OF ORGANIC AGRICULTURAL LAND FROM 1999 TO 2019
- 5.2.3 GROWING DEMAND FROM ORGANIC FOOD INDUSTRY
- FIGURE 14 ORGANIC RETAIL SALES, BY COUNTRY, 2019
- 5.2.4 HIGH COSTS ASSOCIATED WITH DEVELOPMENT OF SYNTHETIC CROP PROTECTION PRODUCTS
- FIGURE 15 REDUCED INTRODUCTION OF NEW ACTIVE INGREDIENTS, 1950-2010
- 5.2.5 CLIMATE CHANGE AND INCREASE IN ABIOTIC STRESSES ON PLANTS
- 5.3 MARKET DYNAMICS
- FIGURE 16 TOP TRENDS IN AGRICULTURAL BIOLOGICALS MARKET
- 5.3.1 DRIVERS
- 5.3.1.1 Initiatives by government agencies and increasing awareness of sustainability in modern agriculture
- 5.3.1.2 Regulatory pressures and harmful effects associated with synthetic plant protection products
- 5.3.1.3 Growing preference for organic products
- FIGURE 17 EUROPE: ORGANIC MARKET SHARE, BY COUNTRY, 2018 VS. 2019
- 5.3.1.4 Limited entry barriers resulting in entry of several players
- 5.3.1.5 Hazards of using chemical fertilizers
- 5.3.1.6 Strong demand for high-value cash crops
- FIGURE 18 AREA HARVESTED FOR FRUIT & VEGETABLE CROPS, 2015-2019 (MILLION HECTARE)
- 5.3.1.7 Crop losses due to pest attacks
- 5.3.2 RESTRAINTS
- 5.3.2.1 Technological and environmental constraints in use of biologicals
- 5.3.2.2 Poor infrastructure & high initial investment
- 5.3.2.3 Commercialization of low-quality biological products
- 5.3.2.4 Short shelf-life of biopesticides
- 5.3.3 OPPORTUNITIES
- 5.3.3.1 Advancements in microbial research
- 5.3.3.2 New target markets: Asia Pacific & Africa
- 5.3.3.3 Need for development of broad-spectrum formulations in agricultural biologicals
- 5.3.3.4 Rapid growth in biocontrol seed treatment solutions
- 5.3.4 CHALLENGES
- 5.3.4.1 Lack of awareness & low adoption rate of biologicals
- 5.3.4.2 Supply of counterfeit and less-effective products
- 5.3.4.3 Prevalence of uncertainty on regulatory framework of agricultural biologicals
- 5.3.4.4 High preference for agrochemicals among farmers
- 5.4 PATENT ANALYSIS
- 5.4.1 PATENT ANALYSIS FOR BIOFERTILIZERS MARKET
- FIGURE 19 PATENTS GRANTED FOR BIOFERTILIZERS MARKET, 2012-2022
- FIGURE 20 REGIONAL ANALYSIS OF PATENT GRANTED FOR BIOFERTILIZERS MARKET, 2012-2022
- TABLE 2 PATENTS PERTAINING TO BIOFERTILIZERS, 2020-2022
- 5.4.2 PATENT ANALYSIS FOR BIOPESTICIDES MARKET
- FIGURE 21 NUMBER OF PATENTS APPROVED FOR BIOPESTICIDE STRAINS IN MARKET, 2012-2020
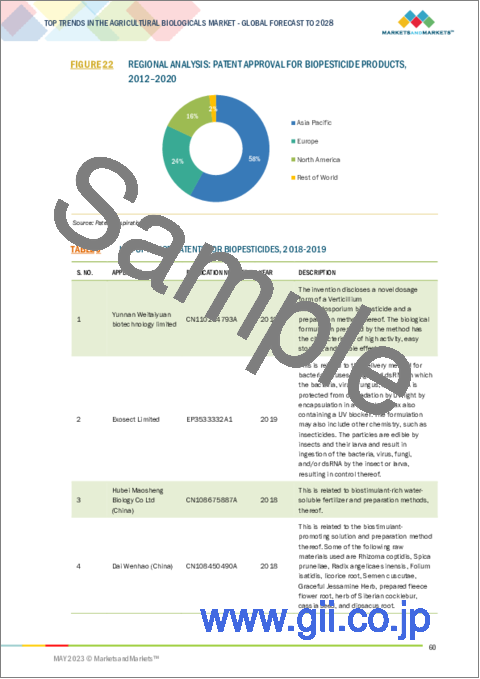
- FIGURE 22 REGIONAL ANALYSIS: PATENT APPROVAL FOR BIOPESTICIDE PRODUCTS, 2012-2020
- TABLE 3 LIST OF MAJOR PATENTS FOR BIOPESTICIDES, 2018-2019
- 5.5 PATENT ANALYSIS FOR BIOSTIMULANTS
- FIGURE 23 NUMBER OF PATENTS APPROVED BETWEEN 2011 AND 2021
- FIGURE 24 REGIONS WITH HIGHEST NUMBER OF PATENT APPROVALS, 2016-2022
- TABLE 4 LIST OF MAJOR PATENTS, 2012-2021
- 5.6 REGULATORY FRAMEWORK
- 5.6.1 REGULATORY FRAMEWORK FOR BIOPESTICIDES
- 5.6.1.1 US
- 5.6.1.1.1 Main statutes and legal requirements
- 5.6.1.1.1.1 Federal insecticide, fungicide, and rodenticide act (FIFRA)
- 5.6.1.1.1.2 Federal food, drug, and cosmetic act (FFDCA) and the food quality protection act (FQPA)
- 5.6.1.1.1.3 Pesticide registration improvement extension act (PRIA 3), 2012
- 5.6.1.1.1.4 Biopesticide registration
- 5.6.1.1.1 Main statutes and legal requirements
- 5.6.1.1 US
- 5.6.2 EUROPE
- 5.6.2.1 European union
- 5.6.2.1.1 Regulation (EC) no. 1107/2009 of European Parliament and of Council of 21 October 2009
- 5.6.2.1.1.1 Scope
- 5.6.2.1.1.2 Active substances: requirements and conditions for approval
- 5.6.2.1.2 First Approval
- 5.6.2.1.1 Regulation (EC) no. 1107/2009 of European Parliament and of Council of 21 October 2009
- 5.6.2.2 Russia
- 5.6.2.1 European union
- 5.6.3 ASIA PACIFIC
- 5.6.3.1 India
- 5.6.3.2 China
- 5.6.4 BRAZIL
- 5.6.5 REGULATORY FRAMEWORK FOR BIOSTIMULANTS
- 5.6.5.1 Austria
- 5.6.5.2 France
- 5.6.5.3 Germany
- 5.6.5.4 Italy
- 5.6.5.5 Ireland
- 5.6.5.6 Spain
- 5.6.5.7 UK
- 5.6.6 REGULATORY FRAMEWORK FOR BIOFERTILIZERS
- 5.6.6.1 North America
- 5.6.6.1.1 Canada
- 5.6.6.2 Europe
- 5.6.6.2.1 Spain
- 5.6.6.2.2 Italy
- 5.6.6.3 Asia Pacific
- 5.6.6.3.1 India
- 5.6.6.3.2 China
- 5.6.6.3.3 Taiwan
- 5.6.6.3.4 Thailand
- 5.6.6.3.5 Australia
- 5.6.6.3.6 Vietnam
- 5.6.6.3.7 Philippines
- 5.6.6.3.8 Bhutan
- 5.6.6.4 South America
- 5.6.6.4.1 Brazil
- 5.6.6.5 RoW
- 5.6.6.1 North America
- 5.6.1 REGULATORY FRAMEWORK FOR BIOPESTICIDES
- 5.7 SUPPLY CHAIN ANALYSIS
- FIGURE 25 SUPPLY CHAIN ANALYSIS
- 5.8 VALUE CHAIN ANALYSIS
- FIGURE 26 VALUE CHAIN ANALYSIS
- 5.8.1 RESEARCH & PRODUCT DEVELOPMENT
- 5.8.2 MANUFACTURING
- 5.8.3 DISTRIBUTION
- 5.8.4 MARKETING AND SALES
- 5.8.5 POST-SALES SERVICES
6 AGRICULTURAL BIOLOGICALS
- 6.1 OVERVIEW
- 6.2 COMPETITIVE LANDSCAPE
- 6.2.1 INTRODUCTION
- TABLE 5 AGRICULTURAL BIOLOGICALS MARKET: KEY STRATEGIES ADOPTED BY COMPANIES, 2018-2023
- 6.3 COMPANY EVALUATION QUADRANT (KEY PLAYERS)
- 6.3.1 STARS
- 6.3.2 EMERGING LEADERS
- 6.3.3 PERVASIVE PLAYERS
- 6.3.4 PARTICIPANTS
- FIGURE 27 AGRICULTURAL BIOLOGICALS MARKET: COMPANY EVALUATION QUADRANT, 2022 (KEY PLAYERS)
- 6.4 PRODUCT FOOTPRINT
- TABLE 6 AGRICULTURAL BIOLOGICALS: COMPANY, BY FUNCTION FOOTPRINT
- TABLE 7 AGRICULTURAL BIOLOGICALS: COMPANY, BY TYPE FOOTPRINT
- TABLE 8 AGRICULTURAL BIOLOGICALS: COMPANY, BY REGIONAL FOOTPRINT
- TABLE 9 AGRICULTURAL BIOLOGICALS: COMPANY: OVERALL FOOTPRINT
- 6.4.1 COMPETITIVE SCENARIO & TRENDS
- 6.4.1.1 Product launches & developments
- TABLE 10 AGRICULTURAL BIOLOGICALS MARKET: PRODUCT LAUNCHES & DEVELOPMENTS, 2018-APRIL 2023
- 6.4.1.2 Deals (Mergers, Agreements, Partnerships, Collaborations & Acquisitions)
- TABLE 11 AGRICULTURAL BIOLOGICALS MARKET: DEALS (MERGER, AGREEMENTS, PARTNERSHIPS, COLLABORATIONS & ACQUISITION), 2018-APRIL 2023
- 6.4.1.3 Others (Expansions & Investments)
- TABLE 12 AGRICULTURAL BIOLOGICALS MARKET: EXPANSIONS & INVESTMENTS, 2018-APRIL 2023
- 6.4.2 COMPANY MARKET SHARE ANALYSIS
- TABLE 13 AGRICULTURAL BIOLOGICALS MARKET: DEGREE OF COMPETITION
- 6.5 REGIONAL MARKET ANALYSIS
- TABLE 14 AGRICULTURAL BIOLOGICALS MARKET, BY REGION, 2018-2022 (USD MILLION)
- TABLE 15 AGRICULTURAL BIOLOGICALS MARKET, BY REGION, 2023-2028 (USD MILLION)
7 BIOCONTROLS
- 7.1 OVERVIEW
- 7.2 COMPETITIVE LANDSCAPE
- 7.2.1 INTRODUCTION
- TABLE 16 BIOCONTROLS MARKET: KEY STRATEGIES ADOPTED BY COMPANIES, JANUARY 2018-APRIL 2023
- 7.3 COMPANY EVALUATION QUADRANT (KEY PLAYERS)
- 7.3.1 STARS
- 7.3.2 EMERGING LEADERS
- 7.3.3 PERVASIVE PLAYERS
- 7.3.4 PARTICIPANTS
- FIGURE 28 BIOCONTROL MARKET: COMPANY EVALUATION QUADRANT, 2022 (KEY PLAYERS)
- 7.4 PRODUCT FOOTPRINT
- TABLE 17 BIOCONTROLS: COMPANY PRODUCT TYPE FOOTPRINT
- TABLE 18 BIOCONTROLS: COMPANY CROP TYPE FOOTPRINT
- TABLE 19 BIOCONTROLS: COMPANY REGIONAL FOOTPRINT
- TABLE 20 BIOCONTROLS: OVERALL COMPANY FOOTPRINT
- 7.4.1 COMPETITIVE SCENARIO & TRENDS
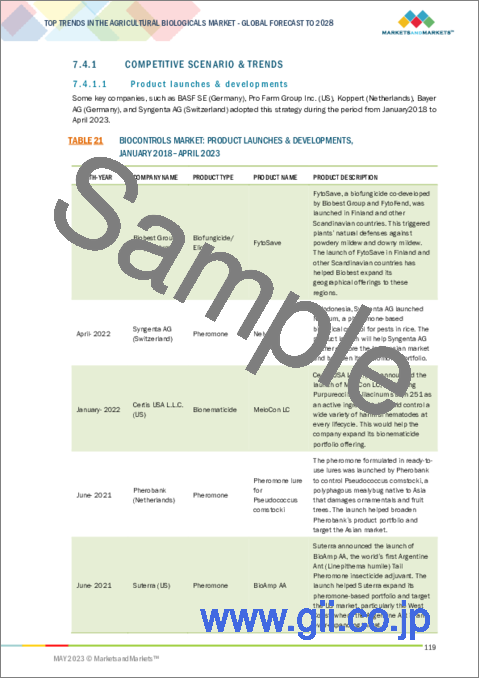
- 7.4.1.1 Product launches & developments
- TABLE 21 BIOCONTROLS MARKET: PRODUCT LAUNCHES & DEVELOPMENTS, JANUARY 2018-APRIL 2023
- 7.4.1.2 Deals (Mergers, Agreements, Partnerships, Collaborations & Acquisitions)
- TABLE 22 BIOCONTROLS MARKET: DEALS (MERGERS, AGREEMENTS, PARTNERSHIPS, COLLABORATIONS & ACQUISITIONS), JANUARY 2018-APRIL 2023
- 7.4.1.3 Others (Expansions & Investments)
- TABLE 23 BIOCONTROLS MARKET: EXPANSIONS & INVESTMENTS, JANUARY 2018-APRIL 2023
- 7.4.2 COMPANY RANKING ANALYSIS
- TABLE 24 BIOCONTROL MARKET: DEGREE OF COMPETITION
- 7.5 REGIONAL MARKET ANALYSIS
- TABLE 25 BIOCONTROLS MARKET, BY REGION, 2018-2022 (USD MILLION)
- TABLE 26 BIOCONTROLS MARKET, BY REGION, 2023-2028 (USD MILLION)
8 BIOFERTILIZERS
- 8.1 OVERVIEW
- 8.2 COMPETITIVE LANDSCAPE
- 8.2.1 INTRODUCTION
- TABLE 27 BIOFERTILIZERS MARKET: KEY STRATEGIES ADOPTED BY COMPANIES, JANUARY 2018-APRIL 2023
- 8.3 COMPANY EVALUATION QUADRANT (KEY PLAYERS)
- 8.3.1 STARS
- 8.3.2 EMERGING LEADERS
- 8.3.3 PERVASIVE PLAYERS
- 8.3.4 PARTICIPANTS
- FIGURE 29 BIOFERTILIZERS MARKET: COMPANY EVALUATION QUADRANT, 2022 (KEY PLAYERS)
- 8.3.5 PRODUCT FOOTPRINT
- TABLE 28 BIOFERTILIZERS: TYPE FOOTPRINT OF KEY PLAYERS
- TABLE 29 BIOFERTILIZERS: FORM FOOTPRINT OF KEY PLAYERS
- TABLE 30 BIOFERTILIZERS: MODE OF APPLICATION FOOTPRINT OF KEY PLAYERS
- TABLE 31 BIOFERTILIZERS: REGION FOOTPRINT OF KEY PLAYERS
- TABLE 32 BIOFERTILIZERS: OVERALL FOOTPRINT OF KEY PLAYERS
- 8.3.6 COMPETITIVE SCENARIO & TRENDS
- 8.3.6.1 Product launches & developments
- TABLE 33 BIOFERTILIZERS MARKET: PRODUCT LAUNCHES & DEVELOPMENTS, JANUARY 2018-APRIL 2023
- 8.3.6.2 Deals (Mergers, Agreements, Partnerships, Collaborations & Acquisitions)
- TABLE 34 BIOFERTILIZERS MARKET: DEALS (MERGERS, AGREEMENTS, PARTNERSHIPS, COLLABORATIONS & ACQUISITIONS), JANUARY 2018-APRIL 2023
- 8.3.6.3 Others (Expansions & Investments)
- TABLE 35 BIOFERTILIZERS MARKET: EXPANSIONS & INVESTMENTS, JANUARY 2018-APRIL 2023
- 8.3.7 COMPANY RANKING ANALYSIS
- TABLE 36 BIOFERTILIZERS MARKET: DEGREE OF COMPETITION
- 8.4 REGIONAL MARKET ANALYSIS
- TABLE 37 BIOFERTILIZERS MARKET, BY REGION, 2018-2022 (USD MILLION)
- TABLE 38 BIOFERTILIZERS MARKET, BY REGION, 2023-2028 (USD MILLION)
9 BIOSTIMULANTS
- 9.1 OVERVIEW
- 9.2 COMPETITIVE LANDSCAPE
- 9.2.1 INTRODUCTION
- TABLE 39 BIOSTIMULANTS MARKET: KEY STRATEGIES ADOPTED BY COMPANIES, 2018-2023
- 9.2.2 KEY PLAYER EVALUATION QUADRANT (KEY PLAYERS)
- 9.2.2.1 Stars
- 9.2.2.2 Emerging Leaders
- 9.2.2.3 Pervasive Players
- 9.2.2.4 Participants
- FIGURE 30 BIOSTIMULANTS MARKET: COMPANY EVALUATION QUADRANT (KEY PLAYERS), 2021
- 9.3 PRODUCT FOOTPRINT
- TABLE 40 BIOSTIMULANTS: COMPANY FOOTPRINT, BY CROP TYPE
- TABLE 41 BIOSTIMULANTS: COMPANY FOOTPRINT, BY FORMULATION TYPE
- TABLE 42 BIOSTIMULANTS: COMPANY FOOTPRINT, BY REGION
- TABLE 43 BIOSTIMULANTS: OVERALL COMPANY FOOTPRINT
- 9.3.1 COMPETITIVE SCENARIO & TRENDS
- 9.3.1.1 Deals (Agreements, Mergers & Acquisitions, Partnerships & Collaborations)
- TABLE 44 BIOSTIMULANTS MARKET: DEALS (AGREEMENTS, MERGERS & ACQUISITIONS PARTNERSHIPS & COLLABORATIONS), 2018-2023
- 9.3.1.2 Product launches, product approvals & registrations
- TABLE 45 BIOSTIMULANTS MARKET: PRODUCT LAUNCHES, PRODUCT APPROVALS & REGISTRATIONS, 2018-2023
- 9.3.1.3 Others (Expansion & Investments)
- TABLE 46 BIOSTIMULANTS MARKET: EXPANSIONS & INVESTMENTS, 2018-2023
- 9.4 MARKET SHARE ANALYSIS
- TABLE 47 BIOSTIMULANTS MARKET: DEGREE OF COMPETITION (COMPETITIVE), 2022
- 9.5 REGIONAL MARKET ANALYSIS
- TABLE 48 BIOSTIMULANTS MARKET, BY REGION, 2018-2022 (USD MILLION)
- TABLE 49 BIOSTIMULANTS MARKET, BY REGION, 2023-2028 (USD MILLION)
10 BIOINSECTICIDES
- 10.1 OVERVIEW
- 10.2 COMPETITIVE LANDSCAPE
- 10.2.1 INTRODUCTION
- TABLE 50 BIOINSECTICIDE: KEY STRATEGIES ADOPTED BY COMPANIES, 2018-2023
- 10.3 COMPETITIVE LEADERSHIP MAPPING
- 10.3.1 VISIONARY LEADERS
- 10.3.2 INNOVATORS
- 10.3.3 DYNAMIC DIFFERENTIATORS
- 10.3.4 EMERGING COMPANIES
- FIGURE 31 BIOINSECTICIDES MARKET: COMPETITIVE LEADERSHIP MAPPING, 2019
- 10.3.5 COMPETITIVE SCENARIO & TRENDS
- 10.3.5.1 Deals (Agreements, Mergers & Acquisitions, Partnerships & Collaborations)
- TABLE 51 BIOINSECTICIDES MARKET: DEALS (AGREEMENTS, MERGERS & ACQUISITIONS, PARTNERSHIPS & COLLABORATIONS), 2018-2023
- 10.3.5.2 Others (Expansions & Investments)
- TABLE 52 BIOINSECTICIDES MARKET: EXPANSIONS & INVESTMENTS, 2018-2023
- 10.3.5.3 Product developments & registrations
- TABLE 53 BIOINSECTICIDES MARKET: PRODUCT DEVELOPMENTS & REGISTRATIONS, 2018-2023
- 10.4 COMPANY RANKING ANALYSIS, 2022
- FIGURE 32 BIOINSECTICIDES MARKET: COMPANY RANKINGS, 2022
- 10.5 REGIONAL MARKET ANALYSIS
- TABLE 54 BIOINSECTICIDES MARKET, BY REGION, 2018-2022 (USD MILLION)
- TABLE 55 BIOINSECTICIDES MARKET, BY REGION, 2023-2028 (USD MILLION)
11 BIOFUNGICIDES
- 11.1 OVERVIEW
- 11.2 COMPETITIVE LANDSCAPE
- 11.2.1 INTRODUCTION
- TABLE 56 BIOFUNGICIDES: KEY STRATEGIES ADOPTED BY COMPANIES, 2018-2023
- 11.3 COMPETITIVE LEADERSHIP MAPPING
- 11.3.1 VISIONARY LEADERS
- 11.3.2 INNOVATORS
- 11.3.3 DYNAMIC DIFFERENTIATORS
- 11.3.4 EMERGING COMPANIES
- FIGURE 33 BIOFUNGICIDES MARKET: COMPETITIVE LEADERSHIP MAPPING, 2019
- 11.3.5 COMPETITIVE LANDSCAPE
- 11.3.5.1 Deals (Agreements, Mergers & Acquisitions, Partnerships & Collaborations)
- TABLE 57 BIOFUNGICIDES: DEALS (AGREEMENTS, MERGERS & ACQUISITIONS, PARTNERSHIPS & COLLABORATIONS), 2018-2023
- 11.3.5.2 Product launches, product approvals & registrations
- TABLE 58 BIOFUNGICIDES: PRODUCT LAUNCHES, PRODUCT APPROVALS & REGISTRATIONS, 2018-2023
- 11.3.5.3 Others (Expansions & Investments)
- TABLE 59 BIOFUNGICIDE: OTHERS (EXPANSIONS & INVESTMENTS), 2018-2023
- 11.3.6 COMPANY RANKING ANALYSIS
- FIGURE 34 BIOFUNGICIDES MARKET: COMPANY RANKINGS, 2022
- 11.4 REGIONAL MARKET ANALYSIS
- TABLE 60 BIOFUNGICIDES MARKET, BY REGION, 2018-2022 (USD MILLION)
- TABLE 61 BIOFUNGICIDES MARKET, BY REGION, 2023-2028 (USD MILLION)
12 BIONEMATICIDES
- 12.1 OVERVIEW
- 12.2 COMPETITIVE LANDSCAPE
- 12.2.1 INTRODUCTION
- 12.2.2 COMPETITIVE SCENARIO & TRENDS
- TABLE 62 BIONEMATICIDES MARKET: TRENDS IN COMPANY STRATEGIES, 2018-APRIL 2023
- 12.2.3 PRODUCT LAUNCHES, PRODUCT APPROVALS & REGISTRATIONS
- TABLE 63 BIONEMATICIDES MARKET: PRODUCT LAUNCHES, 2018-APRIL 2023
- 12.2.4 DEALS (MERGERS, AGREEMENTS, PARTNERSHIPS, COLLABORATIONS & ACQUISITIONS)
- TABLE 64 BIONEMATICIDES MARKET: DEALS (MERGERS, AGREEMENTS, PARTNERSHIPS, COLLABORATIONS & ACQUISITIONS), JANUARY 2018-APRIL 2023
- 12.2.5 OTHERS (EXPANSIONS & INVESTMENTS)
- TABLE 65 BIONEMATICIDES MARKET: EXPANSIONS & INVESTMENTS, JANUARY 2018-APRIL 2023
- 12.2.6 COMPANY RANKING ANALYSIS, 2022
- FIGURE 35 BIONEMATICIDES MARKET: COMPANY RANKINGS, 2022
- 12.3 REGIONAL MARKET ANALYSIS
- TABLE 66 BIONEMATICIDES MARKET, BY REGION, 2018-2022 (USD MILLION)
- TABLE 67 BIONEMATICIDES MARKET, BY REGION, 2023-2028 (USD MILLION)
13 BIOLOGICAL SEED TREATMENT
- 13.1 OVERVIEW
- 13.2 COMPETITIVE LANDSCAPE
- 13.2.1 INTRODUCTION
- TABLE 68 BIOLOGICAL SEED TREATMENT MARKET: KEY STRATEGIES ADOPTED BY COMPANIES, 2018-APRIL 2023
- 13.3 COMPANY EVALUATION QUADRANT
- 13.3.1 STARS
- 13.3.2 EMERGING LEADERS
- 13.3.3 PERVASIVE PLAYERS
- 13.3.4 PARTICIPANTS
- FIGURE 36 BIOLOGICAL SEED TREATMENT: COMPANY EVALUATION QUADRANT, 2022 (KEY PLAYERS)
- 13.4 PRODUCT FOOTPRINT
- TABLE 69 BIOLOGICAL SEED TREATMENT: COMPANY TYPE FOOTPRINT
- TABLE 70 BIOLOGICAL SEED TREATMENT: COMPANY CROP FOOTPRINT
- TABLE 71 BIOLOGICAL SEED TREATMENT: COMPANY REGION FOOTPRINT
- TABLE 72 BIOLOGICAL SEED TREATMENT: PRODUCT FOOTPRINT (OVERALL)
- 13.4.1 COMPETITIVE SCENARIO & TRENDS
- 13.4.1.1 Product launches, product approvals & registrations
- TABLE 73 BIOLOGICAL SEED TREATMENT MARKET: PRODUCT LAUNCHES, PRODUCT APPROVALS & REGISTRATIONS, 2018-APRIL 2023
- 13.4.2 DEALS
- TABLE 74 BIOLOGICAL SEED TREATMENT MARKET: DEALS (MERGER, AGREEMENTS, PARTNERSHIPS, COLLABORATIONS & ACQUISITIONS), 2018-APRIL 2023
- 13.4.3 OTHERS
- TABLE 75 BIOLOGICAL SEED TREATMENT MARKET: EXPANSIONS & INVESTMENTS, JANUARY 2018-APRIL 2023
- 13.4.4 COMPANY RANKING ANALYSIS
- FIGURE 37 BIOLOGICAL SEED TREATMENT MARKET: COMPANY RANKINGS, 2022
- 13.5 REGIONAL MARKET ANALYSIS
- TABLE 76 BIOLOGICAL SEED TREATMENT MARKET, BY REGION, 2018-2022 (USD MILLION)
- TABLE 77 BIOLOGICAL SEED TREATMENT MARKET, BY REGION, 2023-2028 (USD MILLION)
14 AGRICULTURAL INOCULANTS
- 14.1 OVERVIEW
- 14.2 STRATEGIES ADOPTED BY KEY PLAYERS
- TABLE 78 STRATEGIES ADOPTED BY KEY PLAYERS IN AGRICULTURAL INOCULANTS MARKET
- 14.3 COMPANY EVALUATION QUADRANT (KEY PLAYERS)
- 14.3.1 STARS
- 14.3.2 EMERGING LEADERS
- 14.3.3 PERVASIVE PLAYERS
- 14.3.4 PARTICIPANTS
- FIGURE 38 AGRICULTURAL INOCULANTS MARKET: COMPANY EVALUATION QUADRANT, APRIL 2023 (KEY PLAYERS)
- 14.4 PRODUCT FOOTPRINT
- TABLE 79 BIOLOGICAL SEED TREATMENT: COMPANY PRODUCT FOOTPRINT, BY TYPE
- TABLE 80 BIOLOGICAL SEED TREATMENT: COMPANY PRODUCT FOOTPRINT, BY MICROBE
- TABLE 81 BIOLOGICAL SEED TREATMENT: COMPANY PRODUCT FOOTPRINT, BY CROP TYPE
- TABLE 82 BIOLOGICAL SEED TREATMENT: COMPANY PRODUCT FOOTPRINT, BY REGION
- 14.5 MARKET SHARE ANALYSIS
- TABLE 83 GLOBAL AGRICULTURAL INOCULANTS MARKET: DEGREE OF COMPETITION
- 14.5.1 COMPETITIVE SCENARIO & TRENDS
- 14.5.1.1 Product launches, product approvals & registrations
- TABLE 84 AGRICULTURAL INOCULANTS MARKET: PRODUCT LAUNCHES, JANUARY 2018-APRIL 2023
- 14.5.2 DEALS (MERGERS, AGREEMENTS, PARTNERSHIPS, COLLABORATIONS & ACQUISITIONS)
- TABLE 85 AGRICULTURAL INOCULANTS MARKET: DEALS (MERGER, AGREEMENTS, PARTNERSHIPS, COLLABORATIONS & ACQUISITIONS), JANUARY 2018-APRIL 2023
- 14.5.3 OTHERS
- TABLE 86 AGRICULTURAL INOCULANTS MARKET: OTHERS, JANUARY 2018-APRIL 2023
- 14.6 REGIONAL MARKET ANALYSIS
- TABLE 87 AGRICULTURAL INOCULANTS MARKET, BY REGION, 2018-2022 (USD MILLION)
- TABLE 88 AGRICULTURAL INOCULANTS MARKET, BY REGION, 2023-2028 (USD MILLION)
15 AGRICULTURAL PHEROMONES
- 15.1 OVERVIEW
- 15.2 COMPETITIVE LANDSCAPE
- 15.2.1 INTRODUCTION
- TABLE 89 AGRICULTURAL PHEROMONES MARKET: KEY STRATEGIES ADOPTED BY COMPANIES, 2018-APRIL 2023
- 15.3 COMPANY EVALUATION QUADRANT
- 15.3.1 STARS
- 15.3.2 EMERGING LEADERS
- 15.3.3 PERVASIVE PLAYERS
- 15.3.4 PARTICIPANTS
- FIGURE 39 AGRICULTURAL PHEROMONES MARKET: COMPANY EVALUATION QUADRANT, APRIL 2023 (KEY PLAYERS)
- 15.3.5 PRODUCT FOOTPRINT
- TABLE 90 AGRICULTURAL PHEROMONES: COMPANY FUNCTION FOOTPRINT
- TABLE 91 AGRICULTURAL PHEROMONES: COMPANY CROP TYPE FOOTPRINT
- TABLE 92 AGRICULTURAL PHEROMONES: COMPANY REGION FOOTPRINT
- TABLE 93 AGRICULTURAL PHEROMONES: COMPANY PRODUCT FOOTPRINT
- 15.3.6 COMPETITIVE SCENARIO & TRENDS
- 15.3.6.1 Product launches, product approvals & registrations
- TABLE 94 AGRICULTURAL PHEROMONES MARKET: PRODUCT LAUNCHES, PRODUCT APPROVALS & REGISTRATIONS, JANUARY 2018-APRIL 2023
- 15.3.6.2 Deals (Mergers, Agreements, Partnerships, Collaborations & Acquisitions)
- TABLE 95 AGRICULTURAL PHEROMONES MARKET: DEALS (MERGERS, AGREEMENTS, PARTNERSHIPS, COLLABORATIONS & ACQUISITIONS), 2018-2023
- 15.3.6.3 Others (Expansions & Investments)
- TABLE 96 AGRICULTURAL PHEROMONES MARKET: EXPANSIONS & INVESTMENTS, 2018- APRIL 2023
- 15.3.7 COMPANY RANKING ANALYSIS
- FIGURE 40 AGRICULTURAL PHEROMONES MARKET: COMPANY RANKINGS, 2022
- 15.4 REGIONAL MARKET ANALYSIS
- TABLE 97 AGRICULTURAL PHEROMONES MARKET, BY REGION, 2018-2022
- TABLE 98 AGRICULTURAL PHEROMONES MARKET, BY REGION, 2023-2028
16 COMPANY PROFILES
- 16.1 KEY PLAYERS
- (Business Overview, Products Offered, Recent Developments, and MnM View (Key strengths/Right to Win, Strategic Choices Made, and Weaknesses and Competitive Threats))**
- 16.1.1 BASF SE
- TABLE 99 BASF SE: BUSINESS OVERVIEW, 2022
- FIGURE 41 BASF SE: COMPANY SNAPSHOT
- TABLE 100 BASF SE: PRODUCTS OFFERED
- TABLE 101 BASF SE: PRODUCT LAUNCHES
- TABLE 102 BASF SE: DEALS
- 16.1.2 BAYER AG
- TABLE 103 BAYER AG: BUSINESS OVERVIEW, 2022
- FIGURE 42 BAYER AG: COMPANY SNAPSHOT
- TABLE 104 BAYER AG: PRODUCTS OFFERED
- TABLE 105 BAYER AG: PRODUCT LAUNCHES
- TABLE 106 BAYER AG: DEALS
- 16.1.3 SYNGENTA AG
- TABLE 107 SYNGENTA AG: BUSINESS OVERVIEW, 2022
- FIGURE 43 SYNGENTA AG: COMPANY SNAPSHOT
- TABLE 108 SYNGENTA AG: PRODUCTS OFFERED
- TABLE 109 SYNGENTA AG: PRODUCT LAUNCHES
- TABLE 110 SYNGENTA AG: DEALS
- 16.1.4 NOVOZYMES
- TABLE 111 NOVOZYMES: BUSINESS OVERVIEW, 2022
- FIGURE 44 NOVOZYMES: COMPANY SNAPSHOT
- TABLE 112 NOVOZYMES: PRODUCTS OFFERED
- TABLE 113 NOVOZYMES: PRODUCT LAUNCHES
- TABLE 114 NOVOZYMES: DEALS
- TABLE 115 NOVOZYMES: OTHER DEVELOPMENTS
- 16.1.5 UPL
- TABLE 116 UPL: BUSINESS OVERVIEW
- FIGURE 45 UPL: COMPANY SNAPSHOT
- TABLE 117 UPL: PRODUCTS OFFERED
- TABLE 118 UPL: DEALS
- 16.1.6 CORTEVA AGRISCIENCE
- TABLE 119 CORTEVA AGRISCIENCE: BUSINESS OVERVIEW
- FIGURE 46 CORTEVA AGRISCIENCE: COMPANY SNAPSHOT
- TABLE 120 CORTEVA AGRISCIENCE: PRODUCTS OFFERED
- TABLE 121 CORTEVA AGRISCIENCE: PRODUCT LAUNCHES
- TABLE 122 CORTEVA AGRISCIENCE: DEALS
- TABLE 123 CORTEVA AGRISCIENCE: OTHER DEVELOPMENTS
- 16.1.7 FMC CORPORATION
- TABLE 124 FMC CORPORATION: BUSINESS OVERVIEW, 2022
- FIGURE 47 FMC CORPORATION: COMPANY SNAPSHOT
- TABLE 125 FMC CORPORATION: PRODUCTS OFFERED
- TABLE 126 FMC CORPORATION: PRODUCT LAUNCHES
- TABLE 127 FMC CORPORATION: DEALS
- 16.1.8 PRO FARM GROUP INC.
- TABLE 128 PRO FARM GROUP INC.: BUSINESS OVERVIEW, 2022
- TABLE 129 PRO FARM GROUP INC.: PRODUCTS OFFERED
- TABLE 130 PRO FARM GROUP INC.: PRODUCT LAUNCHES
- TABLE 131 PRO FARM GROUP INC.: OTHER DEVELOPMENTS
- 16.1.9 LALLEMAND INC.
- TABLE 132 LALLEMAND INC.: BUSINESS OVERVIEW, 2022
- TABLE 133 LALLEMAND INC.: PRODUCTS OFFERED
- TABLE 134 LALLEMAND INC.: PRODUCT LAUNCHES
- 16.1.10 VEGALAB SA
- TABLE 135 VEGALAB SA: BUSINESS OVERVIEW, 2022
- TABLE 136 VEGALAB SA: PRODUCTS OFFERED
- TABLE 137 VEGALAB SA: DEALS
- 16.1.11 VALENT BIOSCIENCES LLC
- TABLE 138 VALENT BIOSCIENCES LLC: BUSINESS OVERVIEW, 2022
- TABLE 139 VALENT BIOSCIENCES LLC: PRODUCTS OFFERED
- TABLE 140 VALENT BIOSCIENCES LLC: DEALS
- TABLE 141 VALENT BIOSCIENCES LLC: OTHER DEVELOPMENTS
- 16.1.12 KOPPERT
- TABLE 142 KOPPERT: BUSINESS OVERVIEW, 2022
- TABLE 143 KOPPERT: PRODUCTS OFFERED
- TABLE 144 KOPPERT: DEALS
- TABLE 145 KOPPERT: OTHER DEVELOPMENTS
- 16.1.13 STOCKTON BIO-AG
- TABLE 146 STOCKTON BIO-AG: BUSINESS OVERVIEW, 2022
- TABLE 147 STOCKTON BIO-AG: PRODUCTS OFFERED
- TABLE 148 STOCKTON BIO-AG: DEALS
- 16.1.14 IPL BIOLOGICALS LIMITED
- TABLE 149 IPL BIOLOGICALS LIMITED: BUSINESS OVERVIEW, 2022
- TABLE 150 IPL BIOLOGICALS LIMITED: PRODUCTS OFFERED
- 16.1.15 CERTIS USA LLC
- TABLE 151 CERTIS USA LLC: BUSINESS OVERVIEW
- TABLE 152 CERTIS USA LLC: PRODUCTS OFFERED
- TABLE 153 CERTIS USA LLC: DEALS
- 16.1.16 GOWAN COMPANY
- TABLE 154 GOWAN COMPANY: BUSINESS OVERVIEW, 2022
- TABLE 155 GOWAN COMPANY: PRODUCTS OFFERED
- TABLE 156 GOWAN COMPANY: DEALS
- 16.1.17 KAN BIOSYS
- TABLE 157 KAN BIOSYS: BUSINESS OVERVIEW, 2022
- TABLE 158 KAN BIOSYS: PRODUCTS OFFERED
- 16.1.18 SYMBORG
- TABLE 159 SYMBORG: BUSINESS OVERVIEW, 2022
- TABLE 160 SYMBORG: PRODUCTS OFFERED
- TABLE 161 SYMBORG: PRODUCT LAUNCHES
- TABLE 162 SYMBORG: OTHER DEVELOPMENTS
- 16.1.19 RIZOBACTER
- TABLE 163 RIZOBACTER: BUSINESS OVERVIEW, 2022
- TABLE 164 RIZOBACTER: PRODUCTS OFFERED
- TABLE 165 RIZOBACTER: DEALS
- TABLE 166 RIZOBACTER: OTHERS
- 16.1.20 BIOMAX NATURALS
- TABLE 167 BIOMAX NATURALS: BUSINESS OVERVIEW, 2022
- TABLE 168 BIOMAX NATURALS: PRODUCTS OFFERED
- 16.1.21 BIOBEST GROUP NV
- TABLE 169 BIOBEST GROUP NV: BUSINESS OVERVIEW, 2022
- TABLE 170 BIOBEST GROUP NV: PRODUCTS OFFERED
- TABLE 171 BIOBEST GROUP NV: PRODUCT LAUNCHES
- TABLE 172 BIOBEST GROUP NV: DEALS
- 16.1.22 AGRILIFE
- TABLE 173 AGRILIFE: BUSINESS OVERVIEW, 2022
- TABLE 174 AGRILIFE: PRODUCTS OFFERED
- 16.1.23 HAIFA NEGEV TECHNOLOGIES LTD
- TABLE 175 HAIFA NEGEV TECHNOLOGIES LTD: BUSINESS OVERVIEW
- TABLE 176 HAIFA NEGEV TECHNOLOGIES LTD: PRODUCTS OFFERED
- TABLE 177 HAIFA NEGEV TECHNOLOGIES LTD: PRODUCT LAUNCHES
- TABLE 178 HAIFA NEGEV TECHNOLOGIES LTD: OTHER DEVELOPMENTS
- 16.1.24 PIVOT BIO
- TABLE 179 PIVOT BIO: BUSINESS OVERVIEW
- TABLE 180 PIVOT BIO: PRODUCTS OFFERED
- 16.1.25 PRECISION LABORATORIES LLC
- TABLE 181 PRECISION LABORATORIES LLC: BUSINESS OVERVIEW
- TABLE 182 PRECISION LABORATORIES LLC: PRODUCTS OFFERED
- *Details on Business Overview, Products Offered, Recent Developments, and MnM View (Key strengths/Right to Win, Strategic Choices Made, and Weaknesses and Competitive Threats) might not be captured in case of unlisted companies.
17 APPENDIX
- 17.1 DISCUSSION GUIDE
- 17.2 KNOWLEDGESTORE: MARKETSANDMARKETS' SUBSCRIPTION PORTAL
- 17.3 CUSTOMIZATION OPTIONS
- 17.4 RELATED REPORTS
- 17.5 AUTHOR DETAILS