
|
市場調査レポート
商品コード
1693769
アジア太平洋の農業用生物製剤-市場シェア分析、産業動向、成長予測(2025年~2030年)Asia-Pacific Agricultural Biologicals - Market Share Analysis, Industry Trends & Statistics, Growth Forecasts (2025 - 2030) |
||||||
カスタマイズ可能
適宜更新あり
|
|||||||
| アジア太平洋の農業用生物製剤-市場シェア分析、産業動向、成長予測(2025年~2030年) |
|
出版日: 2025年03月18日
発行: Mordor Intelligence
ページ情報: 英文 262 Pages
納期: 2~3営業日
|

全表示
- 概要
- 目次
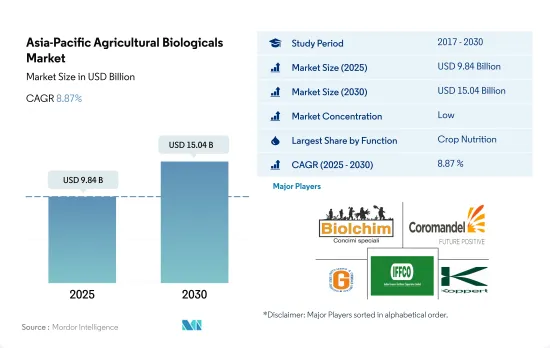
アジア太平洋の農業用生物製剤市場規模は、2025年に98億4,000万米ドルと推定され、2030年には150億4,000万米ドルに達すると予測され、予測期間中(2025~2030年)のCAGRは8.87%で成長する見込みです。
- アジア太平洋では、農業用生物製剤がサステイナブル農業において重要な役割を果たしています。これらの製品は、必要な栄養素を供給し、作物の害虫や昆虫を駆除することで、化学肥料や農薬の使用を削減します。同地域の農業用生物製剤市場は前年比増で成長しています。2017~2022年にかけて、市場規模はCAGR 2.2%で成長しました。
- アジア太平洋における生物学的ソリューションの需要は、主に、一部の従来型農薬の使用に関する規制を強化している欧州連合(EU)などの輸出市場や、よりサステイナブル方法で栽培された食品に対する地元の消費者や顧客の需要によって牽引されています。そのため、より多くの生産者が代替ソリューションへの関心を高めています。最も有望なセグメントは、生食される高価値の果物や野菜(ベリー類やブドウなど)と、温室で栽培される作物です。
- 農薬アクションネットワークの5つの地域センターのひとつであるPANアジア太平洋(PANAP)は、農薬が人間や環境に及ぼす有害な影響に関する意識向上キャンペーンを展開し、生物多様性による生態系農業を推進しています。
- 中国、インド、オーストラリア、インドネシアなどは有機農業戦略を採用しています。中国とインドは、この地域の農業生物製剤市場でそれぞれ50.5%と32.6%のシェアを占める主要国です。これらの国々は、有機農業と農業生物製剤の使用を広く奨励するため、さまざまな取り組みを実施しています。例えば中国は、園芸作物と連作作物における農薬使用量をそれぞれ10%と5%削減する計画です。インドでは、PKVYやMOVCDNERといった多くの取り組みを通じて、有機農業のための農業生物製剤を購入するための資金援助を農業従事者に提供しています。
- アジア太平洋は、世界有数の有機農業生産地です。米、サトウキビ、新鮮果物や野菜は、この地域で栽培されている主要有機作物のひとつです。中国とインドはこの地域の主要な有機作物生産国であり、有機製品の消費市場も最も大きいです。
- 同地域で有機農業を営む面積は2017~2022年にかけて大幅に増加し、2017年の310万ヘクタールから2022年には380万ヘクタールに増加しました。この地域の生物製剤市場は、過去の期間に10.1%増加し、予測期間には約65.1%増加し、2029年には138億1,000万米ドルに達すると予想されます。
- 国別では、中国が2022年のアジア太平洋の農業用生物製剤市場の50.5%、78.6%を占めました。インドは32.6%で2位を占め、その他のアジア太平洋は同年のアジア太平洋生物製剤市場全体の5.9%を占めました。
- 2022年には、アジア太平洋の連作作物がより多くの生物学的肥料を消費し、市場総額の80.1%を占めました。これは、この地域の多くの国で畑作物が安定した食糧であるため、栽培面積が膨大であることによる。次いで換金作物が10.9%、園芸作物が8.3%となっています。
- 有機作物作付面積の増加動向と、有機製品や有機肥料に対する需要の高まりは、化学肥料の使用量を全体的に減少させています。作物生産の全体的なコストと有機農業を奨励する政府の試みは、2023~2029年にかけてアジア太平洋の生物製剤市場を牽引すると予想されます。
アジア太平洋の農業生物製剤市場の動向
中国、インド、インドネシア、オーストラリアなどの国々における政府支援の拡大が、同地域の有機農業を後押し
- FiBLの統計によると、アジア太平洋の有機農地面積は2021年には370万ヘクタールを超え、世界の有機農地面積の26.4%を占めています。さらに、有機栽培面積は2017~2022年の間に19.3%の伸びを示しました。2020年時点で、この地域は約183万人の有機生産者を記録し、インドが130万人でトップです。中国、インド、インドネシア、オーストラリアは、この地域で有機栽培面積が大きい主要国です。中国やインドなどの政府当局は、作物栽培における化学投入物への依存を減らすため、常に有機農業を推進しています。例えば、インドはParamparagat Krishi Vikas YojanaやAll India Network Programme on Organic Farming(AI-NPOF)といった制度を実施しています。
- 2021年には、中国が250万ヘクタールで66.1%の最大シェアを占め、次いでインドが19.3%、インドネシアが1.5%、オーストラリアが1.4%でした。全有機農地で栽培されている作物は,連作作物,園芸作物,換金作物の3種類に分けられます。連作作物は,この地域の有機農地の大部分を占めており,2021年には250万ヘクタールで67.5%のシェアを占めました。この地域で栽培されている主要連作作物には、水稲、小麦、豆類、大豆、雑穀が含まれます。
- 換金作物のシェアは第2位で、2021年には70万ヘクタールとなり、有機農地の18.5%を占めます。砂糖や有機茶などの有機換金作物に対する需要は世界的に増加しています。世界的には、中国とインドがそれぞれ最大の有機緑茶と有機紅茶の生産国です。国際的な需要の高まりにより、この地域の有機栽培面積は増加すると予想されます。
オーガニック製品への1人当たり支出はオーストラリアが圧倒的に多く、中国のオーガニック食品市場は大きく成長しています。
- インドの有機製品は世界需要の1.0%に遠く及ばず、2021年の1人当たり支出はわずか0.08米ドルです。しかし、有機食品を摂取することの利点に対する人々の意識が高まり、紅茶や有機ジュースなどのカテゴリーで有機製品に対する需要が伸びていることから、インドは今後数年間で潜在的な市場となります。2025年には1億5,330万米ドルに達すると予想されています。現在、この地域のオーガニック商品市場は非常に断片的で、一部のスーパーマーケットや専門店でしか販売されていないです。
- 中国は、地域平均や世界平均を上回る有機成長を続けており、2021年には13.3%の拡大を記録しました。プラス成長パターンは今後も続くと予想され、2023~2029年の平均CAGRは7.1%です。
- オーガニック製品は中国で力強い成長を遂げ、2023~2029年のCAGRは7.1%を記録し、2025年には合計64億米ドルに達すると予想されます。この成長の背景には、若い世代の間でオーガニック製品の重要性が重視されるようになっていること、母親の就労者数の増加によるオーガニックベビーフードの需要増、健康とウェルネスの動向の採用増加などがあります。消費者の知識と購買意欲の高まりは、この地域における有機食品のサステイナブル特質に対する理解を深めることにつながると予想されます。1人当たり所得の増加は、有機食品摂取の重要性に対する消費者の意識の高まりとともに、アジア太平洋の有機食品に対する1人当たり支出を増加させる可能性を秘めています。
アジア太平洋の農業用生物製剤産業概要
アジア太平洋の農業用生物製剤市場はセグメント化されており、上位5社で6.21%を占めています。この市場の主要企業は、Biolchim SpA、Coromandel International Ltd、Gujarat State Fertilizers & Chemicals Ltd、Indian Farmers Fertiliser Cooperative Limited、Koppert Biological Systems Inc.などです。
その他の特典
- エクセル形式の市場予測(ME)シート
- 3ヶ月のアナリストサポート
目次
第1章 エグゼクティブサマリーと主要調査結果
第2章 レポートのオファー
第3章 イントロダクション
- 調査の前提条件と市場定義
- 調査範囲
- 調査手法
第4章 主要産業動向
- 有機栽培面積
- 一人当たりのオーガニック製品への支出
- 規制の枠組み
- オーストラリア
- 中国
- インド
- インドネシア
- 日本
- フィリピン
- タイ
- ベトナム
- バリューチェーンと流通チャネル分析
第5章 市場セグメンテーション
- 機能
- 作物栄養
- バイオ肥料
- アゾスピリラム
- アゾトバクタ
- 菌根菌
- リン酸可溶化菌
- 根粒菌
- その他のバイオ肥料
- バイオ肥料
- アミノ酸
- フルボ酸
- 腐植酸
- タンパク質加水分解物
- 海藻エキス
- その他バイオスティミュラント
- 有機肥料
- 肥料
- ミールベース肥料
- オイルケーキ
- その他の有機肥料
- 作物保護
- 生物防除剤
- マクロ微生物
- 微生物
- 生物農薬
- バイオ殺菌剤
- バイオ除草剤
- 生物殺虫剤
- その他の生物農薬
- 作物栄養
- 作物タイプ
- 換金作物
- 園芸作物
- 耕作作物
- 生産国
- オーストラリア
- 中国
- インド
- インドネシア
- 日本
- フィリピン
- タイ
- ベトナム
- その他のアジア太平洋
第6章 競合情勢
- 主要な戦略動向
- 市場シェア分析
- 企業情勢
- 企業プロファイル
- Biolchim SpA
- Coromandel International Ltd
- Genliduo Bio-tech Corporation Ltd
- Gujarat State Fertilizers & Chemicals Ltd
- Indian Farmers Fertiliser Cooperative Limited
- Koppert Biological Systems Inc.
- Novozymes
- Sustane Natural Fertilizer Inc.
- Valagro
- Valent Biosciences LLC
第7章 CEOへの主要戦略的質問
第8章 付録
- 世界概要
- 概要
- ファイブフォース分析フレームワーク
- 世界のバリューチェーン分析
- 市場力学(DROs)
- 情報源と参考文献
- 図表一覧
- 主要な洞察
- データパック
- 用語集
The Asia-Pacific Agricultural Biologicals Market size is estimated at 9.84 billion USD in 2025, and is expected to reach 15.04 billion USD by 2030, growing at a CAGR of 8.87% during the forecast period (2025-2030).
- In the Asia-Pacific region, agricultural biologicals play a key role in sustainable agriculture. These products reduce the use of chemical fertilizers and pesticides by providing required nutrients and controlling pests and insects in crops. The agricultural biologicals market in the region is growing Y-o-Y. From 2017 to 2022, the market value grew by a CAGR of 2.2%.
- The demand for biological solutions in Asia-Pacific is being driven primarily by export markets such as the European Union, which is tightening regulations on the use of some conventional pesticides and local consumer and customer demand for more sustainably grown food. Thus, more growers are showing a growing interest in alternative solutions. The most promising segments are high-value fruits and vegetables (e.g., berries and grapes) eaten fresh and crops grown in greenhouses.
- PAN Asia Pacific (PANAP), one of five regional centers of the Pesticide Action Network, is creating an awareness campaign regarding the harmful effects of pesticides on humans and the environment and promoting biodiversity-based ecological agriculture.
- Countries such as China, India, Australia, and Indonesia are adopting organic farming strategies. China and India are the major countries holding shares of 50.5% and 32.6%, respectively, of the agricultural biologicals market in the region. These countries are implementing different initiatives to encourage organic farming and agricultural biologicals usage widely. For instance, China is planning to reduce 10% and 5% pesticide usage in horticultural crops and row crops, respectively. India, through many initiatives like PKVY and MOVCDNER, provides financial support to farmers to buy agricultural biologicals for organic farming.
- The Asia-Pacific region is one of the world's major organic producers. Rice, sugarcane, and fresh fruits and vegetables are among the major organic crops cultivated in the region. China and India are the region's main organic crop producers and have the highest organic product consumption markets.
- The area of the region that was organically farmed increased significantly between 2017 and 2022, rising from 3.1 million hectares in 2017 to 3.8 million hectares in 2022. The region's biologicals market increased by 10.1% during the historical period and is expected to increase by about 65.1% over the forecast period, reaching USD 13.81 billion by 2029.
- As an individual country, China dominated the Asia-Pacific agricultural biologicals market in 2022 by 50.5% of the market value and 78.6% of the market volume. India occupied second place with 32.6%, and the Rest of Asia-Pacific held 5.9% of the total Asia-Pacific biologicals market values the same year.
- In 2022, row crops in the Asia-Pacific region consumed more biological fertilizers, accounting for 80.1% of the total market value. This is due to the region's huge area under cultivation of field crops, as they are the stable food in many countries in the region. This is followed by cash crops and horticultural crops, which had 10.9% and 8.3% shares, respectively, in the same year.
- The rising trend in organic crop areas and the rising demand for organic products and organic fertilizers reduce overall chemical fertilizer use. The overall cost of crop production and government attempts to encourage organic farming are expected to drive the Asia-Pacific biologicals market between 2023 and 2029.
Asia-Pacific Agricultural Biologicals Market Trends
Growing government support in countries like China, India, Indonesia, and Australia, boosts organic farming in the region
- The area under organic agricultural land in the Asia-Pacific region was over 3.7 million hectares in 2021, representing 26.4% of the global organic area, as per FiBL statistics. Moreover, the organic area under cultivation witnessed a growth of 19.3% between 2017-2022. As of 2020, the region recorded around 1.83 million organic producers, with India topping the list with 1.3 million organic producers. China, India, Indonesia, and Australia are the major countries with large organic cultivation areas in the region. Government authorities in countries such as China and India constantly promote organic agriculture to reduce reliance on chemical inputs for crop cultivation. For instance, India has implemented schemes such as Paramparagat Krishi Vikas Yojana and the All India Network Programme on Organic Farming (AI-NPOF).
- In 2021, China accounted for the maximum share of 66.1% with 2.5 million hectares, followed by India, Indonesia, and Australia with 19.3%, 1.5%, and 1.4% shares, respectively. The crops grown in the total organic land can be divided into three types, namely row crops, horticultural crops, and cash crops. Row crops occupy a major share of organic agricultural land in the region, which accounted for a 67.5% share with 2.5 million hectares in 2021. The major row crops grown in the region include paddy, wheat, pulses, soybeans, and millets.
- Cash crops held the second largest share, with 0.7 million hectares in 2021, accounting for an 18.5% share of organic cropland. The demand for organic cash crops, such as sugar and organic tea, is increasing globally. Globally, China and India are the largest organic green and black tea producers, respectively. The growing international demand is expected to increase the organic acreages in the region.
Per capita spending on organic product predominant in Australia and China's organic food market growing significantly
- Organic products in India represent far less than 1.0% of the global value demand, with a per capita expenditure of just USD 0.08 in 2021. However, with people becoming more aware of the benefits of consuming organic food and the growth in demand for organic products in categories such as tea and organic juice, India represents a potential market over the coming years. It is expected to reach a value of USD 153.3 million by 2025. Currently, the market for organic goods in the region is very fragmented, with just a few supermarkets and specialty stores selling them, as only people from higher-income families are possible customers.
- China continues to show organic growth above the regional and global averages, posting a 13.3% expansion in 2021. A positive growth pattern is expected to continue, with China averaging a CAGR of 7.1% between 2023 and 2029.
- Organic products are anticipated to experience strong growth in China, registering a value CAGR of 7.1% between 2023 and 2029 and reaching a total of USD 6.4 billion by 2025. This growth can be attributed to an increasing emphasis on the importance of organic products among the younger generation, a rise in demand for organic baby food due to the growing number of mothers in the workforce, and the increasing adoption of the health and wellness trend. Growing consumer knowledge and buying motivations are expected to lead to a better understanding of the sustainable qualities of organic food in the region. Increased per capita income, along with increased consumer awareness of the importance of organic food intake, has the potential to raise per capita expenditure on organic food items in the Asia-Pacific region.
Asia-Pacific Agricultural Biologicals Industry Overview
The Asia-Pacific Agricultural Biologicals Market is fragmented, with the top five companies occupying 6.21%. The major players in this market are Biolchim SpA, Coromandel International Ltd, Gujarat State Fertilizers & Chemicals Ltd, Indian Farmers Fertiliser Cooperative Limited and Koppert Biological Systems Inc. (sorted alphabetically).
Additional Benefits:
- The market estimate (ME) sheet in Excel format
- 3 months of analyst support
TABLE OF CONTENTS
1 EXECUTIVE SUMMARY & KEY FINDINGS
2 REPORT OFFERS
3 INTRODUCTION
- 3.1 Study Assumptions & Market Definition
- 3.2 Scope of the Study
- 3.3 Research Methodology
4 KEY INDUSTRY TRENDS
- 4.1 Area Under Organic Cultivation
- 4.2 Per Capita Spending On Organic Products
- 4.3 Regulatory Framework
- 4.3.1 Australia
- 4.3.2 China
- 4.3.3 India
- 4.3.4 Indonesia
- 4.3.5 Japan
- 4.3.6 Philippines
- 4.3.7 Thailand
- 4.3.8 Vietnam
- 4.4 Value Chain & Distribution Channel Analysis
5 MARKET SEGMENTATION (includes market size in Value in USD and Volume, Forecasts up to 2030 and analysis of growth prospects)
- 5.1 Function
- 5.1.1 Crop Nutrition
- 5.1.1.1 Biofertilizer
- 5.1.1.1.1 Azospirillum
- 5.1.1.1.2 Azotobacter
- 5.1.1.1.3 Mycorrhiza
- 5.1.1.1.4 Phosphate Solubilizing Bacteria
- 5.1.1.1.5 Rhizobium
- 5.1.1.1.6 Other Biofertilizers
- 5.1.1.2 Biostimulants
- 5.1.1.2.1 Amino Acids
- 5.1.1.2.2 Fulvic Acid
- 5.1.1.2.3 Humic Acid
- 5.1.1.2.4 Protein Hydrolysates
- 5.1.1.2.5 Seaweed Extracts
- 5.1.1.2.6 Other Biostimulants
- 5.1.1.3 Organic Fertilizer
- 5.1.1.3.1 Manure
- 5.1.1.3.2 Meal Based Fertilizers
- 5.1.1.3.3 Oilcakes
- 5.1.1.3.4 Other Organic Fertilizers
- 5.1.2 Crop Protection
- 5.1.2.1 Biocontrol Agents
- 5.1.2.1.1 Macrobials
- 5.1.2.1.2 Microbials
- 5.1.2.2 Biopesticides
- 5.1.2.2.1 Biofungicides
- 5.1.2.2.2 Bioherbicides
- 5.1.2.2.3 Bioinsecticides
- 5.1.2.2.4 Other Biopesticides
- 5.1.1 Crop Nutrition
- 5.2 Crop Type
- 5.2.1 Cash Crops
- 5.2.2 Horticultural Crops
- 5.2.3 Row Crops
- 5.3 Country
- 5.3.1 Australia
- 5.3.2 China
- 5.3.3 India
- 5.3.4 Indonesia
- 5.3.5 Japan
- 5.3.6 Philippines
- 5.3.7 Thailand
- 5.3.8 Vietnam
- 5.3.9 Rest of Asia-Pacific
6 COMPETITIVE LANDSCAPE
- 6.1 Key Strategic Moves
- 6.2 Market Share Analysis
- 6.3 Company Landscape
- 6.4 Company Profiles (includes Global Level Overview, Market Level Overview, Core Business Segments, Financials, Headcount, Key Information, Market Rank, Market Share, Products and Services, and Analysis of Recent Developments).
- 6.4.1 Biolchim SpA
- 6.4.2 Coromandel International Ltd
- 6.4.3 Genliduo Bio-tech Corporation Ltd
- 6.4.4 Gujarat State Fertilizers & Chemicals Ltd
- 6.4.5 Indian Farmers Fertiliser Cooperative Limited
- 6.4.6 Koppert Biological Systems Inc.
- 6.4.7 Novozymes
- 6.4.8 Sustane Natural Fertilizer Inc.
- 6.4.9 Valagro
- 6.4.10 Valent Biosciences LLC
7 KEY STRATEGIC QUESTIONS FOR AGRICULTURAL BIOLOGICALS CEOS
8 APPENDIX
- 8.1 Global Overview
- 8.1.1 Overview
- 8.1.2 Porter's Five Forces Framework
- 8.1.3 Global Value Chain Analysis
- 8.1.4 Market Dynamics (DROs)
- 8.2 Sources & References
- 8.3 List of Tables & Figures
- 8.4 Primary Insights
- 8.5 Data Pack
- 8.6 Glossary of Terms
