
|
市場調査レポート
商品コード
1693751
米国の農業用生物製剤:市場シェア分析、産業動向、統計、成長予測(2025~2030年)United States Agricultural Biologicals - Market Share Analysis, Industry Trends & Statistics, Growth Forecasts (2025 - 2030) |
||||||
カスタマイズ可能
適宜更新あり
|
|||||||
| 米国の農業用生物製剤:市場シェア分析、産業動向、統計、成長予測(2025~2030年) |
|
出版日: 2025年03月18日
発行: Mordor Intelligence
ページ情報: 英文 221 Pages
納期: 2~3営業日
|

全表示
- 概要
- 目次
概要
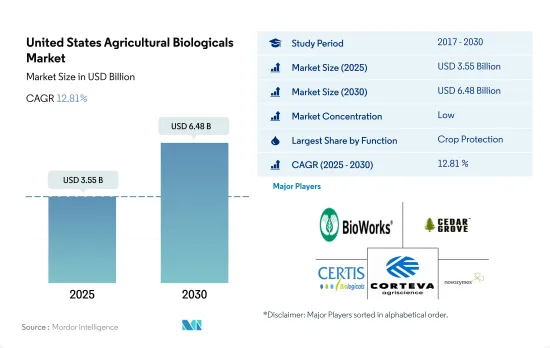
米国の農業用生物製剤市場規模は2025年に35億5,000万米ドルと推定され、2030年には64億8,000万米ドルに達すると予測され、予測期間(2025~2030年)のCAGRは12.81%で成長します。
- 2022年には、作物保護剤が米国の農業用生物製剤市場を牽引し、13億5,000万米ドルを占めました。生物農薬は米国農業用生物製剤市場で最も消費されており、2022年には作物保護セグメントで83.5%の最大シェアを占めました。生物農薬は生物農薬セグメントを支配しており、病原性真菌によって引き起こされる植物病害を防除するために使用されます。バイオ殺菌剤には微生物由来のものと植物由来のものがあります。バイオ殺菌剤サブセグメントの2022年の市場規模は6億5,090万米ドルで、同年の市場シェアは49.5%で、最も消費されている生物農薬タイプです。
- 米国のバイオ殺虫剤サブセグメントの2022年の市場規模は4億390万米ドルで、シェアは30.7%でした。バイオ農薬の中では2番目に消費量が多いです。
- 2022年の米国農業用生物製剤市場では、作物栄養剤が11億5,000万米ドルを占めました。2022年の米国農業用生物製剤市場において、作物栄養剤セグメントで最も消費されているのは有機肥料です。肥料は米国で最も消費される有機肥料であり、2022年には最大シェア46.7%を占めます。たい肥は植物由来と動物由来のものがあり、排泄物のような植物や動物の排泄物を分解したもので、一般に有機物が豊富です。動物性または植物性の排泄物の堆肥、農地堆肥、緑肥は、農業で使用される一般的なタイプです。
- 農業従事者の間で肥料の使い過ぎに対する意識が高まり、サステイナブル農法や有機農業を支援する政府の取り組みによって、作物栄養ベースの農業用生物製剤に対する需要が高まっています。そのため、市場は2023~2029年にかけて増加すると予測されています。
米国の農業用生物製剤市場の動向
国の法律と規制別、特に連作作物における有機栽培面積の増加
- 米国の有機農業は過去20年間で大幅に増加したが、これは主に特定の法規制の導入によるものです。2021年には、米国で有機農業が行われている面積は62万3,000ヘクタールとなりました。
- カリフォルニア州は、農産物全体で全米トップの売上を誇り、オーガニック生産でもトップで、3,000以上のオーガニック農場があります。相対的に見て、カリフォルニア州よりも有機農業に農地を割いている他の州はいくつかあり、有機農場は同州の農地面積の約4%にすぎないです。その代わり、有機農業従事者が相対的に多い州のトップは、メイン州、ニューヨーク州、バーモント州など北東部の州です。
- 全米の有機農業を支配しているのは耕作作物です。2021年には、有機農地全体の約71.8%を占めました。穀類の生産が優勢です。主要穀物はトウモロコシ、小麦、米、雑穀などです。オーガニック製品の消費は米国の消費者の間で人気となっており、様々な健康上の利点からオーガニック食品を選ぶ消費者が増えています。
- 有機園芸作物全体の栽培面積には増加傾向が見られ、2017年の11万2,900ヘクタールから2021年には15万6,100ヘクタールとなります。2021年の国内生産については、果物・野菜の上位5品目はリンゴ(31.1%)、イチゴ(9.5%)、オレンジ(6.9%)、ロメインレタス(6.7%)、ジャガイモ(6.2%)でした。貿易の場合、輸入が多いのはバナナ(53.1%)、アボカド(7.7%)、マンゴー(5.8%)、ブルーベリー(5.0%)、カボチャ(4.3%)で、輸出が多いのはリンゴ(80.0%)、ナシ(14.4%)、サクランボ(4.0%)、乾燥タマネギ(1.5%)、ジャガイモ(0.2%)です。
果物・野菜部門を中心とする有機農産物への需要の高まり、有機食品への1人当たり支出額の増加
- 米国は世界有数の有機製品消費国です。ニュートリションビジネスジャーナル誌(NBJ、2021年)によると、2020年の同国の有機食品の総売上高は516億米ドルでした。2021年には、米国は北米地域でオーガニック製品に対する一人当たりの支出が最も多く、158米ドル相当でした。
- オーガニック生鮮果物・野菜は、オーガニック食品小売産業が始まって以来、オーガニック食品の主要カテゴリーとなっています。2020年には、これらの有機製品の小売売上高は200億米ドルと評価され、有機農産物に対する需要の高まりを示しました。有機生鮮果物・野菜の需要は、過去20年間着実に上昇してきました。有機食品の売上が増加しているのは、特に高所得層の消費者意識の高まりによるものです。最も需要の高い有機食品カテゴリーには、卵、乳製品、果物、野菜などの基本食品が含まれます。
- オーガニック食品の嗜好は、人口層や地域によって異なります。18~29歳の若年層は、65歳以上の高齢層に比べてオーガニック製品を求める傾向が強い(50%超)。所得と地域も関係しており、所得が3万米ドル以下の人の42%、7万5,000米ドル以上の人の49%がオーガニック製品を求めています。
- 同国ではオーガニック製品に対する1人当たりの支出が増加しており、2017~2021年のCAGRは5.2%を記録しました。オーガニック製品に対する需要の高まりは、米国のオーガニック生産者が国内外の高価値市場を開拓する機会を生み出しています。有機製品に関連する価格プレミアムは、低所得の消費者にとって有機食品消費の主要制限要因の1つです。
米国の農業用生物製剤産業概要
米国の農業用生物製剤市場はセグメント化されており、上位5社で6.56%を占めています。この市場の主要企業は、Bioworks Inc.、Cedar Grove Composting Inc.、Certis USA LLC、Corteva Agriscience、Novozymesなどです。
その他の特典
- エクセル形式の市場予測(ME)シート
- 3ヶ月のアナリストサポート
目次
第1章 エグゼクティブサマリーと主要調査結果
第2章 レポートのオファー
第3章 イントロダクション
- 調査の前提条件と市場定義
- 調査範囲
- 調査手法
第4章 主要産業動向
- 有機栽培面積
- 一人当たりのオーガニック製品への支出
- 規制の枠組み
- 米国
- バリューチェーンと流通チャネル分析
第5章 市場セグメンテーション
- 機能
- 作物栄養
- バイオ肥料
- アゾスピリラム
- アゾトバクタ
- 菌根菌
- リン酸可溶化菌
- 根粒菌
- その他のバイオ肥料
- バイオ肥料
- アミノ酸
- フルボ酸
- 腐植酸
- タンパク質加水分解物
- 海藻エキス
- その他バイオスティミュラント
- 有機肥料
- 肥料
- ミールベース肥料
- オイルケーキ
- その他の有機肥料
- 作物保護
- 生物防除剤
- マクロ微生物
- 微生物
- 生物農薬
- バイオ殺菌剤
- バイオ除草剤
- 生物殺虫剤
- その他の生物農薬
- 作物栄養
- 作物タイプ
- 換金作物
- 園芸作物
- 耕作作物
第6章 競争情勢
- 主要な戦略的動き
- 市場シェア分析
- 企業情勢
- 企業プロファイル
- Andermatt Group AG
- Bioline AgroSciences Ltd
- Bioworks Inc.
- Cedar Grove Composting Inc.
- Certis USA LLC
- Corteva Agriscience
- Koppert Biological Systems Inc.
- Novozymes
- Sustane Natural Fertilizer Inc.
- Symborg Inc.
第7章 CEOへの主要戦略的質問
第8章 付録
- 世界概要
- 概要
- ファイブフォース分析フレームワーク
- 世界のバリューチェーン分析
- 市場力学(DROs)
- 情報源と参考文献
- 図表一覧
- 主要な洞察
- データパック
- 用語集
目次
Product Code: 500011
The United States Agricultural Biologicals Market size is estimated at 3.55 billion USD in 2025, and is expected to reach 6.48 billion USD by 2030, growing at a CAGR of 12.81% during the forecast period (2025-2030).
- In 2022, crop protection led the US agricultural biologicals market, accounting for USD 1.35 billion. Biopesticides are the most consumed in the US agricultural biologicals market and accounted for a maximum share of 83.5% in the crop protection segment in 2022. Biofungicides dominate the biopesticides segment and are used to control plant diseases that are caused by pathogenic fungi. Biofungicides may be of microbial or botanical origin. The biofungicides sub-segment was valued at USD 650.9 million in 2022, and they are the most consumed biopesticide type, with a market share of 49.5% in the same year.
- The bioinsecticides sub-segment in the United States was valued at USD 403.9 million in 2022, and it accounted for a share of 30.7%. They are the second-most consumed biopesticides.
- Crop nutrients accounted for USD 1.15 billion in the US agricultural biologicals market in 2022. Organic fertilizers were the most consumed in the US agricultural biologicals market in the crop nutrition segment in 2022. Manures are the most consumed organic fertilizer in the United States, accounting for a maximum share of 46.7% in 2022. Manures can be of plant or animal origin, and they are a decomposed form of plant or animal waste like excreta, generally rich in organic matter. Animal or plant waste compost manure, farmyard manure, and green manure are the common types used in agriculture.
- The increasing awareness about the overuse of fertilizers among farmers and the government initiatives to support sustainable agricultural practices and organic farming resulted in a rising demand for crop nutrition-based agricultural biologicals. Therefore, the market is anticipated to increase between 2023 and 2029.
United States Agricultural Biologicals Market Trends
Increase in organic area, particularly in row crops, due to country's laws and regulations
- Organic agriculture in the United States has increased significantly over the last 20 years, owing mostly to the introduction of particular laws and regulations. In 2021, the area under organic agricultural farming in the United States was 623 thousand hectares.
- California is the nation's top state for agricultural sales overall, and it is also the leader in organic production, with more than 3,000 organic farms. In relative terms, several other states devote a greater share of their farmland to organic farming than California, where organic farms represent only about 4% of the state's agricultural acreage. Instead, the list of top states for organic farms on a relative basis is led by northeastern states, including Maine, New York, and Vermont.
- Row crops dominate organic farming in the nation. In 2021, they accounted for about 71.8% of all organic cropland. The production of cereal crops predominates. The main cereals include maize, wheat, rice, and millet. The consumption of organic products has become popular among US consumers, who increasingly choose to eat organic foods because of their various health benefits.
- An increasing trend was observed in the overall organic horticulture crop cultivation area, from 112.9 thousand hectares in 2017 to 156.1 thousand hectares in 2021. Regarding domestic production in 2021, the top five fruits and vegetables were apples (31.1%), strawberries (9.5%), oranges (6.9%), romaine lettuce (6.7%), and potatoes (6.2%). In the case of trade, the most imported produce was bananas (53.1%), avocados (7.7%), mangoes (5.8%), blueberries (5.0%), and squash (4.3%), while the most exported were apples (80.0%), pears (14.4%), cherries (4.0%), dried onions (1.5%), and potatoes (0.2%).
Growing demand for organic produce especially in the fruits and vegetables sector, rise in per capita spending on organic food
- The United States is one of the largest organic product consumers in the world. In 2020, the country's total sales of organic food products accounted for USD 51.6 billion, according to the Nutrition Business Journal (NBJ, 2021). In 2021, the United States had the largest per capita spending on organic products in the North American region, worth USD 158.0.
- Organic fresh fruits and vegetables have been the leading organic food category since the organic food retail industry began. In 2020, retail sales for these organic products were valued at USD 20.0 billion, showing a growing demand for organic produce. The demand for organic fresh fruits and vegetables has steadily risen over the past two decades. Organic food sales are rising due to growing consumer awareness, especially among high-income consumers. The most in-demand organic categories include basic foods like eggs, dairy, fruits, and vegetables.
- Organic food preferences vary by demographic and region. Younger people of age between 18-29 are more likely to seek out organic products (over 50%) compared to older people aged 65 and above. Income and region also play a role, with 42% of those with under USD 30 thousand income and 49% of those with over USD 75.0 thousand seeking organic products.
- The per capita spending on organic products is increasing in the country, and it recorded a CAGR of 5.2% from 2017 to 2021. The growing demand for organic products creates opportunities for US organic producers to tap into high-value markets domestically and abroad. The price premium associated with organic products is one of the major limiting factors for organic food consumption for low-level income consumers.
United States Agricultural Biologicals Industry Overview
The United States Agricultural Biologicals Market is fragmented, with the top five companies occupying 6.56%. The major players in this market are Bioworks Inc., Cedar Grove Composting Inc., Certis USA LLC, Corteva Agriscience and Novozymes (sorted alphabetically).
Additional Benefits:
- The market estimate (ME) sheet in Excel format
- 3 months of analyst support
TABLE OF CONTENTS
1 EXECUTIVE SUMMARY & KEY FINDINGS
2 REPORT OFFERS
3 INTRODUCTION
- 3.1 Study Assumptions & Market Definition
- 3.2 Scope of the Study
- 3.3 Research Methodology
4 KEY INDUSTRY TRENDS
- 4.1 Area Under Organic Cultivation
- 4.2 Per Capita Spending On Organic Products
- 4.3 Regulatory Framework
- 4.3.1 United States
- 4.4 Value Chain & Distribution Channel Analysis
5 MARKET SEGMENTATION (includes market size in Value in USD and Volume, Forecasts up to 2030 and analysis of growth prospects)
- 5.1 Function
- 5.1.1 Crop Nutrition
- 5.1.1.1 Biofertilizer
- 5.1.1.1.1 Azospirillum
- 5.1.1.1.2 Azotobacter
- 5.1.1.1.3 Mycorrhiza
- 5.1.1.1.4 Phosphate Solubilizing Bacteria
- 5.1.1.1.5 Rhizobium
- 5.1.1.1.6 Other Biofertilizer
- 5.1.1.2 Biostimulants
- 5.1.1.2.1 Amino Acids
- 5.1.1.2.2 Fulvic Acid
- 5.1.1.2.3 Humic Acid
- 5.1.1.2.4 Protein Hydrolysates
- 5.1.1.2.5 Seaweed Extracts
- 5.1.1.2.6 Other Biostimulants
- 5.1.1.3 Organic Fertilizer
- 5.1.1.3.1 Manure
- 5.1.1.3.2 Meal Based Fertilizers
- 5.1.1.3.3 Oilcakes
- 5.1.1.3.4 Other Organic Fertilizer
- 5.1.2 Crop Protection
- 5.1.2.1 Biocontrol Agents
- 5.1.2.1.1 Macrobials
- 5.1.2.1.2 Microbials
- 5.1.2.2 Biopesticides
- 5.1.2.2.1 Biofungicides
- 5.1.2.2.2 Bioherbicides
- 5.1.2.2.3 Bioinsecticides
- 5.1.2.2.4 Other Biopesticides
- 5.1.1 Crop Nutrition
- 5.2 Crop Type
- 5.2.1 Cash Crops
- 5.2.2 Horticultural Crops
- 5.2.3 Row Crops
6 COMPETITIVE LANDSCAPE
- 6.1 Key Strategic Moves
- 6.2 Market Share Analysis
- 6.3 Company Landscape
- 6.4 Company Profiles (includes Global Level Overview, Market Level Overview, Core Business Segments, Financials, Headcount, Key Information, Market Rank, Market Share, Products and Services, and Analysis of Recent Developments).
- 6.4.1 Andermatt Group AG
- 6.4.2 Bioline AgroSciences Ltd
- 6.4.3 Bioworks Inc.
- 6.4.4 Cedar Grove Composting Inc.
- 6.4.5 Certis USA LLC
- 6.4.6 Corteva Agriscience
- 6.4.7 Koppert Biological Systems Inc.
- 6.4.8 Novozymes
- 6.4.9 Sustane Natural Fertilizer Inc.
- 6.4.10 Symborg Inc.
7 KEY STRATEGIC QUESTIONS FOR AGRICULTURAL BIOLOGICALS CEOS
8 APPENDIX
- 8.1 Global Overview
- 8.1.1 Overview
- 8.1.2 Porter's Five Forces Framework
- 8.1.3 Global Value Chain Analysis
- 8.1.4 Market Dynamics (DROs)
- 8.2 Sources & References
- 8.3 List of Tables & Figures
- 8.4 Primary Insights
- 8.5 Data Pack
- 8.6 Glossary of Terms
