
|
市場調査レポート
商品コード
1686316
農業用バイオロジカル:市場シェア分析、産業動向・統計、成長予測(2025年~2030年)Agricultural Biologicals - Market Share Analysis, Industry Trends & Statistics, Growth Forecasts (2025 - 2030) |
||||||
カスタマイズ可能
適宜更新あり
|
|||||||
| 農業用バイオロジカル:市場シェア分析、産業動向・統計、成長予測(2025年~2030年) |
|
出版日: 2025年03月18日
発行: Mordor Intelligence
ページ情報: 英文 402 Pages
納期: 2~3営業日
|

全表示
- 概要
- 目次
農業用バイオロジカルの市場規模は2025年に299億4,000万米ドルと推定され、2030年には474億2,000万米ドルに達すると予測され、予測期間中(2025~2030年)のCAGRは9.63%で成長すると予測されます。
- 2022年の世界の農業用バイオロジカル市場では、作物栄養分野が最も高いシェアを占め、金額で64.7%、数量で98.1%を占めました。有機肥料は2022年に作物栄養市場の約58.8%を占めたが、これはその膨大な入手可能性と安価なコストによるものです。
- 世界の有機肥料市場は、2022年に43.2%を占めたミールベースの肥料が支配的でした。骨粉は作物生産に必要なリンを満たすために主に使用され、一方、血粉は作物への窒素供給に主に使用されます。
- 2022年の作物栄養分野では、連作作物が81.3%を占め、次いで園芸作物が10.0%、換金作物が8.7%のシェアを占めています。連作作物の優位性は、その栽培面積の広さにも一因があります。
- 生物防除剤分野ではマクロ微生物が優勢で、2022年には31億1,000万米ドルを占めました。この高いシェアは、幅広い害虫を駆除する能力によるものです。他の生物防除生物と比較すると、マクロビアルは貪欲な捕食者です。
- 2022年には、捕食者は様々な害虫種とそのライフステージを攻撃する能力により、金額ベースでマクロ生物市場の約91.0%を占めました。
- 合成肥料の有害な影響に対する消費者の知識の高まりは、国際的にも国内的にも有機製品に対する需要を押し上げています。その結果、市場は2023年から2029年にかけて成長すると予想されます。
- 欧州地域は世界有数の有機作物生産地であり、有機製品の最大消費地でもあります。ドイツとフランスは同地域の主要な有機作物生産国のひとつであり、同地域市場の有機製品消費量において最も高い割合を占めています。全体的な有機作物栽培面積の増加により、地域市場は約22.9%拡大しています。市場は2023年から2029年の間にCAGR 8.5%で成長し、2029年には141億1,000万米ドルに達すると予想されます。
- アジア太平洋地域はオーガニック製品の生産が盛んで、市場規模では第2位です。中国とインドは同地域の主要な有機作物生産者であり、同地域最大の有機製品消費者でもあります。同地域の有機農業面積は2017年から2021年にかけて大幅に増加し、2017年の490万ヘクタールから2021年には690万ヘクタールに拡大しました。
- 北米は2022年の世界のバイオ肥料市場額の34.5%を占めました。同地域の有機作物の栽培面積は、2017年の140万ヘクタールから2021年には160万ヘクタールへと13.5%増加しました。同地域の有機食品に対する需要は急速に拡大しており、北米の有機食品に対する1人当たりの平均支出額は2021年に109.7米ドルと評価されました。
- 有機作物の作付面積が拡大し、有機製品と生物学的肥料の需要が高まることで、化学肥料の使用量全体と作物生産コストが低下します。有機農業を奨励する政府の取り組みは、2023年から2029年の間に世界の農業用バイオロジカル市場を牽引し、CAGR 9.4%を記録すると予想されます。
世界の農業用バイオロジカル市場の動向
北米と欧州では、意識の高まりと政府の取り組みにより、有機農業の生産量が過去最高を記録しています。
- 有機農業は持続可能な食糧システムに大きく貢献するものとして台頭し、世界187カ国で実践されています。2021年現在、世界の有機農地は7,230万haで、2018年から2021年にかけて全地域で平均2.9%増加しています。有機耕地は1,440万haで、有機農地全体の19.9%を占めています。
- 有機農業の最も強力な市場は北米と欧州で、世界の有機耕地の41.0%を占めています。2022年には、欧州には650万haの有機耕地があり、これは有機耕地全体の44.1%に相当します。北米と欧州で有機栽培されている最も重要な作物は、リンゴ、イチゴ、穀物、オリーブです。
- アジア太平洋の新興諸国も有機農業運動に参加し、国内需要を満たす新鮮な有機農産物の生産と供給で自給自足しつつあります。有機農業の動向はアジア太平洋で勢いを増しており、同地域では2017年から2022年にかけて有機耕地面積が18.8%増加します。この地域の政府による主要な取り組みも、有機農業の拡大傾向に重要な役割を果たしています。例えば、日本の食料・農業・農村基本計画は、2030年までに有機農家と有機農地の数を3倍に増やすことを目標としています。
- 有機農業の成長の原動力となっているのは、土壌の健康を促進し、環境への影響を低減し、より健康的な食品を生産するといった、有機農業の利点に対する意識の高まりです。
有機食品の1人当たり支出は主に米国とドイツで観察されるが、これはより健康的で持続可能な食品に対する消費者の需要に起因します。
- オーガニック食品市場は過去数年間に著しい成長を遂げ、世界の売上高は2012年の708億米ドルから2020年には1,206億米ドルに達します。有機食品への動向は、より健康的で持続可能な食品の選択肢を求める消費者需要の高まりや、従来型農業が環境に与える影響に対する意識の高まりなど、いくつかの要因に後押しされています。世界の有機食品市場は、今後数年間も成長傾向が続くと予想されます。
- オーガニック・トレード協会が2021年に実施した調査によると、同年のオーガニック果物・野菜の売上高は約4.5%増加し、オーガニック売上高全体の15%を占めました。オーガニック製品への平均支出額では北米が市場を独占しており、米国の1人当たり支出額は2021年に186.7米ドルに達し、北米諸国の中で最も高いです。欧州も有機食品市場で大きな成長が見込まれており、2021年の1人当たり支出額が最も高いのはドイツで75.6米ドルです。
- 有機食品市場は、消費者の可処分所得の高い先進諸国が依然として支配的であるが、新興諸国でも成長が見込まれます。例えば、アジア太平洋地域では労働者階級が増加しており、有機食品を入手しやすく手頃な価格で購入できるようになっているため、市場の拡大に寄与する可能性があります。
農業用バイオロジカル産業の概要
農業用バイオロジカル市場は断片化されており、上位5社で4.05%を占めています。この市場の主要企業は以下の通りです。 Biobest Group NV, Corteva Agriscience, Koppert Biological Systems Inc., Sustane Natural Fertilizer Inc. and Valent Biosciences LLC(sorted alphabetically).
その他の特典
- エクセル形式の市場予測(ME)シート
- 3ヶ月のアナリストサポート
目次
第1章 エグゼクティブサマリーと主な調査結果
第2章 レポートのオファー
第3章 イントロダクション
- 調査の前提条件と市場定義
- 調査範囲
- 調査手法
第4章 主要産業動向
- 有機栽培面積
- 一人当たりのオーガニック製品への支出
- 規制の枠組み
- アルゼンチン
- オーストラリア
- ブラジル
- カナダ
- 中国
- エジプト
- フランス
- ドイツ
- インド
- インドネシア
- イタリア
- 日本
- メキシコ
- オランダ
- ナイジェリア
- フィリピン
- ロシア
- 南アフリカ
- スペイン
- タイ
- トルコ
- 英国
- 米国
- ベトナム
- バリューチェーンと流通チャネル分析
第5章 市場セグメンテーション
- 機能
- 作物栄養
- バイオ肥料
- アゾスピリラム
- アゾトバクター
- 菌根菌
- リン酸可溶化菌
- 根粒菌
- その他のバイオ肥料
- バイオ肥料
- アミノ酸
- フルボ酸
- 腐植酸
- タンパク質加水分解物
- 海藻エキス
- その他バイオスティミュラント
- 有機肥料
- 肥料
- ミールベース肥料
- オイルケーキ
- その他の有機肥料
- 作物保護
- 生物防除剤
- マクロ微生物
- 微生物
- 生物農薬
- バイオ殺菌剤
- バイオ除草剤
- 生物殺虫剤
- その他の生物農薬
- 作物栄養
- 作物の種類
- 換金作物
- 園芸作物
- 耕作作物
- 地域
- アフリカ
- エジプト
- ナイジェリア
- 南アフリカ
- その他のアフリカ
- アジア太平洋
- オーストラリア
- 中国
- インド
- インドネシア
- 日本
- フィリピン
- タイ
- ベトナム
- その他アジア太平洋地域
- 欧州
- フランス
- ドイツ
- イタリア
- オランダ
- ロシア
- スペイン
- トルコ
- 英国
- その他欧州
- 中東
- イラン
- サウジアラビア
- その他中東
- 北米
- カナダ
- メキシコ
- 米国
- その他北米地域
- 南米
- アルゼンチン
- ブラジル
- その他南米
- アフリカ
第6章 競合情勢
- 主要な戦略動向
- 市場シェア分析
- 企業情勢
- 企業プロファイル.
- Agriculture Solutions Inc.
- Biobest Group NV
- Bioworks Inc.
- California Organic Fertilizers Inc.
- Cascade Agronomics LLC
- Corteva Agriscience
- Indogulf BioAg LLC(Biotech Division of Indogulf Company)
- Koppert Biological Systems Inc.
- Lallemand Inc.
- Samriddhi Crops India Pvt Ltd
- Sigma Agriscience LLC
- Sustane Natural Fertilizer Inc.
- Symborg Inc.
- The Espoma Company
- Valent Biosciences LLC
第7章 CEOへの主な戦略的質問
第8章 付録
- 世界の概要
- 概要
- ファイブフォース分析フレームワーク
- 世界のバリューチェーン分析
- 市場力学(DROs)
- 情報源と参考文献
- 図表一覧
- 主要洞察
- データパック
- 用語集
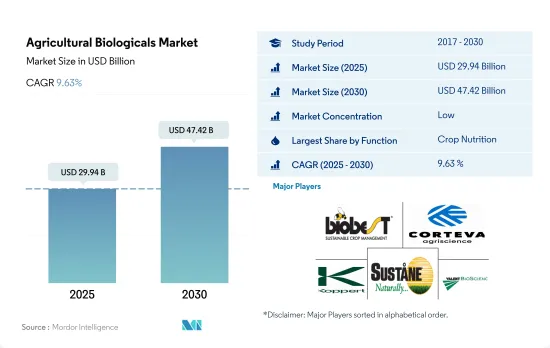
The Agricultural Biologicals Market size is estimated at 29.94 billion USD in 2025, and is expected to reach 47.42 billion USD by 2030, growing at a CAGR of 9.63% during the forecast period (2025-2030).
- The crop nutrition segment held the highest share of the global agricultural biologicals market in 2022, accounting for 64.7% by value and 98.1% by volume. Organic fertilizers accounted for about 58.8% of the crop nutrition market in 2022, owing to their vast availability and inexpensive cost.
- The global organic fertilizer market was dominated by meal-based fertilizers, which accounted for 43.2% in 2022. Bone meal is largely used to meet the phosphorus requirements of crop production, whereas blood meal is mostly used to supply nitrogen in crops.
- Row crops accounted for 81.3% of the crop nutrition segment in 2022, followed by horticultural and cash crops, which held shares of 10.0% and 8.7%, respectively. The dominance of row crops was partly due to their large cultivation area.
- Macrobials dominated the biocontrol agents segment, accounting for USD 3.11 billion in 2022. This high share was due to their ability to control a wide range of pests. When compared to other biocontrol organisms, macrobials are voracious feeders.
- In 2022, predators accounted for about 91.0% of the macrobial market by value due to their ability to attack various pest species and their life stages.
- Consumers' growing knowledge of the detrimental effects of synthetic fertilizers is boosting the demand for organic products both internationally and domestically. As a result, the market is expected to grow between 2023 and 2029.
- The European region is one of the world's major producers of organic crops and the largest consumer of organic products. Germany and France are some of the major organic crop producers in the region, and they account for the highest organic product consumption in the regional market. Due to the rise in the overall organic crop area, the regional market has expanded by about 22.9%. The market is expected to grow by a CAGR of 8.5% between 2023 and 2029, reaching USD 14.11 billion by 2029.
- The Asia-Pacific region is a large producer of organic products, ranking second in terms of market value. China and India are the region's leading organic crop producers and the region's largest organic product consumers as well. The region's organic agricultural area increased significantly from 2017 to 2021, growing from 4.9 million hectares in 2017 to 6.9 million hectares in 2021.
- North America accounted for 34.5% of the global biofertilizers market value in 2022. The area under cultivation of organic crops in the region increased by 13.5% from 1.4 million hectares in 2017 to 1.6 million hectares in 2021. The demand for organic food in the region is growing rapidly, with an average per capita spending on organic food products in North America valued at USD 109.7 in 2021.
- The expanding organic crop areas and the rising demand for organic products and biological fertilizers lower the overall chemical fertilizer usage and crop production costs. The governments' efforts to encourage organic farming are expected to drive the global agricultural biologicals market between 2023 and 2029, registering a CAGR of 9.4%.
Global Agricultural Biologicals Market Trends
Organic production is at an all-time high in North America and Europe, due to the increasing awareness and Government initiatives.
- Organic agriculture has emerged as a significant contributor to sustainable food systems, with 187 countries practicing it globally. As of 2021, there was 72.3 million ha of organic agricultural land worldwide, with an average increase of 2.9% across all regions from 2018 to 2021. Organic arable land accounted for 14.4 million ha, representing 19.9% of the total organic agricultural land.
- The strongest markets for organic farming are North America and Europe, accounting for 41.0% of the global organic arable land. In 2022, Europe had 6.5 million ha of organic arable land, equivalent to 44.1% of the overall organic arable agricultural area. The most significant crops grown organically in North America and Europe are apples, strawberries, cereals, and olives.
- Developing countries in Asia-Pacific are also joining the organic agriculture movement and becoming self-sufficient in producing and providing fresh organic produce to meet their domestic demand. The trend of organic farming is gaining momentum in Asia-Pacific, with the region recording an 18.8% increase in organic arable land from 2017 to 2022. The major initiatives by governments in the region also play a vital role in the growing trend of organic farming. For example, Japan's Basic Plan for Food, Agriculture, and Rural Areas aims to triple the number of organic farmers and lands by 2030.
- The growth of organic agriculture is driven by the rising awareness of the benefits of organic farming, such as promoting soil health, reducing environmental impacts, and producing healthier food.
Per capita spending of organic food majorly observed in United States and Germany, attributed to the consumer demand for healthier and sustainable food
- The organic food market experienced significant growth in the past few years, with global sales reaching USD 120.6 billion in 2020, up from USD 70.8 billion in 2012. The trend toward organic food is being driven by several factors, such as increasing consumer demand for healthier, more sustainable food options and a growing awareness of the environmental impact of conventional agriculture. The global organic food market is expected to continue its growth trend over the coming years.
- According to a survey conducted by the Organic Trade Association in 2021, sales of organic fruits and vegetables increased by around 4.5% in the same year, accounting for 15% of the overall organic sales. North America dominates the market in terms of average spending on organic products, with per capita spending in the United States reaching USD 186.7 in 2021, the highest among all North American countries. Europe is also expected to experience significant growth in the organic food market, with Germany accounting for the highest per capita spending of USD 75.6 in 2021.
- While the organic food market is still dominated by developed countries with high consumer disposable incomes, it is also expected to grow in developing nations. For example, the increasing number of working-class people in the Asia-Pacific region may contribute to the market's expansion due to the growing availability and affordability of organic food products.
Agricultural Biologicals Industry Overview
The Agricultural Biologicals Market is fragmented, with the top five companies occupying 4.05%. The major players in this market are Biobest Group NV, Corteva Agriscience, Koppert Biological Systems Inc., Sustane Natural Fertilizer Inc. and Valent Biosciences LLC (sorted alphabetically).
Additional Benefits:
- The market estimate (ME) sheet in Excel format
- 3 months of analyst support
TABLE OF CONTENTS
1 EXECUTIVE SUMMARY & KEY FINDINGS
2 REPORT OFFERS
3 INTRODUCTION
- 3.1 Study Assumptions & Market Definition
- 3.2 Scope of the Study
- 3.3 Research Methodology
4 KEY INDUSTRY TRENDS
- 4.1 Area Under Organic Cultivation
- 4.2 Per Capita Spending On Organic Products
- 4.3 Regulatory Framework
- 4.3.1 Argentina
- 4.3.2 Australia
- 4.3.3 Brazil
- 4.3.4 Canada
- 4.3.5 China
- 4.3.6 Egypt
- 4.3.7 France
- 4.3.8 Germany
- 4.3.9 India
- 4.3.10 Indonesia
- 4.3.11 Italy
- 4.3.12 Japan
- 4.3.13 Mexico
- 4.3.14 Netherlands
- 4.3.15 Nigeria
- 4.3.16 Philippines
- 4.3.17 Russia
- 4.3.18 South Africa
- 4.3.19 Spain
- 4.3.20 Thailand
- 4.3.21 Turkey
- 4.3.22 United Kingdom
- 4.3.23 United States
- 4.3.24 Vietnam
- 4.4 Value Chain & Distribution Channel Analysis
5 MARKET SEGMENTATION (includes market size in Value in USD and Volume, Forecasts up to 2030 and analysis of growth prospects)
- 5.1 Function
- 5.1.1 Crop Nutrition
- 5.1.1.1 Biofertilizer
- 5.1.1.1.1 Azospirillum
- 5.1.1.1.2 Azotobacter
- 5.1.1.1.3 Mycorrhiza
- 5.1.1.1.4 Phosphate Solubilizing Bacteria
- 5.1.1.1.5 Rhizobium
- 5.1.1.1.6 Other Biofertilizers
- 5.1.1.2 Biostimulants
- 5.1.1.2.1 Amino Acids
- 5.1.1.2.2 Fulvic Acid
- 5.1.1.2.3 Humic Acid
- 5.1.1.2.4 Protein Hydrolysates
- 5.1.1.2.5 Seaweed Extracts
- 5.1.1.2.6 Other Biostimulants
- 5.1.1.3 Organic Fertilizer
- 5.1.1.3.1 Manure
- 5.1.1.3.2 Meal Based Fertilizers
- 5.1.1.3.3 Oilcakes
- 5.1.1.3.4 Other Organic Fertilizers
- 5.1.2 Crop Protection
- 5.1.2.1 Biocontrol Agents
- 5.1.2.1.1 Macrobials
- 5.1.2.1.2 Microbials
- 5.1.2.2 Biopesticides
- 5.1.2.2.1 Biofungicides
- 5.1.2.2.2 Bioherbicides
- 5.1.2.2.3 Bioinsecticides
- 5.1.2.2.4 Other Biopesticides
- 5.1.1 Crop Nutrition
- 5.2 Crop Type
- 5.2.1 Cash Crops
- 5.2.2 Horticultural Crops
- 5.2.3 Row Crops
- 5.3 Region
- 5.3.1 Africa
- 5.3.1.1 Egypt
- 5.3.1.2 Nigeria
- 5.3.1.3 South Africa
- 5.3.1.4 Rest of Africa
- 5.3.2 Asia-Pacific
- 5.3.2.1 Australia
- 5.3.2.2 China
- 5.3.2.3 India
- 5.3.2.4 Indonesia
- 5.3.2.5 Japan
- 5.3.2.6 Philippines
- 5.3.2.7 Thailand
- 5.3.2.8 Vietnam
- 5.3.2.9 Rest of Asia-Pacific
- 5.3.3 Europe
- 5.3.3.1 France
- 5.3.3.2 Germany
- 5.3.3.3 Italy
- 5.3.3.4 Netherlands
- 5.3.3.5 Russia
- 5.3.3.6 Spain
- 5.3.3.7 Turkey
- 5.3.3.8 United Kingdom
- 5.3.3.9 Rest of Europe
- 5.3.4 Middle East
- 5.3.4.1 Iran
- 5.3.4.2 Saudi Arabia
- 5.3.4.3 Rest of Middle East
- 5.3.5 North America
- 5.3.5.1 Canada
- 5.3.5.2 Mexico
- 5.3.5.3 United States
- 5.3.5.4 Rest of North America
- 5.3.6 South America
- 5.3.6.1 Argentina
- 5.3.6.2 Brazil
- 5.3.6.3 Rest of South America
- 5.3.1 Africa
6 COMPETITIVE LANDSCAPE
- 6.1 Key Strategic Moves
- 6.2 Market Share Analysis
- 6.3 Company Landscape
- 6.4 Company Profiles (includes Global Level Overview, Market Level Overview, Core Business Segments, Financials, Headcount, Key Information, Market Rank, Market Share, Products and Services, and Analysis of Recent Developments).
- 6.4.1 Agriculture Solutions Inc.
- 6.4.2 Biobest Group NV
- 6.4.3 Bioworks Inc.
- 6.4.4 California Organic Fertilizers Inc.
- 6.4.5 Cascade Agronomics LLC
- 6.4.6 Corteva Agriscience
- 6.4.7 Indogulf BioAg LLC (Biotech Division of Indogulf Company)
- 6.4.8 Koppert Biological Systems Inc.
- 6.4.9 Lallemand Inc.
- 6.4.10 Samriddhi Crops India Pvt Ltd
- 6.4.11 Sigma Agriscience LLC
- 6.4.12 Sustane Natural Fertilizer Inc.
- 6.4.13 Symborg Inc.
- 6.4.14 The Espoma Company
- 6.4.15 Valent Biosciences LLC
7 KEY STRATEGIC QUESTIONS FOR AGRICULTURAL BIOLOGICALS CEOS
8 APPENDIX
- 8.1 Global Overview
- 8.1.1 Overview
- 8.1.2 Porter's Five Forces Framework
- 8.1.3 Global Value Chain Analysis
- 8.1.4 Market Dynamics (DROs)
- 8.2 Sources & References
- 8.3 List of Tables & Figures
- 8.4 Primary Insights
- 8.5 Data Pack
- 8.6 Glossary of Terms

