|
|
市場調査レポート
商品コード
1682845
エンターテインメント用没入型ディスプレイの世界市場:市場規模・シェア・動向分析 (技術別、解像度別、用途別、地域別)・展望・将来予測 (2024年~2031年)Global Immersive Display In Entertainment Market Size, Share & Trends Analysis Report By Technology, By Resolution, By Application, By Regional Outlook and Forecast, 2024 - 2031 |
||||||
|
|||||||
|
|||||||


| エンターテインメント用没入型ディスプレイの世界市場:市場規模・シェア・動向分析 (技術別、解像度別、用途別、地域別)・展望・将来予測 (2024年~2031年) |
|
出版日: 2025年03月07日
発行: KBV Research
ページ情報: 英文 276 Pages
納期: 即納可能
|

全表示
- 概要
- 図表
- 目次
世界のエンターテインメント用没入型ディスプレイの市場規模は、予測期間中に23.1%のCAGRで市場が成長し、2031年までに132億1,000万米ドルに達すると予想されています。
KBV Cardinal matrixで提示された分析に基づくと、Microsoft CorporationとMeta Platforms、Inc.は、エンターテインメント用没入型ディスプレイ市場の先駆者です。Samsung Electronics Co.、Ltd.、Sony Corporation、Panasonic Holdings Corporationなどの企業は、エンターテインメント用没入型ディスプレイ市場の主要なイノベーターです。2024年12月、Meta Platforms、Inc.は、多国籍コングロマリット企業であるLGとの提携を発表し、拡張現実と仮想現実を融合してシームレスな体験を実現する次世代の複合現実ヘッドセットを開発します。MetaのVRコンテンツとLGの高度なディスプレイ技術を組み合わせたこのヘッドセットは、AppleのVision Proに匹敵し、没入型エンターテイメント、スマートホーム統合などを提供することを目指しています。
市場成長要因
4K、8K、OLED、マイクロLEDなどの高解像度ディスプレイの採用により、画像の鮮明さ、深み、鮮やかさが大幅に向上しました。4Kおよび8Kディスプレイは、非常に精細な超高精細映像を提供し、ゲーム、映画、ホームシアターでの体験を豊かにします。自発光ピクセルを備えたOLEDテクノロジーは、完璧な黒と鮮やかな色を実現し、より豊かなコントラストとよりリアルな画像をもたらします。したがって、こうしたディスプレイ技術の進歩により、没入型エンターテイメント体験の品質と深みが大幅に向上しています。
さらに、5Gネットワークの迅速な展開と高速インターネットの利用可能性の拡大により、特に拡張現実(AR)と仮想現実(VR)の分野で、没入型テクノロジーの成長と採用が大幅に加速しました。したがって、5Gネットワークが世界的に拡大し、高速インターネットがより普及するにつれて、没入型ディスプレイのアクセシビリティと採用は引き続き増加します。
市場抑制要因
仮想現実(VR)や拡張現実(AR)などのテクノロジーを使用して没入型体験を開発するには、ハードウェアとソフトウェアに多額の資金を投資する必要があります。高品質のVRヘッドセット、ARグラス、モーションセンサー、触覚フィードバックデバイスは高価な場合が多く、全体的な開発コストが増加します。そのため、エンターテインメント分野での市場の拡大は、法外な開発費と実装費によって大幅に妨げられています。
技術別の展望
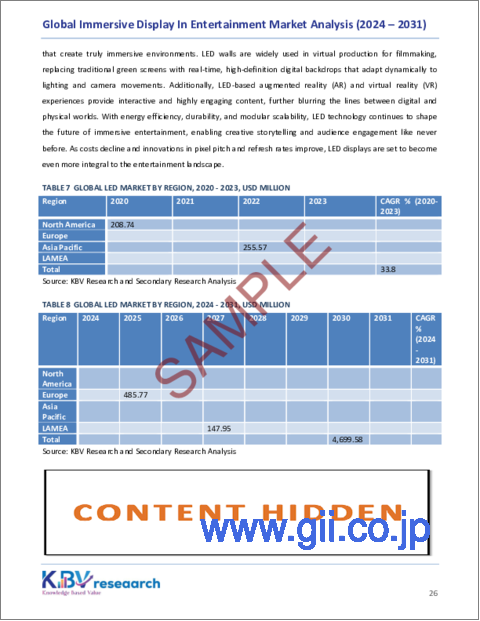
技術に基づいて、市場はLED、OLED、その他に分類されます。LEDセグメントは、2023年に市場で47%の収益シェアを獲得しました。LEDディスプレイは、高い輝度レベル、鮮やかな色、長持ちするパフォーマンスを提供し、大型スクリーン、ゲーム用ディスプレイ、仮想現実セットアップなどのさまざまなエンターテイメントアプリケーションに最適です。LED技術は製造コストとメンテナンスコストが比較的低いため、消費者と企業の両方が利用しやすく、幅広い採用が促進されています。
解像度別の展望
解像度に基づいて、市場は4K、8K、その他に分かれています。8Kセグメントは、2023年に市場で22%の収益シェアを記録しました。最先端の視覚忠実度と超没入型体験の追求が8Kセグメントを推進しています。4Kの4倍の解像度を提供する8Kディスプレイは、信じられないほど詳細でリアルなビジュアルを提供し、ハイエンドのゲーム、VRシミュレーション、エンターテイメント会場の大型ディスプレイなどのプレミアムアプリケーションに最適です。
用途別の展望
アプリケーション別に見ると、市場は劇場・映画館、娯楽施設、博物館・展示会、コンテンツ制作スタジオ、テーマパーク・遊園地、その他に分類されています。劇場・映画館セグメントは、2023年に市場で26%の収益シェアを記録しました。映画館では、ユニークな娯楽体験を求める観客を引き付けるために、大型スクリーン、3D投影、IMAX、4DXなどの高度なディスプレイ技術をますます取り入れています。これらの没入型フォーマットは、高解像度のビジュアル、サラウンドサウンド、座席の動きや香りなどの環境効果を組み合わせ、映画鑑賞体験全体を高めます。
地域別の展望
地域別に見ると、市場は北米、欧州、アジア太平洋、ラテンアメリカ・中東・アフリカにわたって分析されています。欧州セグメントは、2023年に市場で29%の収益シェアを記録しました。英国、ドイツ、フランスなどの国では、劇場、博物館、展示会、テーマパークで没入型ディスプレイを大幅に採用しています。欧州の豊かな文化遺産は、博物館や展示会での没入型テクノロジーの統合を推進し、インタラクティブなARおよびVR体験を通じて訪問者のエンゲージメントを強化しています。
市場競争と特性
エンターテインメント用没入型ディスプレイ市場は、急速な技術進歩と没入型体験に対する消費者の需要の高まりにより、熾烈な競争が繰り広げられています。企業は、ディスプレイ技術、コンテンツ作成、ユーザーインターフェイス設計の革新を通じて市場シェアを競っています。主な戦略には、解像度の向上、視野の拡大、感覚的な没入感の向上などがあり、視聴者を魅了します。市場参入企業は、ユーザーインタラクションの強化と遅延の削減にも注力し、世界中のさまざまなプラットフォームや会場でシームレスで魅力的なエンターテイメント体験を提供することを目指しています。
目次
第1章 市場の範囲と分析手法
- 市場の定義
- 目的
- 市場範囲
- セグメンテーション
- 分析手法
第2章 市場要覧
- 主なハイライト
第3章 市場概要
- イントロダクション
- 概要
- 市場構成とシナリオ
- 概要
- 市場に影響を与える主な要因
- 市場促進要因
- 市場抑制要因
- 市場機会
- 市場の課題
第4章 競争分析:世界市場
- KBV Cardinal Matrix
- 最近の業界全体の戦略的展開
- 事業提携・協力、契約
- 製品発売・拡大
- 企業合併・買収 (M&A)
- 市場シェア分析 (2023年)
- 主要な成功戦略
- 主な戦略
- 主要な戦略的動き
- ポーターのファイブフォース分析
第5章 世界のエンターテインメント用没入型ディスプレイ市場:技術別
- 世界のLED市場:地域別
- 世界のOLED市場:地域別
- 世界のその他の技術市場:地域別
第6章 世界のエンターテインメント用没入型ディスプレイ市場:解像度別
- 世界の4K市場:地域別
- 世界の8K市場:地域別
- 世界のその他の解像度市場:地域別
第7章 世界のエンターテインメント用没入型ディスプレイ市場:用途別
- 世界の劇場・映画館市場:地域別
- 世界のエンターテイメント会場市場:地域別
- 世界のテーマパーク・遊園地市場:地域別
- 世界の博物館・展示会市場:地域別
- 世界のコンテンツ制作スタジオ市場:地域別
- 世界のその他の用途市場:地域別
第8章 世界のエンターテインメント用没入型ディスプレイ市場:地域別
- 北米
- 北米のエンターテインメント用没入型ディスプレイ市場:国別
- 米国
- カナダ
- メキシコ
- その他北米地域
- 北米のエンターテインメント用没入型ディスプレイ市場:国別
- 欧州
- 欧州のエンターテインメント用没入型ディスプレイ市場:国別
- ドイツ
- 英国
- フランス
- ロシア
- スペイン
- イタリア
- その他欧州地域
- 欧州のエンターテインメント用没入型ディスプレイ市場:国別
- アジア太平洋
- アジア太平洋のエンターテインメント用没入型ディスプレイ市場:国別
- 中国
- 日本
- インド
- 韓国
- シンガポール
- マレーシア
- その他アジア太平洋地域
- アジア太平洋のエンターテインメント用没入型ディスプレイ市場:国別
- ラテンアメリカ・中東・アフリカ
- ラテンアメリカ・中東・アフリカのエンターテインメント用没入型ディスプレイ市場:国別
- ブラジル
- アルゼンチン
- アラブ首長国連邦
- サウジアラビア
- 南アフリカ
- ナイジェリア
- その他ラテンアメリカ・中東・アフリカ地域
- ラテンアメリカ・中東・アフリカのエンターテインメント用没入型ディスプレイ市場:国別
第9章 企業プロファイル
- Barco NV
- Leyard Optoelectronic Co Ltd
- LG Electronics, Inc(LG Corporation)
- Panasonic Holdings Corporation
- Samsung Electronics Co, Ltd.(Samsung Group)
- Sharp Corporation
- Sony Corporation
- HTC Corporation
- Meta Platforms, Inc
- Microsoft Corporation
第10章 エンターテインメント用没入型ディスプレイ市場の成功必須条件
LIST OF TABLES
- TABLE 1 Global Immersive Display In Entertainment Market, 2020 - 2023, USD Million
- TABLE 2 Global Immersive Display In Entertainment Market, 2024 - 2031, USD Million
- TABLE 3 Partnerships, Collaborations and Agreements- Immersive Display In Entertainment Market
- TABLE 4 Product Launches And Product Expansions- Immersive Display In Entertainment Market
- TABLE 5 Global Immersive Display In Entertainment Market by Technology, 2020 - 2023, USD Million
- TABLE 6 Global Immersive Display In Entertainment Market by Technology, 2024 - 2031, USD Million
- TABLE 7 Global LED Market by Region, 2020 - 2023, USD Million
- TABLE 8 Global LED Market by Region, 2024 - 2031, USD Million
- TABLE 9 Global OLED Market by Region, 2020 - 2023, USD Million
- TABLE 10 Global OLED Market by Region, 2024 - 2031, USD Million
- TABLE 11 Global Other Technology Market by Region, 2020 - 2023, USD Million
- TABLE 12 Global Other Technology Market by Region, 2024 - 2031, USD Million
- TABLE 13 Global Immersive Display In Entertainment Market by Resolution, 2020 - 2023, USD Million
- TABLE 14 Global Immersive Display In Entertainment Market by Resolution, 2024 - 2031, USD Million
- TABLE 15 Global 4K Market by Region, 2020 - 2023, USD Million
- TABLE 16 Global 4K Market by Region, 2024 - 2031, USD Million
- TABLE 17 Global 8K Market by Region, 2020 - 2023, USD Million
- TABLE 18 Global 8K Market by Region, 2024 - 2031, USD Million
- TABLE 19 Global Other Resolution Market by Region, 2020 - 2023, USD Million
- TABLE 20 Global Other Resolution Market by Region, 2024 - 2031, USD Million
- TABLE 21 Global Immersive Display In Entertainment Market by Application, 2020 - 2023, USD Million
- TABLE 22 Global Immersive Display In Entertainment Market by Application, 2024 - 2031, USD Million
- TABLE 23 Global Theater & Cinema Market by Region, 2020 - 2023, USD Million
- TABLE 24 Global Theater & Cinema Market by Region, 2024 - 2031, USD Million
- TABLE 25 Global Entertainment Venues Market by Region, 2020 - 2023, USD Million
- TABLE 26 Global Entertainment Venues Market by Region, 2024 - 2031, USD Million
- TABLE 27 Global Theme Parks & Amusement Parks Market by Region, 2020 - 2023, USD Million
- TABLE 28 Global Theme Parks & Amusement Parks Market by Region, 2024 - 2031, USD Million
- TABLE 29 Global Museum & Exhibitions Market by Region, 2020 - 2023, USD Million
- TABLE 30 Global Museum & Exhibitions Market by Region, 2024 - 2031, USD Million
- TABLE 31 Global Content Creation Studios Market by Region, 2020 - 2023, USD Million
- TABLE 32 Global Content Creation Studios Market by Region, 2024 - 2031, USD Million
- TABLE 33 Global Other Application Market by Region, 2020 - 2023, USD Million
- TABLE 34 Global Other Application Market by Region, 2024 - 2031, USD Million
- TABLE 35 Global Immersive Display In Entertainment Market by Region, 2020 - 2023, USD Million
- TABLE 36 Global Immersive Display In Entertainment Market by Region, 2024 - 2031, USD Million
- TABLE 37 North America Immersive Display In Entertainment Market, 2020 - 2023, USD Million
- TABLE 38 North America Immersive Display In Entertainment Market, 2024 - 2031, USD Million
- TABLE 39 North America Immersive Display In Entertainment Market by Technology, 2020 - 2023, USD Million
- TABLE 40 North America Immersive Display In Entertainment Market by Technology, 2024 - 2031, USD Million
- TABLE 41 North America LED Market by Country, 2020 - 2023, USD Million
- TABLE 42 North America LED Market by Country, 2024 - 2031, USD Million
- TABLE 43 North America OLED Market by Country, 2020 - 2023, USD Million
- TABLE 44 North America OLED Market by Country, 2024 - 2031, USD Million
- TABLE 45 North America Other Technology Market by Country, 2020 - 2023, USD Million
- TABLE 46 North America Other Technology Market by Country, 2024 - 2031, USD Million
- TABLE 47 North America Immersive Display In Entertainment Market by Resolution, 2020 - 2023, USD Million
- TABLE 48 North America Immersive Display In Entertainment Market by Resolution, 2024 - 2031, USD Million
- TABLE 49 North America 4K Market by Country, 2020 - 2023, USD Million
- TABLE 50 North America 4K Market by Country, 2024 - 2031, USD Million
- TABLE 51 North America 8K Market by Country, 2020 - 2023, USD Million
- TABLE 52 North America 8K Market by Country, 2024 - 2031, USD Million
- TABLE 53 North America Other Resolution Market by Country, 2020 - 2023, USD Million
- TABLE 54 North America Other Resolution Market by Country, 2024 - 2031, USD Million
- TABLE 55 North America Immersive Display In Entertainment Market by Application, 2020 - 2023, USD Million
- TABLE 56 North America Immersive Display In Entertainment Market by Application, 2024 - 2031, USD Million
- TABLE 57 North America Theater & Cinema Market by Country, 2020 - 2023, USD Million
- TABLE 58 North America Theater & Cinema Market by Country, 2024 - 2031, USD Million
- TABLE 59 North America Entertainment Venues Market by Country, 2020 - 2023, USD Million
- TABLE 60 North America Entertainment Venues Market by Country, 2024 - 2031, USD Million
- TABLE 61 North America Theme Parks & Amusement Parks Market by Country, 2020 - 2023, USD Million
- TABLE 62 North America Theme Parks & Amusement Parks Market by Country, 2024 - 2031, USD Million
- TABLE 63 North America Museum & Exhibitions Market by Country, 2020 - 2023, USD Million
- TABLE 64 North America Museum & Exhibitions Market by Country, 2024 - 2031, USD Million
- TABLE 65 North America Content Creation Studios Market by Country, 2020 - 2023, USD Million
- TABLE 66 North America Content Creation Studios Market by Country, 2024 - 2031, USD Million
- TABLE 67 North America Other Application Market by Country, 2020 - 2023, USD Million
- TABLE 68 North America Other Application Market by Country, 2024 - 2031, USD Million
- TABLE 69 North America Immersive Display In Entertainment Market by Country, 2020 - 2023, USD Million
- TABLE 70 North America Immersive Display In Entertainment Market by Country, 2024 - 2031, USD Million
- TABLE 71 US Immersive Display In Entertainment Market, 2020 - 2023, USD Million
- TABLE 72 US Immersive Display In Entertainment Market, 2024 - 2031, USD Million
- TABLE 73 US Immersive Display In Entertainment Market by Technology, 2020 - 2023, USD Million
- TABLE 74 US Immersive Display In Entertainment Market by Technology, 2024 - 2031, USD Million
- TABLE 75 US Immersive Display In Entertainment Market by Resolution, 2020 - 2023, USD Million
- TABLE 76 US Immersive Display In Entertainment Market by Resolution, 2024 - 2031, USD Million
- TABLE 77 US Immersive Display In Entertainment Market by Application, 2020 - 2023, USD Million
- TABLE 78 US Immersive Display In Entertainment Market by Application, 2024 - 2031, USD Million
- TABLE 79 Canada Immersive Display In Entertainment Market, 2020 - 2023, USD Million
- TABLE 80 Canada Immersive Display In Entertainment Market, 2024 - 2031, USD Million
- TABLE 81 Canada Immersive Display In Entertainment Market by Technology, 2020 - 2023, USD Million
- TABLE 82 Canada Immersive Display In Entertainment Market by Technology, 2024 - 2031, USD Million
- TABLE 83 Canada Immersive Display In Entertainment Market by Resolution, 2020 - 2023, USD Million
- TABLE 84 Canada Immersive Display In Entertainment Market by Resolution, 2024 - 2031, USD Million
- TABLE 85 Canada Immersive Display In Entertainment Market by Application, 2020 - 2023, USD Million
- TABLE 86 Canada Immersive Display In Entertainment Market by Application, 2024 - 2031, USD Million
- TABLE 87 Mexico Immersive Display In Entertainment Market, 2020 - 2023, USD Million
- TABLE 88 Mexico Immersive Display In Entertainment Market, 2024 - 2031, USD Million
- TABLE 89 Mexico Immersive Display In Entertainment Market by Technology, 2020 - 2023, USD Million
- TABLE 90 Mexico Immersive Display In Entertainment Market by Technology, 2024 - 2031, USD Million
- TABLE 91 Mexico Immersive Display In Entertainment Market by Resolution, 2020 - 2023, USD Million
- TABLE 92 Mexico Immersive Display In Entertainment Market by Resolution, 2024 - 2031, USD Million
- TABLE 93 Mexico Immersive Display In Entertainment Market by Application, 2020 - 2023, USD Million
- TABLE 94 Mexico Immersive Display In Entertainment Market by Application, 2024 - 2031, USD Million
- TABLE 95 Rest of North America Immersive Display In Entertainment Market, 2020 - 2023, USD Million
- TABLE 96 Rest of North America Immersive Display In Entertainment Market, 2024 - 2031, USD Million
- TABLE 97 Rest of North America Immersive Display In Entertainment Market by Technology, 2020 - 2023, USD Million
- TABLE 98 Rest of North America Immersive Display In Entertainment Market by Technology, 2024 - 2031, USD Million
- TABLE 99 Rest of North America Immersive Display In Entertainment Market by Resolution, 2020 - 2023, USD Million
- TABLE 100 Rest of North America Immersive Display In Entertainment Market by Resolution, 2024 - 2031, USD Million
- TABLE 101 Rest of North America Immersive Display In Entertainment Market by Application, 2020 - 2023, USD Million
- TABLE 102 Rest of North America Immersive Display In Entertainment Market by Application, 2024 - 2031, USD Million
- TABLE 103 Europe Immersive Display In Entertainment Market, 2020 - 2023, USD Million
- TABLE 104 Europe Immersive Display In Entertainment Market, 2024 - 2031, USD Million
- TABLE 105 Europe Immersive Display In Entertainment Market by Technology, 2020 - 2023, USD Million
- TABLE 106 Europe Immersive Display In Entertainment Market by Technology, 2024 - 2031, USD Million
- TABLE 107 Europe LED Market by Country, 2020 - 2023, USD Million
- TABLE 108 Europe LED Market by Country, 2024 - 2031, USD Million
- TABLE 109 Europe OLED Market by Country, 2020 - 2023, USD Million
- TABLE 110 Europe OLED Market by Country, 2024 - 2031, USD Million
- TABLE 111 Europe Other Technology Market by Country, 2020 - 2023, USD Million
- TABLE 112 Europe Other Technology Market by Country, 2024 - 2031, USD Million
- TABLE 113 Europe Immersive Display In Entertainment Market by Resolution, 2020 - 2023, USD Million
- TABLE 114 Europe Immersive Display In Entertainment Market by Resolution, 2024 - 2031, USD Million
- TABLE 115 Europe 4K Market by Country, 2020 - 2023, USD Million
- TABLE 116 Europe 4K Market by Country, 2024 - 2031, USD Million
- TABLE 117 Europe 8K Market by Country, 2020 - 2023, USD Million
- TABLE 118 Europe 8K Market by Country, 2024 - 2031, USD Million
- TABLE 119 Europe Other Resolution Market by Country, 2020 - 2023, USD Million
- TABLE 120 Europe Other Resolution Market by Country, 2024 - 2031, USD Million
- TABLE 121 Europe Immersive Display In Entertainment Market by Application, 2020 - 2023, USD Million
- TABLE 122 Europe Immersive Display In Entertainment Market by Application, 2024 - 2031, USD Million
- TABLE 123 Europe Theater & Cinema Market by Country, 2020 - 2023, USD Million
- TABLE 124 Europe Theater & Cinema Market by Country, 2024 - 2031, USD Million
- TABLE 125 Europe Entertainment Venues Market by Country, 2020 - 2023, USD Million
- TABLE 126 Europe Entertainment Venues Market by Country, 2024 - 2031, USD Million
- TABLE 127 Europe Theme Parks & Amusement Parks Market by Country, 2020 - 2023, USD Million
- TABLE 128 Europe Theme Parks & Amusement Parks Market by Country, 2024 - 2031, USD Million
- TABLE 129 Europe Museum & Exhibitions Market by Country, 2020 - 2023, USD Million
- TABLE 130 Europe Museum & Exhibitions Market by Country, 2024 - 2031, USD Million
- TABLE 131 Europe Content Creation Studios Market by Country, 2020 - 2023, USD Million
- TABLE 132 Europe Content Creation Studios Market by Country, 2024 - 2031, USD Million
- TABLE 133 Europe Other Application Market by Country, 2020 - 2023, USD Million
- TABLE 134 Europe Other Application Market by Country, 2024 - 2031, USD Million
- TABLE 135 Europe Immersive Display In Entertainment Market by Country, 2020 - 2023, USD Million
- TABLE 136 Europe Immersive Display In Entertainment Market by Country, 2024 - 2031, USD Million
- TABLE 137 Germany Immersive Display In Entertainment Market, 2020 - 2023, USD Million
- TABLE 138 Germany Immersive Display In Entertainment Market, 2024 - 2031, USD Million
- TABLE 139 Germany Immersive Display In Entertainment Market by Technology, 2020 - 2023, USD Million
- TABLE 140 Germany Immersive Display In Entertainment Market by Technology, 2024 - 2031, USD Million
- TABLE 141 Germany Immersive Display In Entertainment Market by Resolution, 2020 - 2023, USD Million
- TABLE 142 Germany Immersive Display In Entertainment Market by Resolution, 2024 - 2031, USD Million
- TABLE 143 Germany Immersive Display In Entertainment Market by Application, 2020 - 2023, USD Million
- TABLE 144 Germany Immersive Display In Entertainment Market by Application, 2024 - 2031, USD Million
- TABLE 145 UK Immersive Display In Entertainment Market, 2020 - 2023, USD Million
- TABLE 146 UK Immersive Display In Entertainment Market, 2024 - 2031, USD Million
- TABLE 147 UK Immersive Display In Entertainment Market by Technology, 2020 - 2023, USD Million
- TABLE 148 UK Immersive Display In Entertainment Market by Technology, 2024 - 2031, USD Million
- TABLE 149 UK Immersive Display In Entertainment Market by Resolution, 2020 - 2023, USD Million
- TABLE 150 UK Immersive Display In Entertainment Market by Resolution, 2024 - 2031, USD Million
- TABLE 151 UK Immersive Display In Entertainment Market by Application, 2020 - 2023, USD Million
- TABLE 152 UK Immersive Display In Entertainment Market by Application, 2024 - 2031, USD Million
- TABLE 153 France Immersive Display In Entertainment Market, 2020 - 2023, USD Million
- TABLE 154 France Immersive Display In Entertainment Market, 2024 - 2031, USD Million
- TABLE 155 France Immersive Display In Entertainment Market by Technology, 2020 - 2023, USD Million
- TABLE 156 France Immersive Display In Entertainment Market by Technology, 2024 - 2031, USD Million
- TABLE 157 France Immersive Display In Entertainment Market by Resolution, 2020 - 2023, USD Million
- TABLE 158 France Immersive Display In Entertainment Market by Resolution, 2024 - 2031, USD Million
- TABLE 159 France Immersive Display In Entertainment Market by Application, 2020 - 2023, USD Million
- TABLE 160 France Immersive Display In Entertainment Market by Application, 2024 - 2031, USD Million
- TABLE 161 Russia Immersive Display In Entertainment Market, 2020 - 2023, USD Million
- TABLE 162 Russia Immersive Display In Entertainment Market, 2024 - 2031, USD Million
- TABLE 163 Russia Immersive Display In Entertainment Market by Technology, 2020 - 2023, USD Million
- TABLE 164 Russia Immersive Display In Entertainment Market by Technology, 2024 - 2031, USD Million
- TABLE 165 Russia Immersive Display In Entertainment Market by Resolution, 2020 - 2023, USD Million
- TABLE 166 Russia Immersive Display In Entertainment Market by Resolution, 2024 - 2031, USD Million
- TABLE 167 Russia Immersive Display In Entertainment Market by Application, 2020 - 2023, USD Million
- TABLE 168 Russia Immersive Display In Entertainment Market by Application, 2024 - 2031, USD Million
- TABLE 169 Spain Immersive Display In Entertainment Market, 2020 - 2023, USD Million
- TABLE 170 Spain Immersive Display In Entertainment Market, 2024 - 2031, USD Million
- TABLE 171 Spain Immersive Display In Entertainment Market by Technology, 2020 - 2023, USD Million
- TABLE 172 Spain Immersive Display In Entertainment Market by Technology, 2024 - 2031, USD Million
- TABLE 173 Spain Immersive Display In Entertainment Market by Resolution, 2020 - 2023, USD Million
- TABLE 174 Spain Immersive Display In Entertainment Market by Resolution, 2024 - 2031, USD Million
- TABLE 175 Spain Immersive Display In Entertainment Market by Application, 2020 - 2023, USD Million
- TABLE 176 Spain Immersive Display In Entertainment Market by Application, 2024 - 2031, USD Million
- TABLE 177 Italy Immersive Display In Entertainment Market, 2020 - 2023, USD Million
- TABLE 178 Italy Immersive Display In Entertainment Market, 2024 - 2031, USD Million
- TABLE 179 Italy Immersive Display In Entertainment Market by Technology, 2020 - 2023, USD Million
- TABLE 180 Italy Immersive Display In Entertainment Market by Technology, 2024 - 2031, USD Million
- TABLE 181 Italy Immersive Display In Entertainment Market by Resolution, 2020 - 2023, USD Million
- TABLE 182 Italy Immersive Display In Entertainment Market by Resolution, 2024 - 2031, USD Million
- TABLE 183 Italy Immersive Display In Entertainment Market by Application, 2020 - 2023, USD Million
- TABLE 184 Italy Immersive Display In Entertainment Market by Application, 2024 - 2031, USD Million
- TABLE 185 Rest of Europe Immersive Display In Entertainment Market, 2020 - 2023, USD Million
- TABLE 186 Rest of Europe Immersive Display In Entertainment Market, 2024 - 2031, USD Million
- TABLE 187 Rest of Europe Immersive Display In Entertainment Market by Technology, 2020 - 2023, USD Million
- TABLE 188 Rest of Europe Immersive Display In Entertainment Market by Technology, 2024 - 2031, USD Million
- TABLE 189 Rest of Europe Immersive Display In Entertainment Market by Resolution, 2020 - 2023, USD Million
- TABLE 190 Rest of Europe Immersive Display In Entertainment Market by Resolution, 2024 - 2031, USD Million
- TABLE 191 Rest of Europe Immersive Display In Entertainment Market by Application, 2020 - 2023, USD Million
- TABLE 192 Rest of Europe Immersive Display In Entertainment Market by Application, 2024 - 2031, USD Million
- TABLE 193 Asia Pacific Immersive Display In Entertainment Market, 2020 - 2023, USD Million
- TABLE 194 Asia Pacific Immersive Display In Entertainment Market, 2024 - 2031, USD Million
- TABLE 195 Asia Pacific Immersive Display In Entertainment Market by Technology, 2020 - 2023, USD Million
- TABLE 196 Asia Pacific Immersive Display In Entertainment Market by Technology, 2024 - 2031, USD Million
- TABLE 197 Asia Pacific LED Market by Country, 2020 - 2023, USD Million
- TABLE 198 Asia Pacific LED Market by Country, 2024 - 2031, USD Million
- TABLE 199 Asia Pacific OLED Market by Country, 2020 - 2023, USD Million
- TABLE 200 Asia Pacific OLED Market by Country, 2024 - 2031, USD Million
- TABLE 201 Asia Pacific Other Technology Market by Country, 2020 - 2023, USD Million
- TABLE 202 Asia Pacific Other Technology Market by Country, 2024 - 2031, USD Million
- TABLE 203 Asia Pacific Immersive Display In Entertainment Market by Resolution, 2020 - 2023, USD Million
- TABLE 204 Asia Pacific Immersive Display In Entertainment Market by Resolution, 2024 - 2031, USD Million
- TABLE 205 Asia Pacific 4K Market by Country, 2020 - 2023, USD Million
- TABLE 206 Asia Pacific 4K Market by Country, 2024 - 2031, USD Million
- TABLE 207 Asia Pacific 8K Market by Country, 2020 - 2023, USD Million
- TABLE 208 Asia Pacific 8K Market by Country, 2024 - 2031, USD Million
- TABLE 209 Asia Pacific Other Resolution Market by Country, 2020 - 2023, USD Million
- TABLE 210 Asia Pacific Other Resolution Market by Country, 2024 - 2031, USD Million
- TABLE 211 Asia Pacific Immersive Display In Entertainment Market by Application, 2020 - 2023, USD Million
- TABLE 212 Asia Pacific Immersive Display In Entertainment Market by Application, 2024 - 2031, USD Million
- TABLE 213 Asia Pacific Theater & Cinema Market by Country, 2020 - 2023, USD Million
- TABLE 214 Asia Pacific Theater & Cinema Market by Country, 2024 - 2031, USD Million
- TABLE 215 Asia Pacific Entertainment Venues Market by Country, 2020 - 2023, USD Million
- TABLE 216 Asia Pacific Entertainment Venues Market by Country, 2024 - 2031, USD Million
- TABLE 217 Asia Pacific Theme Parks & Amusement Parks Market by Country, 2020 - 2023, USD Million
- TABLE 218 Asia Pacific Theme Parks & Amusement Parks Market by Country, 2024 - 2031, USD Million
- TABLE 219 Asia Pacific Museum & Exhibitions Market by Country, 2020 - 2023, USD Million
- TABLE 220 Asia Pacific Museum & Exhibitions Market by Country, 2024 - 2031, USD Million
- TABLE 221 Asia Pacific Content Creation Studios Market by Country, 2020 - 2023, USD Million
- TABLE 222 Asia Pacific Content Creation Studios Market by Country, 2024 - 2031, USD Million
- TABLE 223 Asia Pacific Other Application Market by Country, 2020 - 2023, USD Million
- TABLE 224 Asia Pacific Other Application Market by Country, 2024 - 2031, USD Million
- TABLE 225 Asia Pacific Immersive Display In Entertainment Market by Country, 2020 - 2023, USD Million
- TABLE 226 Asia Pacific Immersive Display In Entertainment Market by Country, 2024 - 2031, USD Million
- TABLE 227 China Immersive Display In Entertainment Market, 2020 - 2023, USD Million
- TABLE 228 China Immersive Display In Entertainment Market, 2024 - 2031, USD Million
- TABLE 229 China Immersive Display In Entertainment Market by Technology, 2020 - 2023, USD Million
- TABLE 230 China Immersive Display In Entertainment Market by Technology, 2024 - 2031, USD Million
- TABLE 231 China Immersive Display In Entertainment Market by Resolution, 2020 - 2023, USD Million
- TABLE 232 China Immersive Display In Entertainment Market by Resolution, 2024 - 2031, USD Million
- TABLE 233 China Immersive Display In Entertainment Market by Application, 2020 - 2023, USD Million
- TABLE 234 China Immersive Display In Entertainment Market by Application, 2024 - 2031, USD Million
- TABLE 235 Japan Immersive Display In Entertainment Market, 2020 - 2023, USD Million
- TABLE 236 Japan Immersive Display In Entertainment Market, 2024 - 2031, USD Million
- TABLE 237 Japan Immersive Display In Entertainment Market by Technology, 2020 - 2023, USD Million
- TABLE 238 Japan Immersive Display In Entertainment Market by Technology, 2024 - 2031, USD Million
- TABLE 239 Japan Immersive Display In Entertainment Market by Resolution, 2020 - 2023, USD Million
- TABLE 240 Japan Immersive Display In Entertainment Market by Resolution, 2024 - 2031, USD Million
- TABLE 241 Japan Immersive Display In Entertainment Market by Application, 2020 - 2023, USD Million
- TABLE 242 Japan Immersive Display In Entertainment Market by Application, 2024 - 2031, USD Million
- TABLE 243 India Immersive Display In Entertainment Market, 2020 - 2023, USD Million
- TABLE 244 India Immersive Display In Entertainment Market, 2024 - 2031, USD Million
- TABLE 245 India Immersive Display In Entertainment Market by Technology, 2020 - 2023, USD Million
- TABLE 246 India Immersive Display In Entertainment Market by Technology, 2024 - 2031, USD Million
- TABLE 247 India Immersive Display In Entertainment Market by Resolution, 2020 - 2023, USD Million
- TABLE 248 India Immersive Display In Entertainment Market by Resolution, 2024 - 2031, USD Million
- TABLE 249 India Immersive Display In Entertainment Market by Application, 2020 - 2023, USD Million
- TABLE 250 India Immersive Display In Entertainment Market by Application, 2024 - 2031, USD Million
- TABLE 251 South Korea Immersive Display In Entertainment Market, 2020 - 2023, USD Million
- TABLE 252 South Korea Immersive Display In Entertainment Market, 2024 - 2031, USD Million
- TABLE 253 South Korea Immersive Display In Entertainment Market by Technology, 2020 - 2023, USD Million
- TABLE 254 South Korea Immersive Display In Entertainment Market by Technology, 2024 - 2031, USD Million
- TABLE 255 South Korea Immersive Display In Entertainment Market by Resolution, 2020 - 2023, USD Million
- TABLE 256 South Korea Immersive Display In Entertainment Market by Resolution, 2024 - 2031, USD Million
- TABLE 257 South Korea Immersive Display In Entertainment Market by Application, 2020 - 2023, USD Million
- TABLE 258 South Korea Immersive Display In Entertainment Market by Application, 2024 - 2031, USD Million
- TABLE 259 Singapore Immersive Display In Entertainment Market, 2020 - 2023, USD Million
- TABLE 260 Singapore Immersive Display In Entertainment Market, 2024 - 2031, USD Million
- TABLE 261 Singapore Immersive Display In Entertainment Market by Technology, 2020 - 2023, USD Million
- TABLE 262 Singapore Immersive Display In Entertainment Market by Technology, 2024 - 2031, USD Million
- TABLE 263 Singapore Immersive Display In Entertainment Market by Resolution, 2020 - 2023, USD Million
- TABLE 264 Singapore Immersive Display In Entertainment Market by Resolution, 2024 - 2031, USD Million
- TABLE 265 Singapore Immersive Display In Entertainment Market by Application, 2020 - 2023, USD Million
- TABLE 266 Singapore Immersive Display In Entertainment Market by Application, 2024 - 2031, USD Million
- TABLE 267 Malaysia Immersive Display In Entertainment Market, 2020 - 2023, USD Million
- TABLE 268 Malaysia Immersive Display In Entertainment Market, 2024 - 2031, USD Million
- TABLE 269 Malaysia Immersive Display In Entertainment Market by Technology, 2020 - 2023, USD Million
- TABLE 270 Malaysia Immersive Display In Entertainment Market by Technology, 2024 - 2031, USD Million
- TABLE 271 Malaysia Immersive Display In Entertainment Market by Resolution, 2020 - 2023, USD Million
- TABLE 272 Malaysia Immersive Display In Entertainment Market by Resolution, 2024 - 2031, USD Million
- TABLE 273 Malaysia Immersive Display In Entertainment Market by Application, 2020 - 2023, USD Million
- TABLE 274 Malaysia Immersive Display In Entertainment Market by Application, 2024 - 2031, USD Million
- TABLE 275 Rest of Asia Pacific Immersive Display In Entertainment Market, 2020 - 2023, USD Million
- TABLE 276 Rest of Asia Pacific Immersive Display In Entertainment Market, 2024 - 2031, USD Million
- TABLE 277 Rest of Asia Pacific Immersive Display In Entertainment Market by Technology, 2020 - 2023, USD Million
- TABLE 278 Rest of Asia Pacific Immersive Display In Entertainment Market by Technology, 2024 - 2031, USD Million
- TABLE 279 Rest of Asia Pacific Immersive Display In Entertainment Market by Resolution, 2020 - 2023, USD Million
- TABLE 280 Rest of Asia Pacific Immersive Display In Entertainment Market by Resolution, 2024 - 2031, USD Million
- TABLE 281 Rest of Asia Pacific Immersive Display In Entertainment Market by Application, 2020 - 2023, USD Million
- TABLE 282 Rest of Asia Pacific Immersive Display In Entertainment Market by Application, 2024 - 2031, USD Million
- TABLE 283 LAMEA Immersive Display In Entertainment Market, 2020 - 2023, USD Million
- TABLE 284 LAMEA Immersive Display In Entertainment Market, 2024 - 2031, USD Million
- TABLE 285 LAMEA Immersive Display In Entertainment Market by Technology, 2020 - 2023, USD Million
- TABLE 286 LAMEA Immersive Display In Entertainment Market by Technology, 2024 - 2031, USD Million
- TABLE 287 LAMEA LED Market by Country, 2020 - 2023, USD Million
- TABLE 288 LAMEA LED Market by Country, 2024 - 2031, USD Million
- TABLE 289 LAMEA OLED Market by Country, 2020 - 2023, USD Million
- TABLE 290 LAMEA OLED Market by Country, 2024 - 2031, USD Million
- TABLE 291 LAMEA Other Technology Market by Country, 2020 - 2023, USD Million
- TABLE 292 LAMEA Other Technology Market by Country, 2024 - 2031, USD Million
- TABLE 293 LAMEA Immersive Display In Entertainment Market by Resolution, 2020 - 2023, USD Million
- TABLE 294 LAMEA Immersive Display In Entertainment Market by Resolution, 2024 - 2031, USD Million
- TABLE 295 LAMEA 4K Market by Country, 2020 - 2023, USD Million
- TABLE 296 LAMEA 4K Market by Country, 2024 - 2031, USD Million
- TABLE 297 LAMEA 8K Market by Country, 2020 - 2023, USD Million
- TABLE 298 LAMEA 8K Market by Country, 2024 - 2031, USD Million
- TABLE 299 LAMEA Other Resolution Market by Country, 2020 - 2023, USD Million
- TABLE 300 LAMEA Other Resolution Market by Country, 2024 - 2031, USD Million
- TABLE 301 LAMEA Immersive Display In Entertainment Market by Application, 2020 - 2023, USD Million
- TABLE 302 LAMEA Immersive Display In Entertainment Market by Application, 2024 - 2031, USD Million
- TABLE 303 LAMEA Theater & Cinema Market by Country, 2020 - 2023, USD Million
- TABLE 304 LAMEA Theater & Cinema Market by Country, 2024 - 2031, USD Million
- TABLE 305 LAMEA Entertainment Venues Market by Country, 2020 - 2023, USD Million
- TABLE 306 LAMEA Entertainment Venues Market by Country, 2024 - 2031, USD Million
- TABLE 307 LAMEA Theme Parks & Amusement Parks Market by Country, 2020 - 2023, USD Million
- TABLE 308 LAMEA Theme Parks & Amusement Parks Market by Country, 2024 - 2031, USD Million
- TABLE 309 LAMEA Museum & Exhibitions Market by Country, 2020 - 2023, USD Million
- TABLE 310 LAMEA Museum & Exhibitions Market by Country, 2024 - 2031, USD Million
- TABLE 311 LAMEA Content Creation Studios Market by Country, 2020 - 2023, USD Million
- TABLE 312 LAMEA Content Creation Studios Market by Country, 2024 - 2031, USD Million
- TABLE 313 LAMEA Other Application Market by Country, 2020 - 2023, USD Million
- TABLE 314 LAMEA Other Application Market by Country, 2024 - 2031, USD Million
- TABLE 315 LAMEA Immersive Display In Entertainment Market by Country, 2020 - 2023, USD Million
- TABLE 316 LAMEA Immersive Display In Entertainment Market by Country, 2024 - 2031, USD Million
- TABLE 317 Brazil Immersive Display In Entertainment Market, 2020 - 2023, USD Million
- TABLE 318 Brazil Immersive Display In Entertainment Market, 2024 - 2031, USD Million
- TABLE 319 Brazil Immersive Display In Entertainment Market by Technology, 2020 - 2023, USD Million
- TABLE 320 Brazil Immersive Display In Entertainment Market by Technology, 2024 - 2031, USD Million
- TABLE 321 Brazil Immersive Display In Entertainment Market by Resolution, 2020 - 2023, USD Million
- TABLE 322 Brazil Immersive Display In Entertainment Market by Resolution, 2024 - 2031, USD Million
- TABLE 323 Brazil Immersive Display In Entertainment Market by Application, 2020 - 2023, USD Million
- TABLE 324 Brazil Immersive Display In Entertainment Market by Application, 2024 - 2031, USD Million
- TABLE 325 Argentina Immersive Display In Entertainment Market, 2020 - 2023, USD Million
- TABLE 326 Argentina Immersive Display In Entertainment Market, 2024 - 2031, USD Million
- TABLE 327 Argentina Immersive Display In Entertainment Market by Technology, 2020 - 2023, USD Million
- TABLE 328 Argentina Immersive Display In Entertainment Market by Technology, 2024 - 2031, USD Million
- TABLE 329 Argentina Immersive Display In Entertainment Market by Resolution, 2020 - 2023, USD Million
- TABLE 330 Argentina Immersive Display In Entertainment Market by Resolution, 2024 - 2031, USD Million
- TABLE 331 Argentina Immersive Display In Entertainment Market by Application, 2020 - 2023, USD Million
- TABLE 332 Argentina Immersive Display In Entertainment Market by Application, 2024 - 2031, USD Million
- TABLE 333 UAE Immersive Display In Entertainment Market, 2020 - 2023, USD Million
- TABLE 334 UAE Immersive Display In Entertainment Market, 2024 - 2031, USD Million
- TABLE 335 UAE Immersive Display In Entertainment Market by Technology, 2020 - 2023, USD Million
- TABLE 336 UAE Immersive Display In Entertainment Market by Technology, 2024 - 2031, USD Million
- TABLE 337 UAE Immersive Display In Entertainment Market by Resolution, 2020 - 2023, USD Million
- TABLE 338 UAE Immersive Display In Entertainment Market by Resolution, 2024 - 2031, USD Million
- TABLE 339 UAE Immersive Display In Entertainment Market by Application, 2020 - 2023, USD Million
- TABLE 340 UAE Immersive Display In Entertainment Market by Application, 2024 - 2031, USD Million
- TABLE 341 Saudi Arabia Immersive Display In Entertainment Market, 2020 - 2023, USD Million
- TABLE 342 Saudi Arabia Immersive Display In Entertainment Market, 2024 - 2031, USD Million
- TABLE 343 Saudi Arabia Immersive Display In Entertainment Market by Technology, 2020 - 2023, USD Million
- TABLE 344 Saudi Arabia Immersive Display In Entertainment Market by Technology, 2024 - 2031, USD Million
- TABLE 345 Saudi Arabia Immersive Display In Entertainment Market by Resolution, 2020 - 2023, USD Million
- TABLE 346 Saudi Arabia Immersive Display In Entertainment Market by Resolution, 2024 - 2031, USD Million
- TABLE 347 Saudi Arabia Immersive Display In Entertainment Market by Application, 2020 - 2023, USD Million
- TABLE 348 Saudi Arabia Immersive Display In Entertainment Market by Application, 2024 - 2031, USD Million
- TABLE 349 South Africa Immersive Display In Entertainment Market, 2020 - 2023, USD Million
- TABLE 350 South Africa Immersive Display In Entertainment Market, 2024 - 2031, USD Million
- TABLE 351 South Africa Immersive Display In Entertainment Market by Technology, 2020 - 2023, USD Million
- TABLE 352 South Africa Immersive Display In Entertainment Market by Technology, 2024 - 2031, USD Million
- TABLE 353 South Africa Immersive Display In Entertainment Market by Resolution, 2020 - 2023, USD Million
- TABLE 354 South Africa Immersive Display In Entertainment Market by Resolution, 2024 - 2031, USD Million
- TABLE 355 South Africa Immersive Display In Entertainment Market by Application, 2020 - 2023, USD Million
- TABLE 356 South Africa Immersive Display In Entertainment Market by Application, 2024 - 2031, USD Million
- TABLE 357 Nigeria Immersive Display In Entertainment Market, 2020 - 2023, USD Million
- TABLE 358 Nigeria Immersive Display In Entertainment Market, 2024 - 2031, USD Million
- TABLE 359 Nigeria Immersive Display In Entertainment Market by Technology, 2020 - 2023, USD Million
- TABLE 360 Nigeria Immersive Display In Entertainment Market by Technology, 2024 - 2031, USD Million
- TABLE 361 Nigeria Immersive Display In Entertainment Market by Resolution, 2020 - 2023, USD Million
- TABLE 362 Nigeria Immersive Display In Entertainment Market by Resolution, 2024 - 2031, USD Million
- TABLE 363 Nigeria Immersive Display In Entertainment Market by Application, 2020 - 2023, USD Million
- TABLE 364 Nigeria Immersive Display In Entertainment Market by Application, 2024 - 2031, USD Million
- TABLE 365 Rest of LAMEA Immersive Display In Entertainment Market, 2020 - 2023, USD Million
- TABLE 366 Rest of LAMEA Immersive Display In Entertainment Market, 2024 - 2031, USD Million
- TABLE 367 Rest of LAMEA Immersive Display In Entertainment Market by Technology, 2020 - 2023, USD Million
- TABLE 368 Rest of LAMEA Immersive Display In Entertainment Market by Technology, 2024 - 2031, USD Million
- TABLE 369 Rest of LAMEA Immersive Display In Entertainment Market by Resolution, 2020 - 2023, USD Million
- TABLE 370 Rest of LAMEA Immersive Display In Entertainment Market by Resolution, 2024 - 2031, USD Million
- TABLE 371 Rest of LAMEA Immersive Display In Entertainment Market by Application, 2020 - 2023, USD Million
- TABLE 372 Rest of LAMEA Immersive Display In Entertainment Market by Application, 2024 - 2031, USD Million
- TABLE 373 Key Information - Barco NV
- TABLE 374 Key Information - Leyard Optoelectronic Co Ltd.
- TABLE 375 Key Information - LG Electronics, Inc.
- TABLE 376 Key Information - Panasonic Holdings Corporation
- TABLE 377 Key Information - Samsung Electronics Co., Ltd.
- TABLE 378 Key Information - Sharp Corporation
- TABLE 379 Key Information - Sony Corporation
- TABLE 380 Key Information - HTC Corporation
- TABLE 381 Key Information - Meta Platforms, Inc.
- TABLE 382 Key Information - Microsoft Corporation
LIST OF FIGURES
- FIG 1 Methodology for the research
- FIG 2 Global Immersive Display In Entertainment Market, 2020 - 2031, USD Million
- FIG 3 Key Factors Impacting Immersive Display In Entertainment Market
- FIG 4 KBV Cardinal Matrix
- FIG 5 Market Share Analysis, 2023
- FIG 6 Key Leading Strategies: Percentage Distribution (2020-2024)
- FIG 7 Key Strategic Move: (Partnerships, Collaborations & Agreements : 2021, Mar - 2024, Dec) Leading Players
- FIG 8 Porter's Five Forces Analysis - Immersive Display In Entertainment Market
- FIG 9 Global Immersive Display In Entertainment Market share by Technology, 2023
- FIG 10 Global Immersive Display In Entertainment Market share by Technology, 2031
- FIG 11 Global Immersive Display In Entertainment Market by Technology, 2020 - 2031, USD Million
- FIG 12 Global Immersive Display In Entertainment Market share by Resolution, 2023
- FIG 13 Global Immersive Display In Entertainment Market share by Resolution, 2031
- FIG 14 Global Immersive Display In Entertainment Market by Resolution, 2020 - 2031, USD Million
- FIG 15 Global Immersive Display In Entertainment Market share by Application, 2023
- FIG 16 Global Immersive Display In Entertainment Market share by Application, 2031
- FIG 17 Global Immersive Display In Entertainment Market by Application, 2020 - 2031, USD Million
- FIG 18 Global Immersive Display In Entertainment Market share by Region, 2023
- FIG 19 Global Immersive Display In Entertainment Market share by Region, 2031
- FIG 20 Global Immersive Display In Entertainment Market by Region, 2020 - 2031, USD Million
- FIG 21 Recent strategies and developments: Barco NV
- FIG 22 SWOT Analysis: Barco NV
- FIG 23 Recent strategies and developments: Leyard Optoelectronic Co Ltd.
- FIG 24 SWOT Analysis: Leyard Optoelectronic Co Ltd.
- FIG 25 SWOT Analysis: LG Electronics, Inc.
- FIG 26 SWOT Analysis: Panasonic Holdings Corporation
- FIG 27 SWOT Analysis: Samsung Electronics Co., Ltd.
- FIG 28 SWOT Analysis: Sharp Corporation
- FIG 29 SWOT Analysis: Sony Corporation
- FIG 30 SWOT Analysis: HTC Corporation
- FIG 31 SWOT Analysis: Meta Platforms, Inc.
- FIG 32 SWOT Analysis: Microsoft Corporation
The Global Immersive Display In Entertainment Market size is expected to reach $13.21 billion by 2031, rising at a market growth of 23.1% CAGR during the forecast period.
Parks invest in VR rides, AR experiences, interactive 3D displays, and projection mapping to offer visitors unique adventures that combine physical and virtual elements. These technologies allow for highly customizable and story-driven experiences, enhancing visitor engagement and satisfaction. Thus, the theme parks and amusement parks segment procured 17% revenue share in the market in 2023. As consumer expectations shift towards more technology-driven and immersive attractions, theme parks continue to innovate and integrate immersive displays to stay competitive and attract larger audiences, driving growth in this segment.
The major strategies followed by the market participants are Partnerships as the key developmental strategy to keep pace with the changing demands of end users. For instance, In December, 2024, Samsung Electronics Co., Ltd. teamed up with Dolby Laboratories, a Software company to enhance automotive displays. This collaboration will integrate Samsung's OLED technology with Dolby Vision, providing superior image quality in vehicles. This aims to streamline the implementation and evaluation process, offering an immersive entertainment experience for car manufacturers and consumers. Additionally, In June, 2024, Barco NV teamed up with WESCO, a Maintenance, repair, and operations company to expand its presence in the US market, distributing innovative display solutions like TruePix LED video walls, Infinipix Gen2 image processors, and Barco UniSee II LCD video walls. This collaboration enhances Barco's ability to bring its advanced products to a broader audience.
Based on the Analysis presented in the KBV Cardinal matrix; Microsoft Corporation and Meta Platforms, Inc. are the forerunners in the Immersive Display In Entertainment Market. Companies such as Samsung Electronics Co., Ltd., Sony Corporation and Panasonic Holdings Corporation are some of the key innovators in Immersive Display In Entertainment Market. In December, 2024, Meta Platforms, Inc. announced the partnership with LG, a Multinational conglomerate company to create a next-gen mixed-reality headset, blending augmented and virtual reality for a seamless experience. Combining Meta's VR content and LG's advanced display technology, the headset aims to rival Apple's Vision Pro, offering immersive entertainment, smart home integration, and more.
Market Growth Factors
The adoption of high-resolution displays such as 4K, 8K, OLED, and Micro-LED has greatly enhanced image clarity, depth, and vibrancy. 4K and 8K displays offer ultra-high-definition visuals with exceptional detail, enriching experiences in gaming, cinema, and home theaters. With its self-emissive pixels, OLED technology delivers perfect blacks and vibrant colors, resulting in richer contrast and more lifelike images. Hence, these advancements in display technologies are significantly enhancing the quality and depth of immersive entertainment experiences.
Additionally, the quick rollout of 5G networks and the expanding availability of high-speed internet have significantly expedited the growth and adoption of immersive technologies, especially in the areas of augmented reality (AR) and virtual reality (VR). Therefore, as 5G networks expand globally and high-speed internet becomes more ubiquitous, the accessibility and adoption of immersive displays will continue to rise.
Market Restraining Factors
Developing immersive experiences using technologies like Virtual Reality (VR) and Augmented Reality (AR) demands substantial financial investment in hardware and software. High-quality VR headsets, AR glasses, motion sensors, and haptic feedback devices are often expensive, increasing the overall development costs. Therefore, the market's expansion in the entertainment sector is significantly hindered by the exorbitant development and implementation expenses.
Technology Outlook
Based on technology, the market is classified into LED, OLED, and others. The LED segment garnered 47% revenue share in the market in 2023. LED displays offer high brightness levels, vibrant colors, and long-lasting performance, making them ideal for various entertainment applications such as large-scale screens, gaming displays, and virtual reality setups. The relatively lower production and maintenance costs of LED technology have made it accessible to both consumers and businesses, encouraging widespread adoption.
Resolution Outlook
On the basis of resolution, the market is divided into 4K, 8K, and others. The 8K segment recorded 22% revenue share in the market in 2023. The pursuit of cutting-edge visual fidelity and an ultra-immersive experience drives the 8K segment. Offering a four times higher resolution than 4K, 8K displays provide incredibly detailed and lifelike visuals, making them ideal for premium applications such as high-end gaming, VR simulations, and large-format displays in entertainment venues.
Application Outlook
By application, the market is segmented into theater & cinema, entertainment venues, museum & exhibitions, content creation studios, theme parks & amusement parks, and others. The theater & cinema segment witnessed 26% revenue share in the market in 2023. Cinemas increasingly incorporate advanced display technologies such as large-format screens, 3D projections, IMAX, and 4DX to attract audiences seeking unique entertainment experiences. These immersive formats combine high-definition visuals, surround sound, and environmental effects like seat movement and scents, elevating the overall movie-going experience.
Regional Outlook
Region-wise, the market is analyzed across North America, Europe, Asia Pacific, and LAMEA. The Europe segment recorded 29% revenue share in the market in 2023. Countries like the UK, Germany, and France have significantly adopted immersive displays in theaters, museums, exhibitions, and theme parks. Europe's rich cultural heritage has driven the integration of immersive technologies in museums and exhibitions, enhancing visitor engagement through interactive AR and VR experiences.
Market Competition and Attributes
The Immersive Display in Entertainment market is fiercely competitive, driven by rapid technological advancements and increasing consumer demand for immersive experiences. Companies vie for market share through innovations in display technologies, content creation, and user interface design. Key strategies include enhancing resolution, expanding field of view, and improving sensory immersion to captivate audiences. Market players also focus on enhancing user interaction and reducing latency, aiming to deliver seamless and captivating entertainment experiences across various platforms and venues globally.
Recent Strategies Deployed in the Market
- Jan-2025: LG Electronics, Inc. unveiled two innovative lifestyle projectors. The PF600U combines a projector, Bluetooth speaker, and LED mood lamp, while the CineBeam S is LG's smallest 4K Ultra Short Throw projector. Both models offer superior image quality, versatile functionality, and integration with streaming platforms.
- Dec-2024: Samsung Electronics Co., Ltd. teamed up with Dolby Laboratories, a Software company to enhance automotive displays. This collaboration will integrate Samsung's OLED technology with Dolby Vision, providing superior image quality in vehicles. This aims to streamline the implementation and evaluation process, offering an immersive entertainment experience for car manufacturers and consumers.
- Dec-2024: Samsung Electronics Co., Ltd. announced the partnership with Universal Pictures, a Film production company to launch the limited-edition Music Frame WICKED Edition, a customizable wireless speaker offering immersive sound and aesthetic appeal. It features a WICKED-themed photo frame, exclusive autographed cards, and themed packaging. The partnership includes digital ads and in-store displays, enhancing the film's promotion.
- Dec-2024: Samsung Electronics Co., Ltd. announced the partnership with TGL, backed by Tiger Woods and Rory McIlroy, as the Official Screen Provider. Samsung's advanced LED displays will enhance the fan experience at the SoFi Center and for viewers at home, showcasing match stats and sponsor branding, creating an immersive and dynamic golf viewing experience.
- Dec-2024: Meta Platforms, Inc. announced the partnership with LG, a Multinational conglomerate company to create a next-gen mixed-reality headset, blending augmented and virtual reality for a seamless experience. Combining Meta's VR content and LG's advanced display technology, the headset aims to rival Apple's Vision Pro, offering immersive entertainment, smart home integration, and more.
- Nov-2024: Leyard Optoelectronic Co Ltd. unveiled Phase I of its self-developed full-process High-Level MIP (Micro LED packaging technology) line at its Leadstar facility in Wuxi, Jiangsu. This production line aims to drive the LED display industrial chain forward, accelerate cost reduction and efficiency, and promote large-scale application of Micro LED display products.
List of Key Companies Profiled
- Barco NV
- Leyard Optoelectronic Co Ltd.
- LG Electronics, Inc. (LG Corporation)
- Panasonic Holdings Corporation
- Samsung Electronics Co., Ltd. (Samsung Group)
- Sharp Corporation
- Sony Corporation
- HTC Corporation
- Meta Platforms, Inc.
- Microsoft Corporation
Global Immersive Display In Entertainment Market Report Segmentation
By Technology
- LED
- OLED
- Other Technology
By Resolution
- 4K
- 8K
- Other Resolution
By Application
- Theater & Cinema
- Entertainment Venues
- Theme Parks & Amusement Parks
- Museum & Exhibitions
- Content Creation Studios
- Other Application
By Geography
- North America
- US
- Canada
- Mexico
- Rest of North America
- Europe
- Germany
- UK
- France
- Russia
- Spain
- Italy
- Rest of Europe
- Asia Pacific
- China
- Japan
- India
- South Korea
- Singapore
- Malaysia
- Rest of Asia Pacific
- LAMEA
- Brazil
- Argentina
- UAE
- Saudi Arabia
- South Africa
- Nigeria
- Rest of LAMEA
Table of Contents
Chapter 1. Market Scope & Methodology
- 1.1 Market Definition
- 1.2 Objectives
- 1.3 Market Scope
- 1.4 Segmentation
- 1.4.1 Global Immersive Display In Entertainment Market, by Technology
- 1.4.2 Global Immersive Display In Entertainment Market, by Resolution
- 1.4.3 Global Immersive Display In Entertainment Market, by Application
- 1.4.4 Global Immersive Display In Entertainment Market, by Geography
- 1.5 Methodology for the research
Chapter 2. Market at a Glance
- 2.1 Key Highlights
Chapter 3. Market Overview
- 3.1 Introduction
- 3.1.1 Overview
- 3.1.1.1 Market Composition and Scenario
- 3.1.1 Overview
- 3.2 Key Factors Impacting the Market
- 3.2.1 Market Drivers
- 3.2.2 Market Restraints
- 3.2.3 Market Opportunities
- 3.2.4 Market Challenges
Chapter 4. Competition Analysis - Global
- 4.1 KBV Cardinal Matrix
- 4.2 Recent Industry Wide Strategic Developments
- 4.2.1 Partnerships, Collaborations and Agreements
- 4.2.2 Product Launches and Product Expansions
- 4.3 Market Share Analysis, 2023
- 4.4 Top Winning Strategies
- 4.4.1 Key Leading Strategies: Percentage Distribution (2020-2024)
- 4.4.2 Key Strategic Move: (Partnerships, Collaborations & Agreements : 2021, Mar - 2024, Dec) Leading Players
- 4.5 Porter Five Forces Analysis
Chapter 5. Global Immersive Display In Entertainment Market by Technology
- 5.1 Global LED Market by Region
- 5.2 Global OLED Market by Region
- 5.3 Global Other Technology Market by Region
Chapter 6. Global Immersive Display In Entertainment Market by Resolution
- 6.1 Global 4K Market by Region
- 6.2 Global 8K Market by Region
- 6.3 Global Other Resolution Market by Region
Chapter 7. Global Immersive Display In Entertainment Market by Application
- 7.1 Global Theater & Cinema Market by Region
- 7.2 Global Entertainment Venues Market by Region
- 7.3 Global Theme Parks & Amusement Parks Market by Region
- 7.4 Global Museum & Exhibitions Market by Region
- 7.5 Global Content Creation Studios Market by Region
- 7.6 Global Other Application Market by Region
Chapter 8. Global Immersive Display In Entertainment Market by Region
- 8.1 North America Immersive Display In Entertainment Market
- 8.1.1 North America Immersive Display In Entertainment Market by Technology
- 8.1.1.1 North America LED Market by Country
- 8.1.1.2 North America OLED Market by Country
- 8.1.1.3 North America Other Technology Market by Country
- 8.1.2 North America Immersive Display In Entertainment Market by Resolution
- 8.1.2.1 North America 4K Market by Country
- 8.1.2.2 North America 8K Market by Country
- 8.1.2.3 North America Other Resolution Market by Country
- 8.1.3 North America Immersive Display In Entertainment Market by Application
- 8.1.3.1 North America Theater & Cinema Market by Country
- 8.1.3.2 North America Entertainment Venues Market by Country
- 8.1.3.3 North America Theme Parks & Amusement Parks Market by Country
- 8.1.3.4 North America Museum & Exhibitions Market by Country
- 8.1.3.5 North America Content Creation Studios Market by Country
- 8.1.3.6 North America Other Application Market by Country
- 8.1.4 North America Immersive Display In Entertainment Market by Country
- 8.1.4.1 US Immersive Display In Entertainment Market
- 8.1.4.1.1 US Immersive Display In Entertainment Market by Technology
- 8.1.4.1.2 US Immersive Display In Entertainment Market by Resolution
- 8.1.4.1.3 US Immersive Display In Entertainment Market by Application
- 8.1.4.2 Canada Immersive Display In Entertainment Market
- 8.1.4.2.1 Canada Immersive Display In Entertainment Market by Technology
- 8.1.4.2.2 Canada Immersive Display In Entertainment Market by Resolution
- 8.1.4.2.3 Canada Immersive Display In Entertainment Market by Application
- 8.1.4.3 Mexico Immersive Display In Entertainment Market
- 8.1.4.3.1 Mexico Immersive Display In Entertainment Market by Technology
- 8.1.4.3.2 Mexico Immersive Display In Entertainment Market by Resolution
- 8.1.4.3.3 Mexico Immersive Display In Entertainment Market by Application
- 8.1.4.4 Rest of North America Immersive Display In Entertainment Market
- 8.1.4.4.1 Rest of North America Immersive Display In Entertainment Market by Technology
- 8.1.4.4.2 Rest of North America Immersive Display In Entertainment Market by Resolution
- 8.1.4.4.3 Rest of North America Immersive Display In Entertainment Market by Application
- 8.1.4.1 US Immersive Display In Entertainment Market
- 8.1.1 North America Immersive Display In Entertainment Market by Technology
- 8.2 Europe Immersive Display In Entertainment Market
- 8.2.1 Europe Immersive Display In Entertainment Market by Technology
- 8.2.1.1 Europe LED Market by Country
- 8.2.1.2 Europe OLED Market by Country
- 8.2.1.3 Europe Other Technology Market by Country
- 8.2.2 Europe Immersive Display In Entertainment Market by Resolution
- 8.2.2.1 Europe 4K Market by Country
- 8.2.2.2 Europe 8K Market by Country
- 8.2.2.3 Europe Other Resolution Market by Country
- 8.2.3 Europe Immersive Display In Entertainment Market by Application
- 8.2.3.1 Europe Theater & Cinema Market by Country
- 8.2.3.2 Europe Entertainment Venues Market by Country
- 8.2.3.3 Europe Theme Parks & Amusement Parks Market by Country
- 8.2.3.4 Europe Museum & Exhibitions Market by Country
- 8.2.3.5 Europe Content Creation Studios Market by Country
- 8.2.3.6 Europe Other Application Market by Country
- 8.2.4 Europe Immersive Display In Entertainment Market by Country
- 8.2.4.1 Germany Immersive Display In Entertainment Market
- 8.2.4.1.1 Germany Immersive Display In Entertainment Market by Technology
- 8.2.4.1.2 Germany Immersive Display In Entertainment Market by Resolution
- 8.2.4.1.3 Germany Immersive Display In Entertainment Market by Application
- 8.2.4.2 UK Immersive Display In Entertainment Market
- 8.2.4.2.1 UK Immersive Display In Entertainment Market by Technology
- 8.2.4.2.2 UK Immersive Display In Entertainment Market by Resolution
- 8.2.4.2.3 UK Immersive Display In Entertainment Market by Application
- 8.2.4.3 France Immersive Display In Entertainment Market
- 8.2.4.3.1 France Immersive Display In Entertainment Market by Technology
- 8.2.4.3.2 France Immersive Display In Entertainment Market by Resolution
- 8.2.4.3.3 France Immersive Display In Entertainment Market by Application
- 8.2.4.4 Russia Immersive Display In Entertainment Market
- 8.2.4.4.1 Russia Immersive Display In Entertainment Market by Technology
- 8.2.4.4.2 Russia Immersive Display In Entertainment Market by Resolution
- 8.2.4.4.3 Russia Immersive Display In Entertainment Market by Application
- 8.2.4.5 Spain Immersive Display In Entertainment Market
- 8.2.4.5.1 Spain Immersive Display In Entertainment Market by Technology
- 8.2.4.5.2 Spain Immersive Display In Entertainment Market by Resolution
- 8.2.4.5.3 Spain Immersive Display In Entertainment Market by Application
- 8.2.4.6 Italy Immersive Display In Entertainment Market
- 8.2.4.6.1 Italy Immersive Display In Entertainment Market by Technology
- 8.2.4.6.2 Italy Immersive Display In Entertainment Market by Resolution
- 8.2.4.6.3 Italy Immersive Display In Entertainment Market by Application
- 8.2.4.7 Rest of Europe Immersive Display In Entertainment Market
- 8.2.4.7.1 Rest of Europe Immersive Display In Entertainment Market by Technology
- 8.2.4.7.2 Rest of Europe Immersive Display In Entertainment Market by Resolution
- 8.2.4.7.3 Rest of Europe Immersive Display In Entertainment Market by Application
- 8.2.4.1 Germany Immersive Display In Entertainment Market
- 8.2.1 Europe Immersive Display In Entertainment Market by Technology
- 8.3 Asia Pacific Immersive Display In Entertainment Market
- 8.3.1 Asia Pacific Immersive Display In Entertainment Market by Technology
- 8.3.1.1 Asia Pacific LED Market by Country
- 8.3.1.2 Asia Pacific OLED Market by Country
- 8.3.1.3 Asia Pacific Other Technology Market by Country
- 8.3.2 Asia Pacific Immersive Display In Entertainment Market by Resolution
- 8.3.2.1 Asia Pacific 4K Market by Country
- 8.3.2.2 Asia Pacific 8K Market by Country
- 8.3.2.3 Asia Pacific Other Resolution Market by Country
- 8.3.3 Asia Pacific Immersive Display In Entertainment Market by Application
- 8.3.3.1 Asia Pacific Theater & Cinema Market by Country
- 8.3.3.2 Asia Pacific Entertainment Venues Market by Country
- 8.3.3.3 Asia Pacific Theme Parks & Amusement Parks Market by Country
- 8.3.3.4 Asia Pacific Museum & Exhibitions Market by Country
- 8.3.3.5 Asia Pacific Content Creation Studios Market by Country
- 8.3.3.6 Asia Pacific Other Application Market by Country
- 8.3.4 Asia Pacific Immersive Display In Entertainment Market by Country
- 8.3.4.1 China Immersive Display In Entertainment Market
- 8.3.4.1.1 China Immersive Display In Entertainment Market by Technology
- 8.3.4.1.2 China Immersive Display In Entertainment Market by Resolution
- 8.3.4.1.3 China Immersive Display In Entertainment Market by Application
- 8.3.4.2 Japan Immersive Display In Entertainment Market
- 8.3.4.2.1 Japan Immersive Display In Entertainment Market by Technology
- 8.3.4.2.2 Japan Immersive Display In Entertainment Market by Resolution
- 8.3.4.2.3 Japan Immersive Display In Entertainment Market by Application
- 8.3.4.3 India Immersive Display In Entertainment Market
- 8.3.4.3.1 India Immersive Display In Entertainment Market by Technology
- 8.3.4.3.2 India Immersive Display In Entertainment Market by Resolution
- 8.3.4.3.3 India Immersive Display In Entertainment Market by Application
- 8.3.4.4 South Korea Immersive Display In Entertainment Market
- 8.3.4.4.1 South Korea Immersive Display In Entertainment Market by Technology
- 8.3.4.4.2 South Korea Immersive Display In Entertainment Market by Resolution
- 8.3.4.4.3 South Korea Immersive Display In Entertainment Market by Application
- 8.3.4.5 Singapore Immersive Display In Entertainment Market
- 8.3.4.5.1 Singapore Immersive Display In Entertainment Market by Technology
- 8.3.4.5.2 Singapore Immersive Display In Entertainment Market by Resolution
- 8.3.4.5.3 Singapore Immersive Display In Entertainment Market by Application
- 8.3.4.6 Malaysia Immersive Display In Entertainment Market
- 8.3.4.6.1 Malaysia Immersive Display In Entertainment Market by Technology
- 8.3.4.6.2 Malaysia Immersive Display In Entertainment Market by Resolution
- 8.3.4.6.3 Malaysia Immersive Display In Entertainment Market by Application
- 8.3.4.7 Rest of Asia Pacific Immersive Display In Entertainment Market
- 8.3.4.7.1 Rest of Asia Pacific Immersive Display In Entertainment Market by Technology
- 8.3.4.7.2 Rest of Asia Pacific Immersive Display In Entertainment Market by Resolution
- 8.3.4.7.3 Rest of Asia Pacific Immersive Display In Entertainment Market by Application
- 8.3.4.1 China Immersive Display In Entertainment Market
- 8.3.1 Asia Pacific Immersive Display In Entertainment Market by Technology
- 8.4 LAMEA Immersive Display In Entertainment Market
- 8.4.1 LAMEA Immersive Display In Entertainment Market by Technology
- 8.4.1.1 LAMEA LED Market by Country
- 8.4.1.2 LAMEA OLED Market by Country
- 8.4.1.3 LAMEA Other Technology Market by Country
- 8.4.2 LAMEA Immersive Display In Entertainment Market by Resolution
- 8.4.2.1 LAMEA 4K Market by Country
- 8.4.2.2 LAMEA 8K Market by Country
- 8.4.2.3 LAMEA Other Resolution Market by Country
- 8.4.3 LAMEA Immersive Display In Entertainment Market by Application
- 8.4.3.1 LAMEA Theater & Cinema Market by Country
- 8.4.3.2 LAMEA Entertainment Venues Market by Country
- 8.4.3.3 LAMEA Theme Parks & Amusement Parks Market by Country
- 8.4.3.4 LAMEA Museum & Exhibitions Market by Country
- 8.4.3.5 LAMEA Content Creation Studios Market by Country
- 8.4.3.6 LAMEA Other Application Market by Country
- 8.4.4 LAMEA Immersive Display In Entertainment Market by Country
- 8.4.4.1 Brazil Immersive Display In Entertainment Market
- 8.4.4.1.1 Brazil Immersive Display In Entertainment Market by Technology
- 8.4.4.1.2 Brazil Immersive Display In Entertainment Market by Resolution
- 8.4.4.1.3 Brazil Immersive Display In Entertainment Market by Application
- 8.4.4.2 Argentina Immersive Display In Entertainment Market
- 8.4.4.2.1 Argentina Immersive Display In Entertainment Market by Technology
- 8.4.4.2.2 Argentina Immersive Display In Entertainment Market by Resolution
- 8.4.4.2.3 Argentina Immersive Display In Entertainment Market by Application
- 8.4.4.3 UAE Immersive Display In Entertainment Market
- 8.4.4.3.1 UAE Immersive Display In Entertainment Market by Technology
- 8.4.4.3.2 UAE Immersive Display In Entertainment Market by Resolution
- 8.4.4.3.3 UAE Immersive Display In Entertainment Market by Application
- 8.4.4.4 Saudi Arabia Immersive Display In Entertainment Market
- 8.4.4.4.1 Saudi Arabia Immersive Display In Entertainment Market by Technology
- 8.4.4.4.2 Saudi Arabia Immersive Display In Entertainment Market by Resolution
- 8.4.4.4.3 Saudi Arabia Immersive Display In Entertainment Market by Application
- 8.4.4.5 South Africa Immersive Display In Entertainment Market
- 8.4.4.5.1 South Africa Immersive Display In Entertainment Market by Technology
- 8.4.4.5.2 South Africa Immersive Display In Entertainment Market by Resolution
- 8.4.4.5.3 South Africa Immersive Display In Entertainment Market by Application
- 8.4.4.6 Nigeria Immersive Display In Entertainment Market
- 8.4.4.6.1 Nigeria Immersive Display In Entertainment Market by Technology
- 8.4.4.6.2 Nigeria Immersive Display In Entertainment Market by Resolution
- 8.4.4.6.3 Nigeria Immersive Display In Entertainment Market by Application
- 8.4.4.7 Rest of LAMEA Immersive Display In Entertainment Market
- 8.4.4.7.1 Rest of LAMEA Immersive Display In Entertainment Market by Technology
- 8.4.4.7.2 Rest of LAMEA Immersive Display In Entertainment Market by Resolution
- 8.4.4.7.3 Rest of LAMEA Immersive Display In Entertainment Market by Application
- 8.4.4.1 Brazil Immersive Display In Entertainment Market
- 8.4.1 LAMEA Immersive Display In Entertainment Market by Technology
Chapter 9. Company Profiles
- 9.1 Barco NV
- 9.1.1 Company Overview
- 9.1.2 Financial Analysis
- 9.1.3 Segmental and Regional Analysis
- 9.1.4 Research & Development Expenses
- 9.1.5 Recent strategies and developments:
- 9.1.5.1 Partnerships, Collaborations, and Agreements:
- 9.1.5.2 Product Launches and Product Expansions:
- 9.1.6 SWOT Analysis
- 9.2 Leyard Optoelectronic Co Ltd
- 9.2.1 Company Overview
- 9.2.2 Recent strategies and developments:
- 9.2.2.1 Partnerships, Collaborations, and Agreements:
- 9.2.2.2 Product Launches and Product Expansions:
- 9.2.3 SWOT Analysis
- 9.3 LG Electronics, Inc. (LG Corporation)
- 9.3.1 Company Overview
- 9.3.2 Financial Analysis
- 9.3.3 Regional & Segmental Analysis
- 9.3.4 Research & Development Expenses
- 9.3.5 Recent strategies and developments:
- 9.3.5.1 Product Launches and Product Expansions:
- 9.3.6 SWOT Analysis
- 9.4 Panasonic Holdings Corporation
- 9.4.1 Company Overview
- 9.4.2 Financial Analysis
- 9.4.3 Segmental and Regional Analysis
- 9.4.4 Research & Development Expenses
- 9.4.5 SWOT Analysis
- 9.5 Samsung Electronics Co., Ltd. (Samsung Group)
- 9.5.1 Company Overview
- 9.5.2 Financial Analysis
- 9.5.3 Segmental and Regional Analysis
- 9.5.4 Research & Development Expenses
- 9.5.5 Recent strategies and developments:
- 9.5.5.1 Partnerships, Collaborations, and Agreements:
- 9.5.6 SWOT Analysis
- 9.6 Sharp Corporation
- 9.6.1 Company Overview
- 9.6.2 Financial Analysis
- 9.6.3 Segmental & Regional Analysis
- 9.6.4 Research & Development Expense
- 9.6.5 Recent strategies and developments:
- 9.6.5.1 Product Launches and Product Expansions:
- 9.6.6 SWOT Analysis
- 9.7 Sony Corporation
- 9.7.1 Company Overview
- 9.7.2 Financial Analysis
- 9.7.3 Segmental and Regional Analysis
- 9.7.4 Research & Development Expenses
- 9.7.5 Recent strategies and developments:
- 9.7.5.1 Product Launches and Product Expansions:
- 9.7.6 SWOT Analysis
- 9.8 HTC Corporation
- 9.8.1 Company Overview
- 9.8.2 Financial Analysis
- 9.8.3 Research & Development Expenses
- 9.8.4 Recent strategies and developments:
- 9.8.4.1 Product Launches and Product Expansions:
- 9.8.5 SWOT Analysis
- 9.9 Meta Platforms, Inc.
- 9.9.1 Company Overview
- 9.9.2 Financial Analysis
- 9.9.3 Segment and Regional Analysis
- 9.9.4 Research & Development Expense
- 9.9.5 Recent strategies and developments:
- 9.9.5.1 Partnerships, Collaborations, and Agreements:
- 9.9.6 SWOT Analysis
- 9.10. Microsoft Corporation
- 9.10.1 Company Overview
- 9.10.2 Financial Analysis
- 9.10.3 Segmental and Regional Analysis
- 9.10.4 Research & Development Expenses
- 9.10.5 SWOT Analysis
