|
|
市場調査レポート
商品コード
1292469
3D ICおよび2.5D ICパッケージングの世界市場規模、シェア、産業動向分析レポートパッケージング技術別、エンドユーザー別、用途別(メモリ、イメージング&オプトエレクトロニクス、MEMS/センサー、ロジック、LED)、地域別展望と予測、2023年~2029年Global 3D IC and 2.5D IC Packaging Market Size, Share & Industry Trends Analysis Report By Packaging Technology, By End User, By Application (Memory, Imaging & Optoelectronics, MEMS/Sensors, Logic, LED), By Regional Outlook and Forecast, 2023 - 2029 |
||||||
|
|
|||||||
|
|||||||


| 3D ICおよび2.5D ICパッケージングの世界市場規模、シェア、産業動向分析レポートパッケージング技術別、エンドユーザー別、用途別(メモリ、イメージング&オプトエレクトロニクス、MEMS/センサー、ロジック、LED)、地域別展望と予測、2023年~2029年 |
|
出版日: 2023年05月31日
発行: KBV Research
ページ情報: 英文 262 Pages
納期: 即納可能
|

- 全表示
- 概要
- 図表
- 目次
3D ICおよび2.5D ICパッケージング市場規模は2029年に830億米ドルに達すると予測、予測期間中にCAGR10.1%の市場成長率で上昇。
パッケージング技術の展望
パッケージング技術に基づき、市場は3Dウエハーレベル・チップスケール・パッケージング(WLCSP)、3Dスルーシリコンビア(TSV)、2.5Dに分類されます。2022年の市場では、3Dウエハーレベル・チップスケール・パッケージング(WLCSP)分野がかなりの成長率を確保しました。3D WLCSPは、最もコンパクトなパッケージオプションの1つで、ほとんどのPCBまたはプリント回路基板において、より高い機能性と優れた熱性能を提供します。高温に耐えるポリマーを使用することで、3D WLCSPは3D ICを製造するための簡素化されたプロセスアーキテクチャを提供し、熱問題を克服します。
アプリケーションの展望
アプリケーション別では、ロジック、イメージング&オプトエレクトロニクス、メモリー、MEMS/センサー、LED、その他に分類されます。2022年の市場では、MEMS/センサー分野が大きな収益シェアを記録しました。マイクロアクチュエータ、マイクロセンサ、マイクロエレクトロニクスは、MEMSの機能部品です。中でも、MEMSの最先端部品には、ジャイロスコープ、デジタルコンパス、加速度計、慣性モジュール、湿度センサー、マイクロフォン、圧力センサー、スマートセンサーなどがあります。これらの部品やセンサーは、いずれも小型化された構造を持つことが求められています。
エンドユーザーの展望
エンドユーザー別では、家電、産業、通信、自動車、軍事・航空宇宙、医療機器、その他に分類されます。2022年の市場では、通信分野が顕著な成長率を調達しています。3D ICと2.5D ICは、通信アプリケーションにおいて、高性能化、低消費電力化、省スペース化、熱性能の向上、シグナルインテグリティの改善など、大きなメリットを提供します。これらの利点は、通信機器の設計者や製造者にとって魅力的な選択肢となっています。3D ICや2.5D ICのパッケージングにより、複数のコンポーネントをより小さなフォームファクターに統合することができるため、モバイル機器のようにスペースが限られているアプリケーションに最適です。
地域別展望
地域別では、北米、欧州、アジア太平洋、LAMEAで分析しています。2022年の市場では、アジア太平洋地域が最も高い収益シェアを記録しました。幅広いコンシューマーエレクトロニクス用途のため、アジア太平洋地域は主要市場の一つとなっています。これは主に、この地域の人口が密集しているためで、最も高い潜在的な市場を持つ4大主要地域となっています。さらに、通信や自動車分野の進歩や拡大により、ICの利用も増加しています。
目次
第1章 市場範囲と調査手法
- 市場の定義
- 目的
- 市場範囲
- セグメンテーション
- 調査手法
第2章 市場概要
- イントロダクション
- 概要
- 市場構成とシナリオ
- 概要
- 市場に影響を与える主な要因
- 市場促進要因
- 市場抑制要因
第3章 競合分析- 世界
- 市場シェア分析2022
第4章 世界の3DICおよび2.5DICパッケージング市場:パッケージング技術別
- 世界の2.5D市場:地域別
- 世界の3Dウェーハレベルチップスケールパッケージング(WLCSP)市場:地域別
- 世界の3Dスルーシリコンビア(TSV)市場:地域別
第5章 世界の3DICおよび2.5DICパッケージング市場:エンドユーザー別
- 世界の家電市場:地域別
- 世界の自動車市場:地域別
- 世界の産業市場:地域別
- 世界の軍事および航空宇宙市場:地域別
- 世界の通信市場:地域別
- 世界の医療機器およびその他の市場:地域別
第6章 世界の3DICおよび2.5DICパッケージング市場:用途別
- 世界のメモリ市場:地域別
- 世界のイメージングおよびオプトエレクトロニクス市場:地域別
- 世界のMEMS/センサー市場:地域別
- 世界のロジック市場:地域別
- 世界のLED市場:地域別
- 世界のその他の市場:地域別
第7章 世界の3DICおよび2.5DICパッケージング市場:地域別
- 北米
- 北米の国別3D ICおよび2.5D ICパッケージング市場
- 米国
- カナダ
- メキシコ
- その他北米地域
- 北米の国別3D ICおよび2.5D ICパッケージング市場
- 欧州
- 欧州の国別3D ICおよび2.5D ICパッケージング市場
- ドイツ
- 英国
- フランス
- ロシア
- スペイン
- イタリア
- その他欧州地域
- 欧州の国別3D ICおよび2.5D ICパッケージング市場
- アジア太平洋
- アジア太平洋地域の国別3D ICおよび2.5D ICパッケージング市場
- 中国
- 日本
- 台湾
- インド
- 韓国
- シンガポール
- その他アジア太平洋地域
- アジア太平洋地域の国別3D ICおよび2.5D ICパッケージング市場
- ラテンアメリカ・中東・アフリカ
- LAMEAの国別 3D ICおよび2.5D ICパッケージング市場
- ブラジル
- アルゼンチン
- アラブ首長国連邦
- サウジアラビア
- 南アフリカ
- ナイジェリア
- その他ラテンアメリカ・中東・アフリカ地域
- LAMEAの国別 3D ICおよび2.5D ICパッケージング市場
第8章 企業プロファイル
- Samsung Electronics Co, Ltd.(Samsung Group)
- Taiwan Semiconductor Manufacturing Company Limited
- Intel Corporation
- ASE Group(ASE Technology Holding Co, Ltd.)
- Amkor Technology, Inc
- Broadcom, Inc
- Texas Instruments, Inc
- JCET Group
- Powertech Technology Inc
- United Microelectronics Corporation
LIST OF TABLES
- TABLE 1 Global 3D IC and 2.5D IC Packaging Market, 2019 - 2022, USD Million
- TABLE 2 Global 3D IC and 2.5D IC Packaging Market, 2023 - 2029, USD Million
- TABLE 3 Global 3D IC and 2.5D IC Packaging Market by Packaging Technology, 2019 - 2022, USD Million
- TABLE 4 Global 3D IC and 2.5D IC Packaging Market by Packaging Technology, 2023 - 2029, USD Million
- TABLE 5 Global 2.5D Market by Region, 2019 - 2022, USD Million
- TABLE 6 Global 2.5D Market by Region, 2023 - 2029, USD Million
- TABLE 7 Global 3D wafer-level chip-scale packaging (WLCSP) Market by Region, 2019 - 2022, USD Million
- TABLE 8 Global 3D wafer-level chip-scale packaging (WLCSP) Market by Region, 2023 - 2029, USD Million
- TABLE 9 Global 3D Through-silicon via (TSV) Market by Region, 2019 - 2022, USD Million
- TABLE 10 Global 3D Through-silicon via (TSV) Market by Region, 2023 - 2029, USD Million
- TABLE 11 Global 3D IC and 2.5D IC Packaging Market by End User, 2019 - 2022, USD Million
- TABLE 12 Global 3D IC and 2.5D IC Packaging Market by End User, 2023 - 2029, USD Million
- TABLE 13 Global Consumer Electronics Market by Region, 2019 - 2022, USD Million
- TABLE 14 Global Consumer Electronics Market by Region, 2023 - 2029, USD Million
- TABLE 15 Global Automotive Market by Region, 2019 - 2022, USD Million
- TABLE 16 Global Automotive Market by Region, 2023 - 2029, USD Million
- TABLE 17 Global Industrial Market by Region, 2019 - 2022, USD Million
- TABLE 18 Global Industrial Market by Region, 2023 - 2029, USD Million
- TABLE 19 Global Military & Aerospace Market by Region, 2019 - 2022, USD Million
- TABLE 20 Global Military & Aerospace Market by Region, 2023 - 2029, USD Million
- TABLE 21 Global Telecommunications Market by Region, 2019 - 2022, USD Million
- TABLE 22 Global Telecommunications Market by Region, 2023 - 2029, USD Million
- TABLE 23 Global Medical Devices & Others Market by Region, 2019 - 2022, USD Million
- TABLE 24 Global Medical Devices & Others Market by Region, 2023 - 2029, USD Million
- TABLE 25 Global 3D IC and 2.5D IC Packaging Market by Application, 2019 - 2022, USD Million
- TABLE 26 Global 3D IC and 2.5D IC Packaging Market by Application, 2023 - 2029, USD Million
- TABLE 27 Global Memory Market by Region, 2019 - 2022, USD Million
- TABLE 28 Global Memory Market by Region, 2023 - 2029, USD Million
- TABLE 29 Global Imaging & Optoelectronics Market by Region, 2019 - 2022, USD Million
- TABLE 30 Global Imaging & Optoelectronics Market by Region, 2023 - 2029, USD Million
- TABLE 31 Global MEMS/Sensors Market by Region, 2019 - 2022, USD Million
- TABLE 32 Global MEMS/Sensors Market by Region, 2023 - 2029, USD Million
- TABLE 33 Global Logic Market by Region, 2019 - 2022, USD Million
- TABLE 34 Global Logic Market by Region, 2023 - 2029, USD Million
- TABLE 35 Global LED Market by Region, 2019 - 2022, USD Million
- TABLE 36 Global LED Market by Region, 2023 - 2029, USD Million
- TABLE 37 Global Others Market by Region, 2019 - 2022, USD Million
- TABLE 38 Global Others Market by Region, 2023 - 2029, USD Million
- TABLE 39 Global 3D IC and 2.5D IC Packaging Market by Region, 2019 - 2022, USD Million
- TABLE 40 Global 3D IC and 2.5D IC Packaging Market by Region, 2023 - 2029, USD Million
- TABLE 41 North America 3D IC and 2.5D IC Packaging Market, 2019 - 2022, USD Million
- TABLE 42 North America 3D IC and 2.5D IC Packaging Market, 2023 - 2029, USD Million
- TABLE 43 North America 3D IC and 2.5D IC Packaging Market by Packaging Technology, 2019 - 2022, USD Million
- TABLE 44 North America 3D IC and 2.5D IC Packaging Market by Packaging Technology, 2023 - 2029, USD Million
- TABLE 45 North America 2.5D Market by Country, 2019 - 2022, USD Million
- TABLE 46 North America 2.5D Market by Country, 2023 - 2029, USD Million
- TABLE 47 North America 3D wafer-level chip-scale packaging (WLCSP) Market by Country, 2019 - 2022, USD Million
- TABLE 48 North America 3D wafer-level chip-scale packaging (WLCSP) Market by Country, 2023 - 2029, USD Million
- TABLE 49 North America 3D Through-silicon via (TSV) Market by Country, 2019 - 2022, USD Million
- TABLE 50 North America 3D Through-silicon via (TSV) Market by Country, 2023 - 2029, USD Million
- TABLE 51 North America 3D IC and 2.5D IC Packaging Market by End User, 2019 - 2022, USD Million
- TABLE 52 North America 3D IC and 2.5D IC Packaging Market by End User, 2023 - 2029, USD Million
- TABLE 53 North America Consumer Electronics Market by Country, 2019 - 2022, USD Million
- TABLE 54 North America Consumer Electronics Market by Country, 2023 - 2029, USD Million
- TABLE 55 North America Automotive Market by Country, 2019 - 2022, USD Million
- TABLE 56 North America Automotive Market by Country, 2023 - 2029, USD Million
- TABLE 57 North America Industrial Market by Country, 2019 - 2022, USD Million
- TABLE 58 North America Industrial Market by Country, 2023 - 2029, USD Million
- TABLE 59 North America Military & Aerospace Market by Country, 2019 - 2022, USD Million
- TABLE 60 North America Military & Aerospace Market by Country, 2023 - 2029, USD Million
- TABLE 61 North America Telecommunications Market by Country, 2019 - 2022, USD Million
- TABLE 62 North America Telecommunications Market by Country, 2023 - 2029, USD Million
- TABLE 63 North America Medical Devices & Others Market by Country, 2019 - 2022, USD Million
- TABLE 64 North America Medical Devices & Others Market by Country, 2023 - 2029, USD Million
- TABLE 65 North America 3D IC and 2.5D IC Packaging Market by Application, 2019 - 2022, USD Million
- TABLE 66 North America 3D IC and 2.5D IC Packaging Market by Application, 2023 - 2029, USD Million
- TABLE 67 North America Memory Market by Country, 2019 - 2022, USD Million
- TABLE 68 North America Memory Market by Country, 2023 - 2029, USD Million
- TABLE 69 North America Imaging & Optoelectronics Market by Country, 2019 - 2022, USD Million
- TABLE 70 North America Imaging & Optoelectronics Market by Country, 2023 - 2029, USD Million
- TABLE 71 North America MEMS/Sensors Market by Country, 2019 - 2022, USD Million
- TABLE 72 North America MEMS/Sensors Market by Country, 2023 - 2029, USD Million
- TABLE 73 North America Logic Market by Country, 2019 - 2022, USD Million
- TABLE 74 North America Logic Market by Country, 2023 - 2029, USD Million
- TABLE 75 North America LED Market by Country, 2019 - 2022, USD Million
- TABLE 76 North America LED Market by Country, 2023 - 2029, USD Million
- TABLE 77 North America Others Market by Country, 2019 - 2022, USD Million
- TABLE 78 North America Others Market by Country, 2023 - 2029, USD Million
- TABLE 79 North America 3D IC and 2.5D IC Packaging Market by Country, 2019 - 2022, USD Million
- TABLE 80 North America 3D IC and 2.5D IC Packaging Market by Country, 2023 - 2029, USD Million
- TABLE 81 US 3D IC and 2.5D IC Packaging Market, 2019 - 2022, USD Million
- TABLE 82 US 3D IC and 2.5D IC Packaging Market, 2023 - 2029, USD Million
- TABLE 83 US 3D IC and 2.5D IC Packaging Market by Packaging Technology, 2019 - 2022, USD Million
- TABLE 84 US 3D IC and 2.5D IC Packaging Market by Packaging Technology, 2023 - 2029, USD Million
- TABLE 85 US 3D IC and 2.5D IC Packaging Market by End User, 2019 - 2022, USD Million
- TABLE 86 US 3D IC and 2.5D IC Packaging Market by End User, 2023 - 2029, USD Million
- TABLE 87 US 3D IC and 2.5D IC Packaging Market by Application, 2019 - 2022, USD Million
- TABLE 88 US 3D IC and 2.5D IC Packaging Market by Application, 2023 - 2029, USD Million
- TABLE 89 Canada 3D IC and 2.5D IC Packaging Market, 2019 - 2022, USD Million
- TABLE 90 Canada 3D IC and 2.5D IC Packaging Market, 2023 - 2029, USD Million
- TABLE 91 Canada 3D IC and 2.5D IC Packaging Market by Packaging Technology, 2019 - 2022, USD Million
- TABLE 92 Canada 3D IC and 2.5D IC Packaging Market by Packaging Technology, 2023 - 2029, USD Million
- TABLE 93 Canada 3D IC and 2.5D IC Packaging Market by End User, 2019 - 2022, USD Million
- TABLE 94 Canada 3D IC and 2.5D IC Packaging Market by End User, 2023 - 2029, USD Million
- TABLE 95 Canada 3D IC and 2.5D IC Packaging Market by Application, 2019 - 2022, USD Million
- TABLE 96 Canada 3D IC and 2.5D IC Packaging Market by Application, 2023 - 2029, USD Million
- TABLE 97 Mexico 3D IC and 2.5D IC Packaging Market, 2019 - 2022, USD Million
- TABLE 98 Mexico 3D IC and 2.5D IC Packaging Market, 2023 - 2029, USD Million
- TABLE 99 Mexico 3D IC and 2.5D IC Packaging Market by Packaging Technology, 2019 - 2022, USD Million
- TABLE 100 Mexico 3D IC and 2.5D IC Packaging Market by Packaging Technology, 2023 - 2029, USD Million
- TABLE 101 Mexico 3D IC and 2.5D IC Packaging Market by End User, 2019 - 2022, USD Million
- TABLE 102 Mexico 3D IC and 2.5D IC Packaging Market by End User, 2023 - 2029, USD Million
- TABLE 103 Mexico 3D IC and 2.5D IC Packaging Market by Application, 2019 - 2022, USD Million
- TABLE 104 Mexico 3D IC and 2.5D IC Packaging Market by Application, 2023 - 2029, USD Million
- TABLE 105 Rest of North America 3D IC and 2.5D IC Packaging Market, 2019 - 2022, USD Million
- TABLE 106 Rest of North America 3D IC and 2.5D IC Packaging Market, 2023 - 2029, USD Million
- TABLE 107 Rest of North America 3D IC and 2.5D IC Packaging Market by Packaging Technology, 2019 - 2022, USD Million
- TABLE 108 Rest of North America 3D IC and 2.5D IC Packaging Market by Packaging Technology, 2023 - 2029, USD Million
- TABLE 109 Rest of North America 3D IC and 2.5D IC Packaging Market by End User, 2019 - 2022, USD Million
- TABLE 110 Rest of North America 3D IC and 2.5D IC Packaging Market by End User, 2023 - 2029, USD Million
- TABLE 111 Rest of North America 3D IC and 2.5D IC Packaging Market by Application, 2019 - 2022, USD Million
- TABLE 112 Rest of North America 3D IC and 2.5D IC Packaging Market by Application, 2023 - 2029, USD Million
- TABLE 113 Europe 3D IC and 2.5D IC Packaging Market, 2019 - 2022, USD Million
- TABLE 114 Europe 3D IC and 2.5D IC Packaging Market, 2023 - 2029, USD Million
- TABLE 115 Europe 3D IC and 2.5D IC Packaging Market by Packaging Technology, 2019 - 2022, USD Million
- TABLE 116 Europe 3D IC and 2.5D IC Packaging Market by Packaging Technology, 2023 - 2029, USD Million
- TABLE 117 Europe 2.5D Market by Country, 2019 - 2022, USD Million
- TABLE 118 Europe 2.5D Market by Country, 2023 - 2029, USD Million
- TABLE 119 Europe 3D wafer-level chip-scale packaging (WLCSP) Market by Country, 2019 - 2022, USD Million
- TABLE 120 Europe 3D wafer-level chip-scale packaging (WLCSP) Market by Country, 2023 - 2029, USD Million
- TABLE 121 Europe 3D Through-silicon via (TSV) Market by Country, 2019 - 2022, USD Million
- TABLE 122 Europe 3D Through-silicon via (TSV) Market by Country, 2023 - 2029, USD Million
- TABLE 123 Europe 3D IC and 2.5D IC Packaging Market by End User, 2019 - 2022, USD Million
- TABLE 124 Europe 3D IC and 2.5D IC Packaging Market by End User, 2023 - 2029, USD Million
- TABLE 125 Europe Consumer Electronics Market by Country, 2019 - 2022, USD Million
- TABLE 126 Europe Consumer Electronics Market by Country, 2023 - 2029, USD Million
- TABLE 127 Europe Automotive Market by Country, 2019 - 2022, USD Million
- TABLE 128 Europe Automotive Market by Country, 2023 - 2029, USD Million
- TABLE 129 Europe Industrial Market by Country, 2019 - 2022, USD Million
- TABLE 130 Europe Industrial Market by Country, 2023 - 2029, USD Million
- TABLE 131 Europe Military & Aerospace Market by Country, 2019 - 2022, USD Million
- TABLE 132 Europe Military & Aerospace Market by Country, 2023 - 2029, USD Million
- TABLE 133 Europe Telecommunications Market by Country, 2019 - 2022, USD Million
- TABLE 134 Europe Telecommunications Market by Country, 2023 - 2029, USD Million
- TABLE 135 Europe Medical Devices & Others Market by Country, 2019 - 2022, USD Million
- TABLE 136 Europe Medical Devices & Others Market by Country, 2023 - 2029, USD Million
- TABLE 137 Europe 3D IC and 2.5D IC Packaging Market by Application, 2019 - 2022, USD Million
- TABLE 138 Europe 3D IC and 2.5D IC Packaging Market by Application, 2023 - 2029, USD Million
- TABLE 139 Europe Memory Market by Country, 2019 - 2022, USD Million
- TABLE 140 Europe Memory Market by Country, 2023 - 2029, USD Million
- TABLE 141 Europe Imaging & Optoelectronics Market by Country, 2019 - 2022, USD Million
- TABLE 142 Europe Imaging & Optoelectronics Market by Country, 2023 - 2029, USD Million
- TABLE 143 Europe MEMS/Sensors Market by Country, 2019 - 2022, USD Million
- TABLE 144 Europe MEMS/Sensors Market by Country, 2023 - 2029, USD Million
- TABLE 145 Europe Logic Market by Country, 2019 - 2022, USD Million
- TABLE 146 Europe Logic Market by Country, 2023 - 2029, USD Million
- TABLE 147 Europe LED Market by Country, 2019 - 2022, USD Million
- TABLE 148 Europe LED Market by Country, 2023 - 2029, USD Million
- TABLE 149 Europe Others Market by Country, 2019 - 2022, USD Million
- TABLE 150 Europe Others Market by Country, 2023 - 2029, USD Million
- TABLE 151 Europe 3D IC and 2.5D IC Packaging Market by Country, 2019 - 2022, USD Million
- TABLE 152 Europe 3D IC and 2.5D IC Packaging Market by Country, 2023 - 2029, USD Million
- TABLE 153 Germany 3D IC and 2.5D IC Packaging Market, 2019 - 2022, USD Million
- TABLE 154 Germany 3D IC and 2.5D IC Packaging Market, 2023 - 2029, USD Million
- TABLE 155 Germany 3D IC and 2.5D IC Packaging Market by Packaging Technology, 2019 - 2022, USD Million
- TABLE 156 Germany 3D IC and 2.5D IC Packaging Market by Packaging Technology, 2023 - 2029, USD Million
- TABLE 157 Germany 3D IC and 2.5D IC Packaging Market by End User, 2019 - 2022, USD Million
- TABLE 158 Germany 3D IC and 2.5D IC Packaging Market by End User, 2023 - 2029, USD Million
- TABLE 159 Germany 3D IC and 2.5D IC Packaging Market by Application, 2019 - 2022, USD Million
- TABLE 160 Germany 3D IC and 2.5D IC Packaging Market by Application, 2023 - 2029, USD Million
- TABLE 161 UK 3D IC and 2.5D IC Packaging Market, 2019 - 2022, USD Million
- TABLE 162 UK 3D IC and 2.5D IC Packaging Market, 2023 - 2029, USD Million
- TABLE 163 UK 3D IC and 2.5D IC Packaging Market by Packaging Technology, 2019 - 2022, USD Million
- TABLE 164 UK 3D IC and 2.5D IC Packaging Market by Packaging Technology, 2023 - 2029, USD Million
- TABLE 165 UK 3D IC and 2.5D IC Packaging Market by End User, 2019 - 2022, USD Million
- TABLE 166 UK 3D IC and 2.5D IC Packaging Market by End User, 2023 - 2029, USD Million
- TABLE 167 UK 3D IC and 2.5D IC Packaging Market by Application, 2019 - 2022, USD Million
- TABLE 168 UK 3D IC and 2.5D IC Packaging Market by Application, 2023 - 2029, USD Million
- TABLE 169 France 3D IC and 2.5D IC Packaging Market, 2019 - 2022, USD Million
- TABLE 170 France 3D IC and 2.5D IC Packaging Market, 2023 - 2029, USD Million
- TABLE 171 France 3D IC and 2.5D IC Packaging Market by Packaging Technology, 2019 - 2022, USD Million
- TABLE 172 France 3D IC and 2.5D IC Packaging Market by Packaging Technology, 2023 - 2029, USD Million
- TABLE 173 France 3D IC and 2.5D IC Packaging Market by End User, 2019 - 2022, USD Million
- TABLE 174 France 3D IC and 2.5D IC Packaging Market by End User, 2023 - 2029, USD Million
- TABLE 175 France 3D IC and 2.5D IC Packaging Market by Application, 2019 - 2022, USD Million
- TABLE 176 France 3D IC and 2.5D IC Packaging Market by Application, 2023 - 2029, USD Million
- TABLE 177 Russia 3D IC and 2.5D IC Packaging Market, 2019 - 2022, USD Million
- TABLE 178 Russia 3D IC and 2.5D IC Packaging Market, 2023 - 2029, USD Million
- TABLE 179 Russia 3D IC and 2.5D IC Packaging Market by Packaging Technology, 2019 - 2022, USD Million
- TABLE 180 Russia 3D IC and 2.5D IC Packaging Market by Packaging Technology, 2023 - 2029, USD Million
- TABLE 181 Russia 3D IC and 2.5D IC Packaging Market by End User, 2019 - 2022, USD Million
- TABLE 182 Russia 3D IC and 2.5D IC Packaging Market by End User, 2023 - 2029, USD Million
- TABLE 183 Russia 3D IC and 2.5D IC Packaging Market by Application, 2019 - 2022, USD Million
- TABLE 184 Russia 3D IC and 2.5D IC Packaging Market by Application, 2023 - 2029, USD Million
- TABLE 185 Spain 3D IC and 2.5D IC Packaging Market, 2019 - 2022, USD Million
- TABLE 186 Spain 3D IC and 2.5D IC Packaging Market, 2023 - 2029, USD Million
- TABLE 187 Spain 3D IC and 2.5D IC Packaging Market by Packaging Technology, 2019 - 2022, USD Million
- TABLE 188 Spain 3D IC and 2.5D IC Packaging Market by Packaging Technology, 2023 - 2029, USD Million
- TABLE 189 Spain 3D IC and 2.5D IC Packaging Market by End User, 2019 - 2022, USD Million
- TABLE 190 Spain 3D IC and 2.5D IC Packaging Market by End User, 2023 - 2029, USD Million
- TABLE 191 Spain 3D IC and 2.5D IC Packaging Market by Application, 2019 - 2022, USD Million
- TABLE 192 Spain 3D IC and 2.5D IC Packaging Market by Application, 2023 - 2029, USD Million
- TABLE 193 Italy 3D IC and 2.5D IC Packaging Market, 2019 - 2022, USD Million
- TABLE 194 Italy 3D IC and 2.5D IC Packaging Market, 2023 - 2029, USD Million
- TABLE 195 Italy 3D IC and 2.5D IC Packaging Market by Packaging Technology, 2019 - 2022, USD Million
- TABLE 196 Italy 3D IC and 2.5D IC Packaging Market by Packaging Technology, 2023 - 2029, USD Million
- TABLE 197 Italy 3D IC and 2.5D IC Packaging Market by End User, 2019 - 2022, USD Million
- TABLE 198 Italy 3D IC and 2.5D IC Packaging Market by End User, 2023 - 2029, USD Million
- TABLE 199 Italy 3D IC and 2.5D IC Packaging Market by Application, 2019 - 2022, USD Million
- TABLE 200 Italy 3D IC and 2.5D IC Packaging Market by Application, 2023 - 2029, USD Million
- TABLE 201 Rest of Europe 3D IC and 2.5D IC Packaging Market, 2019 - 2022, USD Million
- TABLE 202 Rest of Europe 3D IC and 2.5D IC Packaging Market, 2023 - 2029, USD Million
- TABLE 203 Rest of Europe 3D IC and 2.5D IC Packaging Market by Packaging Technology, 2019 - 2022, USD Million
- TABLE 204 Rest of Europe 3D IC and 2.5D IC Packaging Market by Packaging Technology, 2023 - 2029, USD Million
- TABLE 205 Rest of Europe 3D IC and 2.5D IC Packaging Market by End User, 2019 - 2022, USD Million
- TABLE 206 Rest of Europe 3D IC and 2.5D IC Packaging Market by End User, 2023 - 2029, USD Million
- TABLE 207 Rest of Europe 3D IC and 2.5D IC Packaging Market by Application, 2019 - 2022, USD Million
- TABLE 208 Rest of Europe 3D IC and 2.5D IC Packaging Market by Application, 2023 - 2029, USD Million
- TABLE 209 Asia Pacific 3D IC and 2.5D IC Packaging Market, 2019 - 2022, USD Million
- TABLE 210 Asia Pacific 3D IC and 2.5D IC Packaging Market, 2023 - 2029, USD Million
- TABLE 211 Asia Pacific 3D IC and 2.5D IC Packaging Market by Packaging Technology, 2019 - 2022, USD Million
- TABLE 212 Asia Pacific 3D IC and 2.5D IC Packaging Market by Packaging Technology, 2023 - 2029, USD Million
- TABLE 213 Asia Pacific 2.5D Market by Country, 2019 - 2022, USD Million
- TABLE 214 Asia Pacific 2.5D Market by Country, 2023 - 2029, USD Million
- TABLE 215 Asia Pacific 3D wafer-level chip-scale packaging (WLCSP) Market by Country, 2019 - 2022, USD Million
- TABLE 216 Asia Pacific 3D wafer-level chip-scale packaging (WLCSP) Market by Country, 2023 - 2029, USD Million
- TABLE 217 Asia Pacific 3D Through-silicon via (TSV) Market by Country, 2019 - 2022, USD Million
- TABLE 218 Asia Pacific 3D Through-silicon via (TSV) Market by Country, 2023 - 2029, USD Million
- TABLE 219 Asia Pacific 3D IC and 2.5D IC Packaging Market by End User, 2019 - 2022, USD Million
- TABLE 220 Asia Pacific 3D IC and 2.5D IC Packaging Market by End User, 2023 - 2029, USD Million
- TABLE 221 Asia Pacific Consumer Electronics Market by Country, 2019 - 2022, USD Million
- TABLE 222 Asia Pacific Consumer Electronics Market by Country, 2023 - 2029, USD Million
- TABLE 223 Asia Pacific Automotive Market by Country, 2019 - 2022, USD Million
- TABLE 224 Asia Pacific Automotive Market by Country, 2023 - 2029, USD Million
- TABLE 225 Asia Pacific Industrial Market by Country, 2019 - 2022, USD Million
- TABLE 226 Asia Pacific Industrial Market by Country, 2023 - 2029, USD Million
- TABLE 227 Asia Pacific Military & Aerospace Market by Country, 2019 - 2022, USD Million
- TABLE 228 Asia Pacific Military & Aerospace Market by Country, 2023 - 2029, USD Million
- TABLE 229 Asia Pacific Telecommunications Market by Country, 2019 - 2022, USD Million
- TABLE 230 Asia Pacific Telecommunications Market by Country, 2023 - 2029, USD Million
- TABLE 231 Asia Pacific Medical Devices & Others Market by Country, 2019 - 2022, USD Million
- TABLE 232 Asia Pacific Medical Devices & Others Market by Country, 2023 - 2029, USD Million
- TABLE 233 Asia Pacific 3D IC and 2.5D IC Packaging Market by Application, 2019 - 2022, USD Million
- TABLE 234 Asia Pacific 3D IC and 2.5D IC Packaging Market by Application, 2023 - 2029, USD Million
- TABLE 235 Asia Pacific Memory Market by Country, 2019 - 2022, USD Million
- TABLE 236 Asia Pacific Memory Market by Country, 2023 - 2029, USD Million
- TABLE 237 Asia Pacific Imaging & Optoelectronics Market by Country, 2019 - 2022, USD Million
- TABLE 238 Asia Pacific Imaging & Optoelectronics Market by Country, 2023 - 2029, USD Million
- TABLE 239 Asia Pacific MEMS/Sensors Market by Country, 2019 - 2022, USD Million
- TABLE 240 Asia Pacific MEMS/Sensors Market by Country, 2023 - 2029, USD Million
- TABLE 241 Asia Pacific Logic Market by Country, 2019 - 2022, USD Million
- TABLE 242 Asia Pacific Logic Market by Country, 2023 - 2029, USD Million
- TABLE 243 Asia Pacific LED Market by Country, 2019 - 2022, USD Million
- TABLE 244 Asia Pacific LED Market by Country, 2023 - 2029, USD Million
- TABLE 245 Asia Pacific Others Market by Country, 2019 - 2022, USD Million
- TABLE 246 Asia Pacific Others Market by Country, 2023 - 2029, USD Million
- TABLE 247 Asia Pacific 3D IC and 2.5D IC Packaging Market by Country, 2019 - 2022, USD Million
- TABLE 248 Asia Pacific 3D IC and 2.5D IC Packaging Market by Country, 2023 - 2029, USD Million
- TABLE 249 China 3D IC and 2.5D IC Packaging Market, 2019 - 2022, USD Million
- TABLE 250 China 3D IC and 2.5D IC Packaging Market, 2023 - 2029, USD Million
- TABLE 251 China 3D IC and 2.5D IC Packaging Market by Packaging Technology, 2019 - 2022, USD Million
- TABLE 252 China 3D IC and 2.5D IC Packaging Market by Packaging Technology, 2023 - 2029, USD Million
- TABLE 253 China 3D IC and 2.5D IC Packaging Market by End User, 2019 - 2022, USD Million
- TABLE 254 China 3D IC and 2.5D IC Packaging Market by End User, 2023 - 2029, USD Million
- TABLE 255 China 3D IC and 2.5D IC Packaging Market by Application, 2019 - 2022, USD Million
- TABLE 256 China 3D IC and 2.5D IC Packaging Market by Application, 2023 - 2029, USD Million
- TABLE 257 Japan 3D IC and 2.5D IC Packaging Market, 2019 - 2022, USD Million
- TABLE 258 Japan 3D IC and 2.5D IC Packaging Market, 2023 - 2029, USD Million
- TABLE 259 Japan 3D IC and 2.5D IC Packaging Market by Packaging Technology, 2019 - 2022, USD Million
- TABLE 260 Japan 3D IC and 2.5D IC Packaging Market by Packaging Technology, 2023 - 2029, USD Million
- TABLE 261 Japan 3D IC and 2.5D IC Packaging Market by End User, 2019 - 2022, USD Million
- TABLE 262 Japan 3D IC and 2.5D IC Packaging Market by End User, 2023 - 2029, USD Million
- TABLE 263 Japan 3D IC and 2.5D IC Packaging Market by Application, 2019 - 2022, USD Million
- TABLE 264 Japan 3D IC and 2.5D IC Packaging Market by Application, 2023 - 2029, USD Million
- TABLE 265 Taiwan 3D IC and 2.5D IC Packaging Market, 2019 - 2022, USD Million
- TABLE 266 Taiwan 3D IC and 2.5D IC Packaging Market, 2023 - 2029, USD Million
- TABLE 267 Taiwan 3D IC and 2.5D IC Packaging Market by Packaging Technology, 2019 - 2022, USD Million
- TABLE 268 Taiwan 3D IC and 2.5D IC Packaging Market by Packaging Technology, 2023 - 2029, USD Million
- TABLE 269 Taiwan 3D IC and 2.5D IC Packaging Market by End User, 2019 - 2022, USD Million
- TABLE 270 Taiwan 3D IC and 2.5D IC Packaging Market by End User, 2023 - 2029, USD Million
- TABLE 271 Taiwan 3D IC and 2.5D IC Packaging Market by Application, 2019 - 2022, USD Million
- TABLE 272 Taiwan 3D IC and 2.5D IC Packaging Market by Application, 2023 - 2029, USD Million
- TABLE 273 India 3D IC and 2.5D IC Packaging Market, 2019 - 2022, USD Million
- TABLE 274 India 3D IC and 2.5D IC Packaging Market, 2023 - 2029, USD Million
- TABLE 275 India 3D IC and 2.5D IC Packaging Market by Packaging Technology, 2019 - 2022, USD Million
- TABLE 276 India 3D IC and 2.5D IC Packaging Market by Packaging Technology, 2023 - 2029, USD Million
- TABLE 277 India 3D IC and 2.5D IC Packaging Market by End User, 2019 - 2022, USD Million
- TABLE 278 India 3D IC and 2.5D IC Packaging Market by End User, 2023 - 2029, USD Million
- TABLE 279 India 3D IC and 2.5D IC Packaging Market by Application, 2019 - 2022, USD Million
- TABLE 280 India 3D IC and 2.5D IC Packaging Market by Application, 2023 - 2029, USD Million
- TABLE 281 South Korea 3D IC and 2.5D IC Packaging Market, 2019 - 2022, USD Million
- TABLE 282 South Korea 3D IC and 2.5D IC Packaging Market, 2023 - 2029, USD Million
- TABLE 283 South Korea 3D IC and 2.5D IC Packaging Market by Packaging Technology, 2019 - 2022, USD Million
- TABLE 284 South Korea 3D IC and 2.5D IC Packaging Market by Packaging Technology, 2023 - 2029, USD Million
- TABLE 285 South Korea 3D IC and 2.5D IC Packaging Market by End User, 2019 - 2022, USD Million
- TABLE 286 South Korea 3D IC and 2.5D IC Packaging Market by End User, 2023 - 2029, USD Million
- TABLE 287 South Korea 3D IC and 2.5D IC Packaging Market by Application, 2019 - 2022, USD Million
- TABLE 288 South Korea 3D IC and 2.5D IC Packaging Market by Application, 2023 - 2029, USD Million
- TABLE 289 Singapore 3D IC and 2.5D IC Packaging Market, 2019 - 2022, USD Million
- TABLE 290 Singapore 3D IC and 2.5D IC Packaging Market, 2023 - 2029, USD Million
- TABLE 291 Singapore 3D IC and 2.5D IC Packaging Market by Packaging Technology, 2019 - 2022, USD Million
- TABLE 292 Singapore 3D IC and 2.5D IC Packaging Market by Packaging Technology, 2023 - 2029, USD Million
- TABLE 293 Singapore 3D IC and 2.5D IC Packaging Market by End User, 2019 - 2022, USD Million
- TABLE 294 Singapore 3D IC and 2.5D IC Packaging Market by End User, 2023 - 2029, USD Million
- TABLE 295 Singapore 3D IC and 2.5D IC Packaging Market by Application, 2019 - 2022, USD Million
- TABLE 296 Singapore 3D IC and 2.5D IC Packaging Market by Application, 2023 - 2029, USD Million
- TABLE 297 Rest of Asia Pacific 3D IC and 2.5D IC Packaging Market, 2019 - 2022, USD Million
- TABLE 298 Rest of Asia Pacific 3D IC and 2.5D IC Packaging Market, 2023 - 2029, USD Million
- TABLE 299 Rest of Asia Pacific 3D IC and 2.5D IC Packaging Market by Packaging Technology, 2019 - 2022, USD Million
- TABLE 300 Rest of Asia Pacific 3D IC and 2.5D IC Packaging Market by Packaging Technology, 2023 - 2029, USD Million
- TABLE 301 Rest of Asia Pacific 3D IC and 2.5D IC Packaging Market by End User, 2019 - 2022, USD Million
- TABLE 302 Rest of Asia Pacific 3D IC and 2.5D IC Packaging Market by End User, 2023 - 2029, USD Million
- TABLE 303 Rest of Asia Pacific 3D IC and 2.5D IC Packaging Market by Application, 2019 - 2022, USD Million
- TABLE 304 Rest of Asia Pacific 3D IC and 2.5D IC Packaging Market by Application, 2023 - 2029, USD Million
- TABLE 305 LAMEA 3D IC and 2.5D IC Packaging Market, 2019 - 2022, USD Million
- TABLE 306 LAMEA 3D IC and 2.5D IC Packaging Market, 2023 - 2029, USD Million
- TABLE 307 LAMEA 3D IC and 2.5D IC Packaging Market by Packaging Technology, 2019 - 2022, USD Million
- TABLE 308 LAMEA 3D IC and 2.5D IC Packaging Market by Packaging Technology, 2023 - 2029, USD Million
- TABLE 309 LAMEA 2.5D Market by Country, 2019 - 2022, USD Million
- TABLE 310 LAMEA 2.5D Market by Country, 2023 - 2029, USD Million
- TABLE 311 LAMEA 3D wafer-level chip-scale packaging (WLCSP) Market by Country, 2019 - 2022, USD Million
- TABLE 312 LAMEA 3D wafer-level chip-scale packaging (WLCSP) Market by Country, 2023 - 2029, USD Million
- TABLE 313 LAMEA 3D Through-silicon via (TSV) Market by Country, 2019 - 2022, USD Million
- TABLE 314 LAMEA 3D Through-silicon via (TSV) Market by Country, 2023 - 2029, USD Million
- TABLE 315 LAMEA 3D IC and 2.5D IC Packaging Market by End User, 2019 - 2022, USD Million
- TABLE 316 LAMEA 3D IC and 2.5D IC Packaging Market by End User, 2023 - 2029, USD Million
- TABLE 317 LAMEA Consumer Electronics Market by Country, 2019 - 2022, USD Million
- TABLE 318 LAMEA Consumer Electronics Market by Country, 2023 - 2029, USD Million
- TABLE 319 LAMEA Automotive Market by Country, 2019 - 2022, USD Million
- TABLE 320 LAMEA Automotive Market by Country, 2023 - 2029, USD Million
- TABLE 321 LAMEA Industrial Market by Country, 2019 - 2022, USD Million
- TABLE 322 LAMEA Industrial Market by Country, 2023 - 2029, USD Million
- TABLE 323 LAMEA Military & Aerospace Market by Country, 2019 - 2022, USD Million
- TABLE 324 LAMEA Military & Aerospace Market by Country, 2023 - 2029, USD Million
- TABLE 325 LAMEA Telecommunications Market by Country, 2019 - 2022, USD Million
- TABLE 326 LAMEA Telecommunications Market by Country, 2023 - 2029, USD Million
- TABLE 327 LAMEA Others Market by Country, 2019 - 2022, USD Million
- TABLE 328 LAMEA Others Market by Country, 2023 - 2029, USD Million
- TABLE 329 LAMEA 3D IC and 2.5D IC Packaging Market by Application, 2019 - 2022, USD Million
- TABLE 330 LAMEA 3D IC and 2.5D IC Packaging Market by Application, 2023 - 2029, USD Million
- TABLE 331 LAMEA Memory Market by Country, 2019 - 2022, USD Million
- TABLE 332 LAMEA Memory Market by Country, 2023 - 2029, USD Million
- TABLE 333 LAMEA Imaging & Optoelectronics Market by Country, 2019 - 2022, USD Million
- TABLE 334 LAMEA Imaging & Optoelectronics Market by Country, 2023 - 2029, USD Million
- TABLE 335 LAMEA MEMS/Sensors Market by Country, 2019 - 2022, USD Million
- TABLE 336 LAMEA MEMS/Sensors Market by Country, 2023 - 2029, USD Million
- TABLE 337 LAMEA Logic Market by Country, 2019 - 2022, USD Million
- TABLE 338 LAMEA Logic Market by Country, 2023 - 2029, USD Million
- TABLE 339 LAMEA LED Market by Country, 2019 - 2022, USD Million
- TABLE 340 LAMEA LED Market by Country, 2023 - 2029, USD Million
- TABLE 341 LAMEA Others Market by Country, 2019 - 2022, USD Million
- TABLE 342 LAMEA Others Market by Country, 2023 - 2029, USD Million
- TABLE 343 LAMEA 3D IC and 2.5D IC Packaging Market by Country, 2019 - 2022, USD Million
- TABLE 344 LAMEA 3D IC and 2.5D IC Packaging Market by Country, 2023 - 2029, USD Million
- TABLE 345 Brazil 3D IC and 2.5D IC Packaging Market, 2019 - 2022, USD Million
- TABLE 346 Brazil 3D IC and 2.5D IC Packaging Market, 2023 - 2029, USD Million
- TABLE 347 Brazil 3D IC and 2.5D IC Packaging Market by Packaging Technology, 2019 - 2022, USD Million
- TABLE 348 Brazil 3D IC and 2.5D IC Packaging Market by Packaging Technology, 2023 - 2029, USD Million
- TABLE 349 Brazil 3D IC and 2.5D IC Packaging Market by End User, 2019 - 2022, USD Million
- TABLE 350 Brazil 3D IC and 2.5D IC Packaging Market by End User, 2023 - 2029, USD Million
- TABLE 351 Brazil 3D IC and 2.5D IC Packaging Market by Application, 2019 - 2022, USD Million
- TABLE 352 Brazil 3D IC and 2.5D IC Packaging Market by Application, 2023 - 2029, USD Million
- TABLE 353 Argentina 3D IC and 2.5D IC Packaging Market, 2019 - 2022, USD Million
- TABLE 354 Argentina 3D IC and 2.5D IC Packaging Market, 2023 - 2029, USD Million
- TABLE 355 Argentina 3D IC and 2.5D IC Packaging Market by Packaging Technology, 2019 - 2022, USD Million
- TABLE 356 Argentina 3D IC and 2.5D IC Packaging Market by Packaging Technology, 2023 - 2029, USD Million
- TABLE 357 Argentina 3D IC and 2.5D IC Packaging Market by End User, 2019 - 2022, USD Million
- TABLE 358 Argentina 3D IC and 2.5D IC Packaging Market by End User, 2023 - 2029, USD Million
- TABLE 359 Argentina 3D IC and 2.5D IC Packaging Market by Application, 2019 - 2022, USD Million
- TABLE 360 Argentina 3D IC and 2.5D IC Packaging Market by Application, 2023 - 2029, USD Million
- TABLE 361 UAE 3D IC and 2.5D IC Packaging Market, 2019 - 2022, USD Million
- TABLE 362 UAE 3D IC and 2.5D IC Packaging Market, 2023 - 2029, USD Million
- TABLE 363 UAE 3D IC and 2.5D IC Packaging Market by Packaging Technology, 2019 - 2022, USD Million
- TABLE 364 UAE 3D IC and 2.5D IC Packaging Market by Packaging Technology, 2023 - 2029, USD Million
- TABLE 365 UAE 3D IC and 2.5D IC Packaging Market by End User, 2019 - 2022, USD Million
- TABLE 366 UAE 3D IC and 2.5D IC Packaging Market by End User, 2023 - 2029, USD Million
- TABLE 367 UAE 3D IC and 2.5D IC Packaging Market by Application, 2019 - 2022, USD Million
- TABLE 368 UAE 3D IC and 2.5D IC Packaging Market by Application, 2023 - 2029, USD Million
- TABLE 369 Saudi Arabia 3D IC and 2.5D IC Packaging Market, 2019 - 2022, USD Million
- TABLE 370 Saudi Arabia 3D IC and 2.5D IC Packaging Market, 2023 - 2029, USD Million
- TABLE 371 Saudi Arabia 3D IC and 2.5D IC Packaging Market by Packaging Technology, 2019 - 2022, USD Million
- TABLE 372 Saudi Arabia 3D IC and 2.5D IC Packaging Market by Packaging Technology, 2023 - 2029, USD Million
- TABLE 373 Saudi Arabia 3D IC and 2.5D IC Packaging Market by End User, 2019 - 2022, USD Million
- TABLE 374 Saudi Arabia 3D IC and 2.5D IC Packaging Market by End User, 2023 - 2029, USD Million
- TABLE 375 Saudi Arabia 3D IC and 2.5D IC Packaging Market by Application, 2019 - 2022, USD Million
- TABLE 376 Saudi Arabia 3D IC and 2.5D IC Packaging Market by Application, 2023 - 2029, USD Million
- TABLE 377 South Africa 3D IC and 2.5D IC Packaging Market, 2019 - 2022, USD Million
- TABLE 378 South Africa 3D IC and 2.5D IC Packaging Market, 2023 - 2029, USD Million
- TABLE 379 South Africa 3D IC and 2.5D IC Packaging Market by Packaging Technology, 2019 - 2022, USD Million
- TABLE 380 South Africa 3D IC and 2.5D IC Packaging Market by Packaging Technology, 2023 - 2029, USD Million
- TABLE 381 South Africa 3D IC and 2.5D IC Packaging Market by End User, 2019 - 2022, USD Million
- TABLE 382 South Africa 3D IC and 2.5D IC Packaging Market by End User, 2023 - 2029, USD Million
- TABLE 383 South Africa 3D IC and 2.5D IC Packaging Market by Application, 2019 - 2022, USD Million
- TABLE 384 South Africa 3D IC and 2.5D IC Packaging Market by Application, 2023 - 2029, USD Million
- TABLE 385 Nigeria 3D IC and 2.5D IC Packaging Market, 2019 - 2022, USD Million
- TABLE 386 Nigeria 3D IC and 2.5D IC Packaging Market, 2023 - 2029, USD Million
- TABLE 387 Nigeria 3D IC and 2.5D IC Packaging Market by Packaging Technology, 2019 - 2022, USD Million
- TABLE 388 Nigeria 3D IC and 2.5D IC Packaging Market by Packaging Technology, 2023 - 2029, USD Million
- TABLE 389 Nigeria 3D IC and 2.5D IC Packaging Market by End User, 2019 - 2022, USD Million
- TABLE 390 Nigeria 3D IC and 2.5D IC Packaging Market by End User, 2023 - 2029, USD Million
- TABLE 391 Nigeria 3D IC and 2.5D IC Packaging Market by Application, 2019 - 2022, USD Million
- TABLE 392 Nigeria 3D IC and 2.5D IC Packaging Market by Application, 2023 - 2029, USD Million
- TABLE 393 Rest of LAMEA 3D IC and 2.5D IC Packaging Market, 2019 - 2022, USD Million
- TABLE 394 Rest of LAMEA 3D IC and 2.5D IC Packaging Market, 2023 - 2029, USD Million
- TABLE 395 Rest of LAMEA 3D IC and 2.5D IC Packaging Market by Packaging Technology, 2019 - 2022, USD Million
- TABLE 396 Rest of LAMEA 3D IC and 2.5D IC Packaging Market by Packaging Technology, 2023 - 2029, USD Million
- TABLE 397 Rest of LAMEA 3D IC and 2.5D IC Packaging Market by End User, 2019 - 2022, USD Million
- TABLE 398 Rest of LAMEA 3D IC and 2.5D IC Packaging Market by End User, 2023 - 2029, USD Million
- TABLE 399 Rest of LAMEA 3D IC and 2.5D IC Packaging Market by Application, 2019 - 2022, USD Million
- TABLE 400 Rest of LAMEA 3D IC and 2.5D IC Packaging Market by Application, 2023 - 2029, USD Million
- TABLE 401 Key Information - Samsung Electronics Co., Ltd.
- TABLE 402 Key Information- Taiwan Semiconductor Manufacturing Company Limited
- TABLE 403 Key Information - Intel Corporation
- TABLE 404 Key Information - ASE Group
- TABLE 405 Key Information - Amkor Technology, Inc.
- TABLE 406 Key Information - Broadcom, Inc.
- TABLE 407 Key Information - Texas Instruments, Inc.
- TABLE 408 Key Information - JCET Group
- TABLE 409 Key Information - Powertech Technology Inc.
- TABLE 410 Key Information - United Microelectronics Corporation
List of Figures
- FIG 1 Methodology for the research
- FIG 2 Market Share Analysis, 2022
- FIG 3 Global 3D IC and 2.5D IC Packaging Market share by Packaging Technology, 2022
- FIG 4 Global 3D IC and 2.5D IC Packaging Market share by Packaging Technology, 2029
- FIG 5 Global 3D IC and 2.5D IC Packaging Market by Packaging Technology, 2019 - 2029, USD Million
- FIG 6 Global 3D IC and 2.5D IC Packaging Market share by End User, 2022
- FIG 7 Global 3D IC and 2.5D IC Packaging Market share by End User, 2029
- FIG 8 Global 3D IC and 2.5D IC Packaging Market by End User, 2019 - 2029, USD Million
- FIG 9 Global 3D IC and 2.5D IC Packaging Market share by Application, 2022
- FIG 10 Global 3D IC and 2.5D IC Packaging Market share by Application, 2029
- FIG 11 Global 3D IC and 2.5D IC Packaging Market by Application, 2019 - 2029, USD Million
- FIG 12 Global 3D IC and 2.5D IC Packaging Market share by Region, 2022
- FIG 13 Global 3D IC and 2.5D IC Packaging Market share by Region, 2029
- FIG 14 Global 3D IC and 2.5D IC Packaging Market by Region, 2019 - 2029, USD Million
- FIG 15 SWOT Analysis: Samsung Electronics CO. Ltd.
- FIG 16 SWOT analysis: Intel corporation
- FIG 17 SWOT Analysis: Broadcom, Inc.
The Global 3D IC and 2.5D IC Packaging Market size is expected to reach $83 billion by 2029, rising at a market growth of 10.1% CAGR during the forecast period.
The logic segment is the growing application of 3D IC and 2.5D IC Packaging due to the expansion of smart city projects worldwide, growing safety concerns, and rising demand for improved high-level access control systems. For example, the Indian government invested a large amount of money to create 100 smart cities from existing ones. The United States government also pledged to invest in technology for smart cities in 2016. It is therefore expected that smart city projects will aid in the growth of the IoT industry in these locations. The creation and application of technology for smart cities can benefit greatly from using 3D IC packaging. These systems and devices can be made smaller, more powerful, and energy-efficient by utilizing 3D IC packaging. Some of the factors impacting the market are increasing demand for gaming devices and consumer electronics, growing industry-wide use of semiconductor devices, and higher level of integration-related thermal problems along with reliability challenges.
E-book readers, tablet computers, gaming devices, 3D smart glass, virtual reality, and augmented reality goods are just a few examples of the many new types of consumer electronics that are becoming available on the market due to recent developments in technology. Therefore, the rapidly increasing demand for these ICs is aiding in expanding the market throughout the forecast period. Advanced semiconductor devices are required to offer a variety of new capabilities due to rising digitization, expanding patterns of remote operations, and remote work. Therefore, all these elements are developing the market. However, High-density multi-level assembly per unit footprint is offered by 3D IC. This is appealing for numerous applications where downsizing is required, but it also poses problems for thermal management because increasing integration raises the on-chip temperature. Hence, all these elements may lead to slowed market growth.
Packaging Technology Outlook
Based on packaging technology, the market is characterized into 3D wafer-level chip-scale packaging (WLCSP), 3D through-silicon via (TSV), and 2.5D. The 3D wafer-level chip-scale packaging (WLCSP) segment procured a considerable growth rate in the market in 2022. 3D WLCSP is one of the most compact package options, offering greater functionality and better thermal performance in most PCBs or printed circuit boards. Using polymers that can withstand high temperatures, 3D WLCSP offers a simplified process architecture for producing 3D ICs, overcoming the thermal issue.
Application Outlook
On the basis of application, the market is classified into logic, imaging & optoelectronics, memory, MEMS/Sensors, LED, and others. The MEMS/sensors segment recorded a significant revenue share in the market in 2022. Microactuators, microsensors, and microelectronics are the functional parts of MEMS. Among other things, MEMS' cutting-edge components include gyroscopes, digital compasses, accelerometers, inertial modules, humidity sensors, microphones, pressure sensors, and smart sensors. All of these components and sensors must have a structure that has been reduced in size.
End User Outlook
By end user, the market is divided into consumer electronics, industrial, telecommunications, automotive, military & aerospace, medical devices, and others. The telecommunications segment procured a remarkable growth rate in the market in 2022. 3D ICs and 2.5D ICs offer significant benefits for telecommunications applications, including higher performance, lower power consumption, space savings, improved thermal performance, and better signal integrity. These advantages make them an attractive option for telecommunication device designers and manufacturers. 3D IC and 2.5D IC packaging enable the integration of multiple components in a smaller form factor, making them ideal for applications where space is limited, such as in mobile devices.
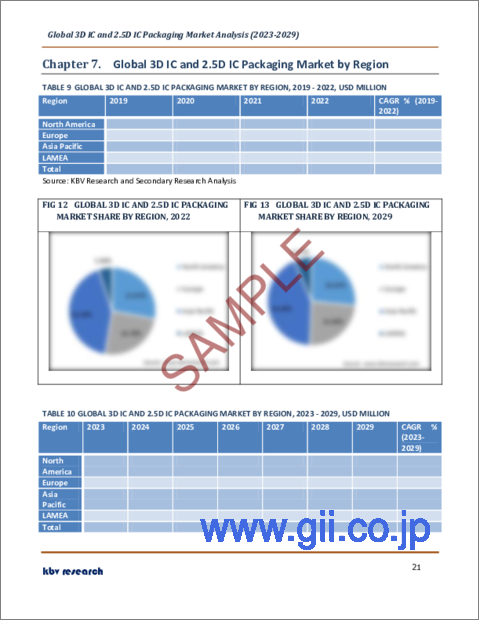
Regional Outlook
Region wise, the market is analyzed across North America, Europe, Asia Pacific, and LAMEA. The Asia Pacific segment recorded the highest revenue share in the market in 2022. Due to its wide range of consumer electronics uses, the Asia Pacific region is among the major markets. This is mostly due to the region's dense population, which makes it the four primary region with the highest potential market. Additionally, advancements and expansion of telecommunication and automotive sectors are also increasingly using ICs.
The market research report covers the analysis of key stake holders of the market. Key companies profiled in the report include Samsung Electronics Co., Ltd., Taiwan Semiconductor Manufacturing Company Limited, Intel Corporation, ASE Group (ASE Technology Holding Co., Ltd.), Amkor Technology, Inc., Broadcom, Inc., Texas Instruments, Inc., JCET Group, Powertech Technology, Inc. and United Microelectronics Corporation.
Scope of the Study
Market Segments covered in the Report:
By Packaging Technology
- 2.5D
- 3D wafer-level chip-scale packaging (WLCSP)
- 3D Through-silicon via (TSV)
By End User
- Consumer Electronics
- Automotive
- Industrial
- Military & Aerospace
- Telecommunications
- Medical Devices & Others
By Application
- Memory
- Imaging & Optoelectronics
- MEMS/Sensors
- Logic
- LED
- Others
By Geography
- North America
- US
- Canada
- Mexico
- Rest of North America
- Europe
- Germany
- UK
- France
- Russia
- Spain
- Italy
- Rest of Europe
- Asia Pacific
- China
- Japan
- Taiwan
- India
- South Korea
- Singapore
- Rest of Asia Pacific
- LAMEA
- Brazil
- Argentina
- UAE
- Saudi Arabia
- South Africa
- Nigeria
- Rest of LAMEA
Companies Profiled
- Samsung Electronics Co., Ltd.
- Taiwan Semiconductor Manufacturing Company Limited
- Intel Corporation
- ASE Group (ASE Technology Holding Co., Ltd.)
- Amkor Technology, Inc.
- Broadcom, Inc.
- Texas Instruments, Inc.
- JCET Group
- Powertech Technology, Inc.
- United Microelectronics Corporation
Unique Offerings from KBV Research
- Exhaustive coverage
- Highest number of market tables and figures
- Subscription based model available
- Guaranteed best price
- Assured post sales research support with 10% customization free
Table of Contents
Chapter 1. Market Scope & Methodology
- 1.1 Market Definition
- 1.2 Objectives
- 1.3 Market Scope
- 1.4 Segmentation
- 1.4.1 Global 3D IC and 2.5D IC Packaging Market, by Packaging Technology
- 1.4.2 Global 3D IC and 2.5D IC Packaging Market, by End User
- 1.4.3 Global 3D IC and 2.5D IC Packaging Market, by Application
- 1.4.4 Global 3D IC and 2.5D IC Packaging Market, by Geography
- 1.5 Methodology for the research
Chapter 2. Market Overview
- 2.1 Introduction
- 2.1.1 Overview
- 2.1.1.1 Market Composition & Scenario
- 2.1.1 Overview
- 2.2 Key Factors Impacting the Market
- 2.2.1 Market Drivers
- 2.2.2 Market Restraints
Chapter 3. Competition Analysis - Global
- 3.1 Market Share Analysis, 2022
Chapter 4. Global 3D IC and 2.5D IC Packaging Market by Packaging Technology
- 4.1 Global 2.5D Market by Region
- 4.2 Global 3D wafer-level chip-scale packaging (WLCSP) Market by Region
- 4.3 Global 3D Through-silicon via (TSV) Market by Region
Chapter 5. Global 3D IC and 2.5D IC Packaging Market by End User
- 5.1 Global Consumer Electronics Market by Region
- 5.2 Global Automotive Market by Region
- 5.3 Global Industrial Market by Region
- 5.4 Global Military & Aerospace Market by Region
- 5.5 Global Telecommunications Market by Region
- 5.6 Global Medical Devices & Others Market by Region
Chapter 6. Global 3D IC and 2.5D IC Packaging Market by Application
- 6.1 Global Memory Market by Region
- 6.2 Global Imaging & Optoelectronics Market by Region
- 6.3 Global MEMS/Sensors Market by Region
- 6.4 Global Logic Market by Region
- 6.5 Global LED Market by Region
- 6.6 Global Others Market by Region
Chapter 7. Global 3D IC and 2.5D IC Packaging Market by Region
- 7.1 North America 3D IC and 2.5D IC Packaging Market
- 7.1.1 North America 3D IC and 2.5D IC Packaging Market by Packaging Technology
- 7.1.1.1 North America 2.5D Market by Country
- 7.1.1.2 North America 3D wafer-level chip-scale packaging (WLCSP) Market by Country
- 7.1.1.3 North America 3D Through-silicon via (TSV) Market by Country
- 7.1.2 North America 3D IC and 2.5D IC Packaging Market by End User
- 7.1.2.1 North America Consumer Electronics Market by Country
- 7.1.2.2 North America Automotive Market by Country
- 7.1.2.3 North America Industrial Market by Country
- 7.1.2.4 North America Military & Aerospace Market by Country
- 7.1.2.5 North America Telecommunications Market by Country
- 7.1.2.6 North America Medical Devices & Others Market by Country
- 7.1.3 North America 3D IC and 2.5D IC Packaging Market by Application
- 7.1.3.1 North America Memory Market by Country
- 7.1.3.2 North America Imaging & Optoelectronics Market by Country
- 7.1.3.3 North America MEMS/Sensors Market by Country
- 7.1.3.4 North America Logic Market by Country
- 7.1.3.5 North America LED Market by Country
- 7.1.3.6 North America Others Market by Country
- 7.1.4 North America 3D IC and 2.5D IC Packaging Market by Country
- 7.1.4.1 US 3D IC and 2.5D IC Packaging Market
- 7.1.4.1.1 US 3D IC and 2.5D IC Packaging Market by Packaging Technology
- 7.1.4.1.2 US 3D IC and 2.5D IC Packaging Market by End User
- 7.1.4.1.3 US 3D IC and 2.5D IC Packaging Market by Application
- 7.1.4.2 Canada 3D IC and 2.5D IC Packaging Market
- 7.1.4.2.1 Canada 3D IC and 2.5D IC Packaging Market by Packaging Technology
- 7.1.4.2.2 Canada 3D IC and 2.5D IC Packaging Market by End User
- 7.1.4.2.3 Canada 3D IC and 2.5D IC Packaging Market by Application
- 7.1.4.3 Mexico 3D IC and 2.5D IC Packaging Market
- 7.1.4.3.1 Mexico 3D IC and 2.5D IC Packaging Market by Packaging Technology
- 7.1.4.3.2 Mexico 3D IC and 2.5D IC Packaging Market by End User
- 7.1.4.3.3 Mexico 3D IC and 2.5D IC Packaging Market by Application
- 7.1.4.4 Rest of North America 3D IC and 2.5D IC Packaging Market
- 7.1.4.4.1 Rest of North America 3D IC and 2.5D IC Packaging Market by Packaging Technology
- 7.1.4.4.2 Rest of North America 3D IC and 2.5D IC Packaging Market by End User
- 7.1.4.4.3 Rest of North America 3D IC and 2.5D IC Packaging Market by Application
- 7.1.4.1 US 3D IC and 2.5D IC Packaging Market
- 7.1.1 North America 3D IC and 2.5D IC Packaging Market by Packaging Technology
- 7.2 Europe 3D IC and 2.5D IC Packaging Market
- 7.2.1 Europe 3D IC and 2.5D IC Packaging Market by Packaging Technology
- 7.2.1.1 Europe 2.5D Market by Country
- 7.2.1.2 Europe 3D wafer-level chip-scale packaging (WLCSP) Market by Country
- 7.2.1.3 Europe 3D Through-silicon via (TSV) Market by Country
- 7.2.2 Europe 3D IC and 2.5D IC Packaging Market by End User
- 7.2.2.1 Europe Consumer Electronics Market by Country
- 7.2.2.2 Europe Automotive Market by Country
- 7.2.2.3 Europe Industrial Market by Country
- 7.2.2.4 Europe Military & Aerospace Market by Country
- 7.2.2.5 Europe Telecommunications Market by Country
- 7.2.2.6 Europe Medical Devices & Others Market by Country
- 7.2.3 Europe 3D IC and 2.5D IC Packaging Market by Application
- 7.2.3.1 Europe Memory Market by Country
- 7.2.3.2 Europe Imaging & Optoelectronics Market by Country
- 7.2.3.3 Europe MEMS/Sensors Market by Country
- 7.2.3.4 Europe Logic Market by Country
- 7.2.3.5 Europe LED Market by Country
- 7.2.3.6 Europe Others Market by Country
- 7.2.4 Europe 3D IC and 2.5D IC Packaging Market by Country
- 7.2.4.1 Germany 3D IC and 2.5D IC Packaging Market
- 7.2.4.1.1 Germany 3D IC and 2.5D IC Packaging Market by Packaging Technology
- 7.2.4.1.2 Germany 3D IC and 2.5D IC Packaging Market by End User
- 7.2.4.1.3 Germany 3D IC and 2.5D IC Packaging Market by Application
- 7.2.4.2 UK 3D IC and 2.5D IC Packaging Market
- 7.2.4.2.1 UK 3D IC and 2.5D IC Packaging Market by Packaging Technology
- 7.2.4.2.2 UK 3D IC and 2.5D IC Packaging Market by End User
- 7.2.4.2.3 UK 3D IC and 2.5D IC Packaging Market by Application
- 7.2.4.3 France 3D IC and 2.5D IC Packaging Market
- 7.2.4.3.1 France 3D IC and 2.5D IC Packaging Market by Packaging Technology
- 7.2.4.3.2 France 3D IC and 2.5D IC Packaging Market by End User
- 7.2.4.3.3 France 3D IC and 2.5D IC Packaging Market by Application
- 7.2.4.4 Russia 3D IC and 2.5D IC Packaging Market
- 7.2.4.4.1 Russia 3D IC and 2.5D IC Packaging Market by Packaging Technology
- 7.2.4.4.2 Russia 3D IC and 2.5D IC Packaging Market by End User
- 7.2.4.4.3 Russia 3D IC and 2.5D IC Packaging Market by Application
- 7.2.4.5 Spain 3D IC and 2.5D IC Packaging Market
- 7.2.4.5.1 Spain 3D IC and 2.5D IC Packaging Market by Packaging Technology
- 7.2.4.5.2 Spain 3D IC and 2.5D IC Packaging Market by End User
- 7.2.4.5.3 Spain 3D IC and 2.5D IC Packaging Market by Application
- 7.2.4.6 Italy 3D IC and 2.5D IC Packaging Market
- 7.2.4.6.1 Italy 3D IC and 2.5D IC Packaging Market by Packaging Technology
- 7.2.4.6.2 Italy 3D IC and 2.5D IC Packaging Market by End User
- 7.2.4.6.3 Italy 3D IC and 2.5D IC Packaging Market by Application
- 7.2.4.7 Rest of Europe 3D IC and 2.5D IC Packaging Market
- 7.2.4.7.1 Rest of Europe 3D IC and 2.5D IC Packaging Market by Packaging Technology
- 7.2.4.7.2 Rest of Europe 3D IC and 2.5D IC Packaging Market by End User
- 7.2.4.7.3 Rest of Europe 3D IC and 2.5D IC Packaging Market by Application
- 7.2.4.1 Germany 3D IC and 2.5D IC Packaging Market
- 7.2.1 Europe 3D IC and 2.5D IC Packaging Market by Packaging Technology
- 7.3 Asia Pacific 3D IC and 2.5D IC Packaging Market
- 7.3.1 Asia Pacific 3D IC and 2.5D IC Packaging Market by Packaging Technology
- 7.3.1.1 Asia Pacific 2.5D Market by Country
- 7.3.1.2 Asia Pacific 3D wafer-level chip-scale packaging (WLCSP) Market by Country
- 7.3.1.3 Asia Pacific 3D Through-silicon via (TSV) Market by Country
- 7.3.2 Asia Pacific 3D IC and 2.5D IC Packaging Market by End User
- 7.3.2.1 Asia Pacific Consumer Electronics Market by Country
- 7.3.2.2 Asia Pacific Automotive Market by Country
- 7.3.2.3 Asia Pacific Industrial Market by Country
- 7.3.2.4 Asia Pacific Military & Aerospace Market by Country
- 7.3.2.5 Asia Pacific Telecommunications Market by Country
- 7.3.2.6 Asia Pacific Medical Devices & Others Market by Country
- 7.3.3 Asia Pacific 3D IC and 2.5D IC Packaging Market by Application
- 7.3.3.1 Asia Pacific Memory Market by Country
- 7.3.3.2 Asia Pacific Imaging & Optoelectronics Market by Country
- 7.3.3.3 Asia Pacific MEMS/Sensors Market by Country
- 7.3.3.4 Asia Pacific Logic Market by Country
- 7.3.3.5 Asia Pacific LED Market by Country
- 7.3.3.6 Asia Pacific Others Market by Country
- 7.3.4 Asia Pacific 3D IC and 2.5D IC Packaging Market by Country
- 7.3.4.1 China 3D IC and 2.5D IC Packaging Market
- 7.3.4.1.1 China 3D IC and 2.5D IC Packaging Market by Packaging Technology
- 7.3.4.1.2 China 3D IC and 2.5D IC Packaging Market by End User
- 7.3.4.1.3 China 3D IC and 2.5D IC Packaging Market by Application
- 7.3.4.2 Japan 3D IC and 2.5D IC Packaging Market
- 7.3.4.2.1 Japan 3D IC and 2.5D IC Packaging Market by Packaging Technology
- 7.3.4.2.2 Japan 3D IC and 2.5D IC Packaging Market by End User
- 7.3.4.2.3 Japan 3D IC and 2.5D IC Packaging Market by Application
- 7.3.4.3 Taiwan 3D IC and 2.5D IC Packaging Market
- 7.3.4.3.1 Taiwan 3D IC and 2.5D IC Packaging Market by Packaging Technology
- 7.3.4.3.2 Taiwan 3D IC and 2.5D IC Packaging Market by End User
- 7.3.4.3.3 Taiwan 3D IC and 2.5D IC Packaging Market by Application
- 7.3.4.4 India 3D IC and 2.5D IC Packaging Market
- 7.3.4.4.1 India 3D IC and 2.5D IC Packaging Market by Packaging Technology
- 7.3.4.4.2 India 3D IC and 2.5D IC Packaging Market by End User
- 7.3.4.4.3 India 3D IC and 2.5D IC Packaging Market by Application
- 7.3.4.5 South Korea 3D IC and 2.5D IC Packaging Market
- 7.3.4.5.1 South Korea 3D IC and 2.5D IC Packaging Market by Packaging Technology
- 7.3.4.5.2 South Korea 3D IC and 2.5D IC Packaging Market by End User
- 7.3.4.5.3 South Korea 3D IC and 2.5D IC Packaging Market by Application
- 7.3.4.6 Singapore 3D IC and 2.5D IC Packaging Market
- 7.3.4.6.1 Singapore 3D IC and 2.5D IC Packaging Market by Packaging Technology
- 7.3.4.6.2 Singapore 3D IC and 2.5D IC Packaging Market by End User
- 7.3.4.6.3 Singapore 3D IC and 2.5D IC Packaging Market by Application
- 7.3.4.7 Rest of Asia Pacific 3D IC and 2.5D IC Packaging Market
- 7.3.4.7.1 Rest of Asia Pacific 3D IC and 2.5D IC Packaging Market by Packaging Technology
- 7.3.4.7.2 Rest of Asia Pacific 3D IC and 2.5D IC Packaging Market by End User
- 7.3.4.7.3 Rest of Asia Pacific 3D IC and 2.5D IC Packaging Market by Application
- 7.3.4.1 China 3D IC and 2.5D IC Packaging Market
- 7.3.1 Asia Pacific 3D IC and 2.5D IC Packaging Market by Packaging Technology
- 7.4 LAMEA 3D IC and 2.5D IC Packaging Market
- 7.4.1 LAMEA 3D IC and 2.5D IC Packaging Market by Packaging Technology
- 7.4.1.1 LAMEA 2.5D Market by Country
- 7.4.1.2 LAMEA 3D wafer-level chip-scale packaging (WLCSP) Market by Country
- 7.4.1.3 LAMEA 3D Through-silicon via (TSV) Market by Country
- 7.4.2 LAMEA 3D IC and 2.5D IC Packaging Market by End User
- 7.4.2.1 LAMEA Consumer Electronics Market by Country
- 7.4.2.2 LAMEA Automotive Market by Country
- 7.4.2.3 LAMEA Industrial Market by Country
- 7.4.2.4 LAMEA Military & Aerospace Market by Country
- 7.4.2.5 LAMEA Telecommunications Market by Country
- 7.4.2.6 LAMEA Others Market by Country
- 7.4.3 LAMEA 3D IC and 2.5D IC Packaging Market by Application
- 7.4.3.1 LAMEA Memory Market by Country
- 7.4.3.2 LAMEA Imaging & Optoelectronics Market by Country
- 7.4.3.3 LAMEA MEMS/Sensors Market by Country
- 7.4.3.4 LAMEA Logic Market by Country
- 7.4.3.5 LAMEA LED Market by Country
- 7.4.3.6 LAMEA Others Market by Country
- 7.4.4 LAMEA 3D IC and 2.5D IC Packaging Market by Country
- 7.4.4.1 Brazil 3D IC and 2.5D IC Packaging Market
- 7.4.4.1.1 Brazil 3D IC and 2.5D IC Packaging Market by Packaging Technology
- 7.4.4.1.2 Brazil 3D IC and 2.5D IC Packaging Market by End User
- 7.4.4.1.3 Brazil 3D IC and 2.5D IC Packaging Market by Application
- 7.4.4.2 Argentina 3D IC and 2.5D IC Packaging Market
- 7.4.4.2.1 Argentina 3D IC and 2.5D IC Packaging Market by Packaging Technology
- 7.4.4.2.2 Argentina 3D IC and 2.5D IC Packaging Market by End User
- 7.4.4.2.3 Argentina 3D IC and 2.5D IC Packaging Market by Application
- 7.4.4.3 UAE 3D IC and 2.5D IC Packaging Market
- 7.4.4.3.1 UAE 3D IC and 2.5D IC Packaging Market by Packaging Technology
- 7.4.4.3.2 UAE 3D IC and 2.5D IC Packaging Market by End User
- 7.4.4.3.3 UAE 3D IC and 2.5D IC Packaging Market by Application
- 7.4.4.4 Saudi Arabia 3D IC and 2.5D IC Packaging Market
- 7.4.4.4.1 Saudi Arabia 3D IC and 2.5D IC Packaging Market by Packaging Technology
- 7.4.4.4.2 Saudi Arabia 3D IC and 2.5D IC Packaging Market by End User
- 7.4.4.4.3 Saudi Arabia 3D IC and 2.5D IC Packaging Market by Application
- 7.4.4.5 South Africa 3D IC and 2.5D IC Packaging Market
- 7.4.4.5.1 South Africa 3D IC and 2.5D IC Packaging Market by Packaging Technology
- 7.4.4.5.2 South Africa 3D IC and 2.5D IC Packaging Market by End User
- 7.4.4.5.3 South Africa 3D IC and 2.5D IC Packaging Market by Application
- 7.4.4.6 Nigeria 3D IC and 2.5D IC Packaging Market
- 7.4.4.6.1 Nigeria 3D IC and 2.5D IC Packaging Market by Packaging Technology
- 7.4.4.6.2 Nigeria 3D IC and 2.5D IC Packaging Market by End User
- 7.4.4.6.3 Nigeria 3D IC and 2.5D IC Packaging Market by Application
- 7.4.4.7 Rest of LAMEA 3D IC and 2.5D IC Packaging Market
- 7.4.4.7.1 Rest of LAMEA 3D IC and 2.5D IC Packaging Market by Packaging Technology
- 7.4.4.7.2 Rest of LAMEA 3D IC and 2.5D IC Packaging Market by End User
- 7.4.4.7.3 Rest of LAMEA 3D IC and 2.5D IC Packaging Market by Application
- 7.4.4.1 Brazil 3D IC and 2.5D IC Packaging Market
- 7.4.1 LAMEA 3D IC and 2.5D IC Packaging Market by Packaging Technology
Chapter 8. Company Profiles
- 8.1 Samsung Electronics Co., Ltd. (Samsung Group)
- 8.1.1 Company Overview
- 8.1.2 Financial Analysis
- 8.1.3 Segmental and Regional Analysis
- 8.1.4 Research & Development Expense
- 8.1.5 Recent strategies and developments:
- 8.1.5.1 Product Launches and Product Expansions:
- 8.1.6 SWOT Analysis
- 8.2 Taiwan Semiconductor Manufacturing Company Limited
- 8.2.1 Company overview
- 8.2.2 Financial Analysis
- 8.2.3 Regional Analysis
- 8.2.4 Research & Development Expenses
- 8.3 Intel Corporation
- 8.3.1 Company Overview
- 8.3.2 Financial Analysis
- 8.3.3 Segmental and Regional Analysis
- 8.3.4 Research & Development Expenses
- 8.3.5 SWOT Analysis
- 8.4 ASE Group (ASE Technology Holding Co., Ltd.)
- 8.4.1 Company Overview
- 8.4.2 Financial Analysis
- 8.4.3 Segmental and Regional Analysis
- 8.4.4 Research & Development Expenses
- 8.4.5 Recent strategies and developments:
- 8.4.5.1 Product Launches and Product Expansions:
- 8.5 Amkor Technology, Inc.
- 8.5.1 Company Overview
- 8.5.2 Financial Analysis
- 8.5.3 Research & Development Expense
- 8.5.4 Recent strategies and developments:
- 8.5.4.1 Partnerships, Collaborations, and Agreements:
- 8.6 Broadcom, Inc.
- 8.6.1 Company Overview
- 8.6.2 Financial Analysis
- 8.6.3 Segmental and Regional Analysis
- 8.6.4 Research & Development Expense
- 8.6.5 SWOT Analysis
- 8.7 Texas Instruments, Inc.
- 8.7.1 Company Overview
- 8.7.2 Financial Analysis
- 8.7.3 Segmental and Regional Analysis
- 8.7.4 Research & Development Expense
- 8.8 JCET Group
- 8.8.1 Company Overview
- 8.8.2 Financial Analysis
- 8.8.3 Research & Development Expenses
- 8.9 Powertech Technology Inc.
- 8.9.1 Company Overview
- 8.9.2 Financial Analysis
- 8.9.3 Regional Analysis
- 8.9.4 Research & Development Expenses
- 8.10. United Microelectronics Corporation
- 8.10.1 Company Overview
- 8.10.2 Financial Analysis
- 8.10.3 Regional Analysis
- 8.10.4 Research & Development Expenses