|
|
市場調査レポート
商品コード
1633197
デジタルコマースの世界市場:2025-2029年Global Digital Commerce Market: 2025-2029 |
||||||
|
|||||||
| デジタルコマースの世界市場:2025-2029年 |
|
出版日: 2025年01月20日
発行: Juniper Research Ltd
ページ情報: 英文
納期: 即日から翌営業日
|
全表示
- 概要
- 目次
"デジタルコマースの支出額は2029年には34兆ドルに達する見通し"
| 主要統計 | |
|---|---|
| 2025年のデジタルコマースの取引額: | 23兆ドル |
| 2029年のデジタルコマースの取引額: | 345億米ドル |
| 2025年から2029年にかけての市場成長率: | 50% |
| 予測期間: | 2025-2029年 |
当レポートでは、世界のデジタルコマースの市場を調査し、主要促進要因および課題、ベンダーへの戦略的提言、デジタルバンキング、eコマース、デジタルチケット、送金、近接決済 (QRコード決済や非接触決済を含む) などのセグメント別の状況の詳細分析をまとめています。また、主要8地域、60カ国別の市場ベンチマーク予測も掲載しています。
主な特徴
- 主な要点と戦略的提言:デジタルコマース市場に関する主要な調査結果を包括的に分析し、ステークホルダーへの戦略的提言も掲載しています。
- セグメント分析:デジタルコマース分野における重要なセグメントを分析しています。
- デジタルバンキング
- eコマース
- オンライン&モバイルチケット
- 送金
- 近接決済(QRコード決済、非接触決済を含む)
- 市場促進要因と抑制要因:新興市場の成長、オープンバンキングの影響、新たな規制の役割など、デジタルコマースにおける各市場セグメントの主な成長促進要因と抑制要因を分析し、今後の成長と方向性に関する詳細な見通しを提供します。
- ベンチマーク業界予測:デジタルバンキング、eコマース、デジタルチケッティング、送金、近接決済における取引件数、取引額、デジタルユーザー数を、デジタルチャネル全体、オンラインチャネル、モバイルチャネルに分けて、包括的なデータと予測で明らかにします。
データ&インタラクティブ予測
当調査スイートには、46の表と30,000以上のデータポイントを含む予測データ一式へのアクセスが含まれています。調査スイートには以下の指標が含まれます:
- デジタルコマースの取引件数
- デジタルコマースの取引額
- デジタルコマースのユーザー数
主要チャネルの指標は以下の通りです:
- デジタルバンキング
- eコマース(デジタル商品とフィジカル商品を含む)
- オンライン&モバイルチケット
- 送金(越境デジタル送金とP2P送金を含む)
- 近接決済(QRコード決済、NFC決済を含む)
Juniper Researchのインタラクティブ予測 (Excel) には次の機能があります:
- 統計分析:データ期間中のすべての地域と国が表示され、ユーザーは特定の指標を検索できます。グラフは簡単に変更でき、クリップボードへのエクスポートも可能です。
- 国別データツール:予測期間中のすべての地域と国の指標を見ることができます。検索バーで表示される指標を絞り込むことができます。
- 国別比較ツール:国を選択して比較することができます。このツールには、グラフのエクスポート機能が含まれています。
サンプルビュー
市場動向&予測 (PDFレポート)

目次
第1章 重要ポイントと戦略的推奨事項
- 重要ポイント
- 戦略的推奨事項
第2章 デジタルコマースの概要
- 市場セクターの定義
- モバイルバンキングとオンラインバンキングの定義
- デジタル商品と物理商品の定義
- デジタルチケットの定義
- QRコード決済の定義
- 非接触決済の定義
- デジタルコマース:市場予測の概要
- 取引件数
- 取引額
第3章 デジタルバンキングの市場
- オープンバンキングの影響
- デジタルバンキングセクターの予測:サマリー
- デジタルバンキングBPP (請求書提示・支払い) ユーザー数
- BPP取引額
第4章 eコマース市場
- eコマース市場
- 主な動向と促進要因
- ローカルアクワイアリングは加盟店のコストを削減
- サブスクリプション経済における定期支払いを合理化
- 新たな規制の施行
- eコマース決済市場の主要事業者
- フィジカル商品
- リモートフィジカル商品の取引件数
- リモートフィジカル商品の取引額
- デジタル商品
- 取引件数
- リモートデジタルグッズ販売の取引額
第5章 デジタルチケット市場
- 市場セグメンテーション
- バス/地下鉄、鉄道、航空券
- デジタルチケット取引件数
- デジタルチケット取引額 - モバイルおよびオンラインチケット
第6章 NFC/非接触決済とQRコード決済の市場
- 非接触決済における主な動向と動向
- 非接触決済がますますデフォルトの選択肢に
- NFC経由のA2A決済
- ソフトPOSが非接触決済の新たな市場を開拓
- QR決済市場の動向
- キャッシュレス社会の正常化
- POSソリューションとしてのQRコードのアクセシビリティ
- モバイル近接取引の予測
- モバイル近接取引額
- 近接取引額
第7章 デジタル送金市場
- 国際デジタル送金
- 国内デジタル送金とモバイルマネー
- 現在の市場状況と注目すべき動向
- セクター予測の概要
- モバイルおよびオンライン送金取引件数
- モバイルおよびオンライン送金取引額
'Digital Commerce Spend to Hit $34 Trillion by 2029'
| KEY STATISTICS | |
|---|---|
| Total digital commerce transaction value in 2025: | $23tn |
| Total digital commerce transaction value in 2029: | $34.5tn |
| Market growth between 2025 and 2029: | 50% |
| Forecast period: | 2025-2029 |
Overview
Our "Digital Commerce" research suite provides an in-depth analysis of this rapidly growing market; addressing the major drivers and challenges, and offering strategic recommendations so that vendors can best capitalise on this market growth. The report assesses the trends and challenges within the sector; analysing the state of the digital banking, eCommerce, digital ticketing, money transfer and proximity payments (including QR code payments and contactless payments) market segments in depth.
The research also provides industry benchmark forecasts for the market, split by the following segments, as well as by our 8 key regions and 60 countries:
- Digital Banking
- eCommerce (inclusive of digital goods and physical goods)
- Online & Mobile Ticketing
- Money Transfers (inclusive of both digital cross-border remittances and P2P transfers)
- Proximity Payments (including QR code payments and NFC payments)
The suite includes both a data deliverable, sizing the market and providing key forecast data across 60 countries, and a strategy and trends report, delivering a complete assessment of the key trends, challenges and recommendations for stakeholders within the digital commerce market. Together, they provide an essential tool for a comprehensive understanding of this evolving market; enabling digital commerce vendors to shape their future strategy.
Key Features
- Key Takeaways & Strategic Recommendations: Comprehensive analysis of the key findings for the digital commerce market, accompanied by strategic recommendations for stakeholders.
- Segment Analysis: Analysis of important segments within the digital commerce space, including:
- Digital Banking
- eCommerce
- Online & Mobile Ticketing
- Money Transfers
- Proximity Payments (including QR Code Payments and Contactless Payments)
- Market Drivers & Constraints: Analysis of the key drivers of growth and growth constraints for each market segment within the digital commerce landscape, such as growth in emerging markets, the impact of Open Banking, and the role of new regulations. This then provides a detailed outlook for the market's future growth and direction of travel.
- Benchmark Industry Forecasts: A suite of comprehensive data and forecasts highlighting the total transaction volume, transaction value and number of digital users across digital banking, eCommerce, digital ticketing, money transfers and proximity payments, split by the total digital channels, and the online and mobile channels.
Data & Interactive Forecast
The market-leading research suite for the Digital Commerce market includes access to the full set of forecast data, with 46 tables and over 30,000 datapoints. Metrics in the research suite include:
- Total transaction volume of digital commerce
- Total transaction value of digital commerce
- Total users of digital commerce
Metrics are provided for the following key channels:
- Digital Banking
- eCommerce (inclusive of digital goods and physical goods)
- Online & Mobile Ticketing
- Money Transfers (inclusive of both digital cross-border remittances and P2P transfers)
- Proximity payments (including QR code payments and NFC payments)
Juniper Research Interactive Forecast Excel contains the following functionality:
- Statistics Analysis: Users benefit from the ability to search for specific metrics; displayed for all regions and countries across the data period. Graphs are easily modified and can be exported to the clipboard.
- Country Data Tool: This tool lets users look at metrics for all regions and countries in the forecast period. Users can refine the metrics displayed via a search bar.
- Country Comparison Tool: Users can select and compare countries. The ability to export graphs is included in this tool.
SAMPLE VIEW
Market Trends & Forecasts PDF Report

A comprehensive analysis of the current market landscape, alongside strategic recommendations and a walk-through of the forecasts.
Table of Contents
1. Key Takeaways & Strategic Recommendations
- 1.1. Key Takeaways
- 1.2. Strategic Recommendations
2. Digital Commerce Summary
- 2.1. Introduction
- Figure 2.1: Digital Commerce Market Segmentation
- 2.2. Market Sector Definitions
- 2.2.1. Definition of Mobile & Online Banking
- 2.2.2. Definition of Digital & Physical Goods
- i. Digital Goods
- ii. Physical Goods
- 2.2.3. Definition of Digital Ticketing
- i. Mobile Ticketing
- ii. Online Ticketing
- 2.2.4. Definition of QR Code Payments
- 2.2.5. Definition of Contactless Payments
- 2.3. Digital Commerce: Market Forecast Summary
- 2.3.1. Total Transaction Volume
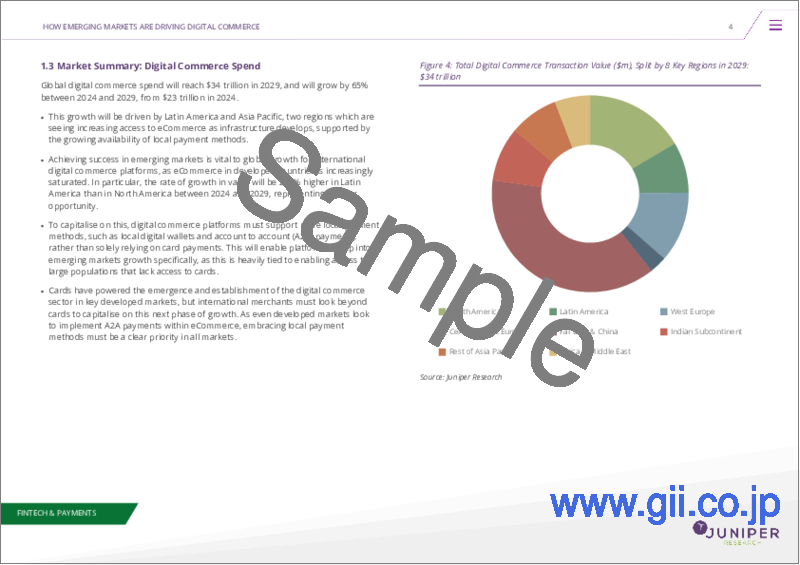
- Figure & Table 2.2: Total Digital Commerce Transaction Volume (m), Split by 8 Key Regions, 2024-2029
- 2.3.2. Total Transaction Value
- Figure & Table 2.3: Total Digital Commerce Transaction Value ($m), Split by 8 Key Regions, 2024-2029
- Table 2.4: Total Digital Commerce Transaction Value ($m), Split by Segment, 2024-2029
- 2.3.1. Total Transaction Volume
3. The Market for Digital Banking
- 3.1. Introduction
- 3.2. The Impact of Open Banking
- Figure 3.1: How Open Banking Works
- Figure 3.2: Number of Open Banking Payment Users Globally (m), 2023-2028
- 3.3. Digital Banking Sector Forecast Summary
- 3.3.1. Digital Banking Bill Payment & Presentment (BPP) Users
- Figure & Table 3.3: Digital Banking Bill Payment & Presentment Users (m), Split by 8 Key Regions, 2024-2029
- 3.3.2. BPP Transaction Value
- Figure & Table 3.4: BPP Transaction Value ($m), Split by 8 Key Regions, 2024-2029
- 3.3.1. Digital Banking Bill Payment & Presentment (BPP) Users
4. The eCommerce Market
- 4.1. The eCommerce Market
- 4.2. Key Trends & Drivers
- 4.2.1. Local Acquiring Lowers Costs to Merchants
- 4.2.2. Streamline Recurring Payments in a Subscription Economy
- 4.2.3. New Regulations Coming into Force
- i. Europe
- ii. China
- 4.2.4. Key Players in the eCommerce Payments Market
- Figure 4.1: eCommerce Payments Process
- i. Payment Gateway
- ii. Payment Processors
- iii. Payment Services Provider
- iv. Payments Orchestration Platforms
- 4.3. Physical Goods
- 4.3.1. Total Transaction Volume for Remote Physical Goods
- Figure & Table 4.2: Total Transaction Volume for Remote Physical Goods per Annum (m), Split by 8 Key Regions, 2024-2029
- 4.3.2. Total Transaction Value for Remote Physical Goods
- Figure & Table 4.3: Total Transaction Value for Remote Physical Goods ($m), Split by 8 Key Regions, 2024-2029
- 4.3.1. Total Transaction Volume for Remote Physical Goods
- 4.4. Digital Goods
- 4.4.1. Total Transaction Volume
- Figure & Table 4.4: Total Number of Remote Payment Transactions for Digital Goods (m), Split by 8 Key Regions, 2024-2029
- 4.4.2. Total Transaction Value for Remote Digital Goods Sales
- Figure & Table 4.5: Total Transaction Value for Remote Digital Goods Sales ($m), Split by 8 Key Regions, 2024-2029
- 4.4.1. Total Transaction Volume
5. The Market for Digital Ticketing
- 5.1. Market Segmentation
- 5.1.1. Bus/Metro, Rail, and Air Ticketing
- Figure 5.1: Number of Journeys via Contactless, Bus versus Tube & Rail, Jan 2022 to March 2024, Transport for London Network
- i. Account-based Ticketing
- ii. Purchase & Use via Digital Wallets
- Figure 5.2: Travel Cards on Apple Wallet
- 5.1.2. Total Digital Ticketing Transaction Volume
- Figure & Table 5.3: Total Number of Digital Ticketing Transactions, Volume (m), Split by 8 Key Regions, 2024-2029
- 5.1.3. Total Digital Ticketing Transaction Value - Mobile and Online Ticketing
- Figure & Table 5.4: Total Digital Ticketing Transaction Value ($m), Split by 8 Key Regions, 2024-2029
- 5.1.1. Bus/Metro, Rail, and Air Ticketing
6. The Market for NFC/Contactless and QR Code Payments
- 6.1. Introduction
- 6.2. Key Trends & Developments Within Contactless Payments
- 6.2.1. Contactless Payments Increasingly Represent the Default Choice
- 6.2.2. A2A Payments via NFC
- Figure 6.1: Paytm Payment Devices Including QR and NFC
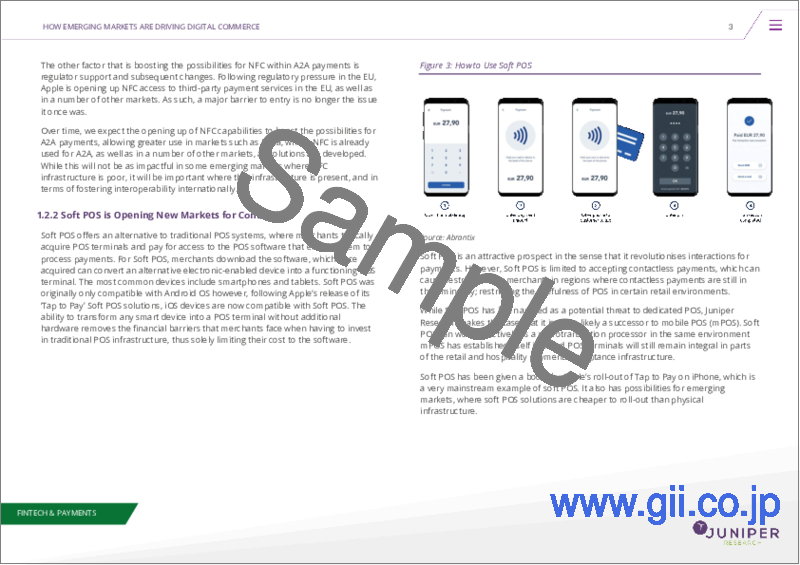
- 6.2.3. Soft POS Is Opening New Markets for Contactless
- Figure 6.2: How to Use Soft POS
- 6.2.4. Trends in the QR Payments Market
- 6.2.5. The Normalisation of Cashless Societies
- 6.2.6. Accessibility of QR Codes as a POS Solution
- 6.3. Mobile Proximity Transaction Forecasts
- 6.3.1. Total Mobile Proximity Transactions
- Figure & Table 6.3: Total Number of Mobile Proximity Transactions (m), Split by Channel, 2024-2029
- 6.3.2. Total Proximity Transaction Value
- Figure & Table 6.4: Total Proximity Transaction Value, Split by Channel, 2024-2029
- 6.3.1. Total Mobile Proximity Transactions
7. The Market for Digital Money Transfer
- 7.1. International Digital Money Transfer & Remittances
- 7.1.1. Definition and Scope
- 7.1.2. Blockchain
- i. Advantages of Blockchain in International Digital Money Transfer
- Figure 7.1: Advantages of Blockchain in Digital Money Transfer
- i. Advantages of Blockchain in International Digital Money Transfer
- 7.1.3. Stablecoins
- 7.2. Domestic Digital Money Transfer & Mobile Money
- 7.2.1. Definitions and Scope
- 7.3. Current Market Status and Trends to Watch
- 7.3.1. Mobile Money and Payments-as-a-Platform (PaaP)
- 7.4. Sector Forecast Summary
- 7.4.1. Mobile & Online Money Transfer & Remittances Total Transaction Volume
- Figure & Table 7.2: Total Digital Money Transfer and Remittance Transactions per Annum (m), Split by 8 Regions, 2024-2029
- 7.4.2. Mobile & Online Money Transfer & Remittances Total Transaction Value
- Figure & Table 7.3: Total Value of Mobile & Online Money Transfer and Remittances per Annum ($m), Split by 8 Key Regions, 2024-2029
- 7.4.1. Mobile & Online Money Transfer & Remittances Total Transaction Volume


