|
|
市場調査レポート
商品コード
1502296
高等教育mラーニングの世界市場 2024-2028Global higher education m-learning market 2024-2028 |
||||||

|
|||||||
カスタマイズ可能
|
|||||||


| 高等教育mラーニングの世界市場 2024-2028 |
|
出版日: 2024年05月20日
発行: TechNavio
ページ情報: 英文 163 Pages
納期: 即納可能
|

全表示
- 概要
- 図表
- 目次
高等教育mラーニング市場は、2023年から2028年にかけて906億5,430万米ドル、予測期間中のCAGRは28.96%で成長すると予測されています。
当レポートでは、高等教育mラーニング市場について包括的な分析、市場規模と予測、動向、成長促進要因・課題、約25のベンダーを網羅したベンダー分析などを掲載しています。
現在の市場シナリオ、最新動向と促進要因、市場環境全体に関する最新分析を提供しています。インターネットの普及がモバイルベースの学習の普及に拍車をかけていること、自分のペースで学習できるMラーニングへの嗜好が高まっていること、個別学習が重視されるようになっていることなどが市場を牽引しています。
| 市場範囲 | |
|---|---|
| 基準年 | 2024 |
| 終了年 | 2028 |
| 予測期間 | 2024-2028 |
| 成長モメンタム | 加速 |
| 前年比2024年 | 22.04% |
| CAGR | 28.96% |
| 増分額 | 906億5,430万米ドル |
本調査では、今後数年間の高等教育mラーニング市場の成長を促進する主な要因の一つとして、学習者のエンゲージメントレベルを高めるゲーミフィケーションの導入を挙げています。また、代替資格システムの台頭と、科目習熟度評価および認証ツールの出現は、市場の大きな需要につながります。
目次
第1章 エグゼクティブサマリー
- 市場概要
第2章 市場情勢
- 市場エコシステム
- 市場の特徴
- バリューチェーン分析
第3章 市場規模の評価
- 市場の定義
- 市場セグメント分析
- 市場規模 2023
- 市場の見通し 2023-2028
第4章 市場規模実績
- 世界の高等教育Mラーニング市場 2018-2022
- タイプ別セグメント分析 2018-2022
- コース別セグメント分析 2018-2022
- 地域別セグメント分析 2018-2022
- 国別セグメント分析 2018-2022
第5章 ファイブフォース分析
- ファイブフォースの要約
- 買い手の交渉力
- 供給企業の交渉力
- 新規参入業者の脅威
- 代替品の脅威
- 競争の脅威
- 市況
第6章 市場セグメンテーション:タイプ別
- 市場セグメンテーション
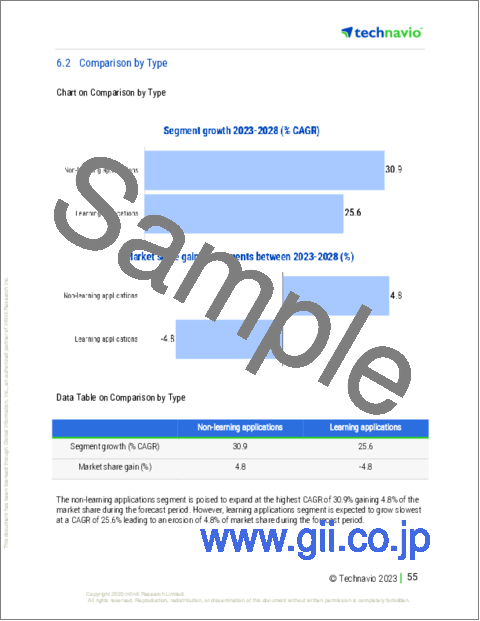
- 比較:タイプ別
- 非学習アプリケーション:市場規模と予測 2023-2028
- 学習アプリケーション:市場規模と予測 2023-2028
- 市場機会:タイプ別
第7章 市場セグメンテーションコース別
- 市場セグメンテーション
- 比較コース別
- 技術コース:市場規模と予測 2023-2028
- 非技術コース:市場規模と予測 2023-2028
- 市場機会コース別
第8章 顧客情勢
- 顧客情勢の概要
第9章 地域別情勢
- 地域別セグメンテーション
- 地域別比較
- 北米:市場規模と予測 2023-2028
- アジア太平洋:市場規模と予測 2023-2028
- 欧州:市場規模と予測 2023-2028
- 南米:市場規模と予測 2023-2028
- 中東・アフリカ:市場規模と予測 2023-2028
- 米国:市場規模と予測 2023-2028
- 中国:市場規模と予測 2023-2028
- 英国:市場規模と予測 2023-2028
- ドイツ:市場規模と予測 2023-2028
- インド:市場規模と予測 2023-2028
- 市場機会:地域別
第10章 促進要因・課題・機会・抑制要因
- 市場促進要因
- 市場の課題
- 促進要因と課題の影響
- 市場の機会・抑制要因
第11章 競合情勢
- 概要
- 競合情勢
- 混乱の状況
- 業界のリスク
第12章 競合分析
- 企業プロファイル
- 企業の市場ポジショニング
- Adobe Inc.
- City and Guilds Group
- D2L Inc.
- Docebo Inc.
- Educomp Solutions Ltd.
- Epignosis LLC
- Novac Learning
- Pearson Plc
- Platinum Equity Advisors LLC
- PowerSchool Holdings Inc.
- Providence Equity Partners LLC
- Litmos US L.P.
- Simplilearn
- Thoma Bravo LP
- Thought Industries
第13章 付録
Exhibits:
- Exhibits1: Executive Summary - Chart on Market Overview
- Exhibits2: Executive Summary - Data Table on Market Overview
- Exhibits3: Executive Summary - Chart on Global Market Characteristics
- Exhibits4: Executive Summary - Chart on Market by Geography
- Exhibits5: Executive Summary - Chart on Market Segmentation by Type
- Exhibits6: Executive Summary - Chart on Market Segmentation by Courses
- Exhibits7: Executive Summary - Chart on Incremental Growth
- Exhibits8: Executive Summary - Data Table on Incremental Growth
- Exhibits9: Executive Summary - Chart on Company Market Positioning
- Exhibits10: Parent Market
- Exhibits11: Data Table on - Parent Market
- Exhibits12: Market characteristics analysis
- Exhibits13: Value Chain Analysis
- Exhibits14: Offerings of companies included in the market definition
- Exhibits15: Market segments
- Exhibits16: Chart on Global - Market size and forecast 2023-2028 ($ million)
- Exhibits17: Data Table on Global - Market size and forecast 2023-2028 ($ million)
- Exhibits18: Chart on Global Market: Year-over-year growth 2023-2028 (%)
- Exhibits19: Data Table on Global Market: Year-over-year growth 2023-2028 (%)
- Exhibits20: Historic Market Size - Data Table on Global Higher Education M-Learning Market 2018 - 2022 ($ million)
- Exhibits21: Historic Market Size - Type Segment 2018 - 2022 ($ million)
- Exhibits22: Historic Market Size - Courses Segment 2018 - 2022 ($ million)
- Exhibits23: Historic Market Size - Geography Segment 2018 - 2022 ($ million)
- Exhibits24: Historic Market Size - Country Segment 2018 - 2022 ($ million)
- Exhibits25: Five forces analysis - Comparison between 2023 and 2028
- Exhibits26: Bargaining power of buyers - Impact of key factors 2023 and 2028
- Exhibits27: Bargaining power of suppliers - Impact of key factors in 2023 and 2028
- Exhibits28: Threat of new entrants - Impact of key factors in 2023 and 2028
- Exhibits29: Threat of substitutes - Impact of key factors in 2023 and 2028
- Exhibits30: Threat of rivalry - Impact of key factors in 2023 and 2028
- Exhibits31: Chart on Market condition - Five forces 2023 and 2028
- Exhibits32: Chart on Type - Market share 2023-2028 (%)
- Exhibits33: Data Table on Type - Market share 2023-2028 (%)
- Exhibits34: Chart on Comparison by Type
- Exhibits35: Data Table on Comparison by Type
- Exhibits36: Chart on Non-learning applications - Market size and forecast 2023-2028 ($ million)
- Exhibits37: Data Table on Non-learning applications - Market size and forecast 2023-2028 ($ million)
- Exhibits38: Chart on Non-learning applications - Year-over-year growth 2023-2028 (%)
- Exhibits39: Data Table on Non-learning applications - Year-over-year growth 2023-2028 (%)
- Exhibits40: Chart on Learning applications - Market size and forecast 2023-2028 ($ million)
- Exhibits41: Data Table on Learning applications - Market size and forecast 2023-2028 ($ million)
- Exhibits42: Chart on Learning applications - Year-over-year growth 2023-2028 (%)
- Exhibits43: Data Table on Learning applications - Year-over-year growth 2023-2028 (%)
- Exhibits44: Market opportunity by Type ($ million)
- Exhibits45: Data Table on Market opportunity by Type ($ million)
- Exhibits46: Chart on Courses - Market share 2023-2028 (%)
- Exhibits47: Data Table on Courses - Market share 2023-2028 (%)
- Exhibits48: Chart on Comparison by Courses
- Exhibits49: Data Table on Comparison by Courses
- Exhibits50: Chart on Technical courses - Market size and forecast 2023-2028 ($ million)
- Exhibits51: Data Table on Technical courses - Market size and forecast 2023-2028 ($ million)
- Exhibits52: Chart on Technical courses - Year-over-year growth 2023-2028 (%)
- Exhibits53: Data Table on Technical courses - Year-over-year growth 2023-2028 (%)
- Exhibits54: Chart on Non-technical courses - Market size and forecast 2023-2028 ($ million)
- Exhibits55: Data Table on Non-technical courses - Market size and forecast 2023-2028 ($ million)
- Exhibits56: Chart on Non-technical courses - Year-over-year growth 2023-2028 (%)
- Exhibits57: Data Table on Non-technical courses - Year-over-year growth 2023-2028 (%)
- Exhibits58: Market opportunity by Courses ($ million)
- Exhibits59: Data Table on Market opportunity by Courses ($ million)
- Exhibits60: Analysis of price sensitivity, lifecycle, customer purchase basket, adoption rates, and purchase criteria
- Exhibits61: Chart on Market share By Geographical Landscape2023-2028 (%)
- Exhibits62: Data Table on Market share By Geographical Landscape2023-2028 (%)
- Exhibits63: Chart on Geographic comparison
- Exhibits64: Data Table on Geographic comparison
- Exhibits65: Chart on North America - Market size and forecast 2023-2028 ($ million)
- Exhibits66: Data Table on North America - Market size and forecast 2023-2028 ($ million)
- Exhibits67: Chart on North America - Year-over-year growth 2023-2028 (%)
- Exhibits68: Data Table on North America - Year-over-year growth 2023-2028 (%)
- Exhibits69: Chart on APAC - Market size and forecast 2023-2028 ($ million)
- Exhibits70: Data Table on APAC - Market size and forecast 2023-2028 ($ million)
- Exhibits71: Chart on APAC - Year-over-year growth 2023-2028 (%)
- Exhibits72: Data Table on APAC - Year-over-year growth 2023-2028 (%)
- Exhibits73: Chart on Europe - Market size and forecast 2023-2028 ($ million)
- Exhibits74: Data Table on Europe - Market size and forecast 2023-2028 ($ million)
- Exhibits75: Chart on Europe - Year-over-year growth 2023-2028 (%)
- Exhibits76: Data Table on Europe - Year-over-year growth 2023-2028 (%)
- Exhibits77: Chart on South America - Market size and forecast 2023-2028 ($ million)
- Exhibits78: Data Table on South America - Market size and forecast 2023-2028 ($ million)
- Exhibits79: Chart on South America - Year-over-year growth 2023-2028 (%)
- Exhibits80: Data Table on South America - Year-over-year growth 2023-2028 (%)
- Exhibits81: Chart on Middle East and Africa - Market size and forecast 2023-2028 ($ million)
- Exhibits82: Data Table on Middle East and Africa - Market size and forecast 2023-2028 ($ million)
- Exhibits83: Chart on Middle East and Africa - Year-over-year growth 2023-2028 (%)
- Exhibits84: Data Table on Middle East and Africa - Year-over-year growth 2023-2028 (%)
- Exhibits85: Chart on US - Market size and forecast 2023-2028 ($ million)
- Exhibits86: Data Table on US - Market size and forecast 2023-2028 ($ million)
- Exhibits87: Chart on US - Year-over-year growth 2023-2028 (%)
- Exhibits88: Data Table on US - Year-over-year growth 2023-2028 (%)
- Exhibits89: Chart on China - Market size and forecast 2023-2028 ($ million)
- Exhibits90: Data Table on China - Market size and forecast 2023-2028 ($ million)
- Exhibits91: Chart on China - Year-over-year growth 2023-2028 (%)
- Exhibits92: Data Table on China - Year-over-year growth 2023-2028 (%)
- Exhibits93: Chart on UK - Market size and forecast 2023-2028 ($ million)
- Exhibits94: Data Table on UK - Market size and forecast 2023-2028 ($ million)
- Exhibits95: Chart on UK - Year-over-year growth 2023-2028 (%)
- Exhibits96: Data Table on UK - Year-over-year growth 2023-2028 (%)
- Exhibits97: Chart on Germany - Market size and forecast 2023-2028 ($ million)
- Exhibits98: Data Table on Germany - Market size and forecast 2023-2028 ($ million)
- Exhibits99: Chart on Germany - Year-over-year growth 2023-2028 (%)
- Exhibits100: Data Table on Germany - Year-over-year growth 2023-2028 (%)
- Exhibits101: Chart on India - Market size and forecast 2023-2028 ($ million)
- Exhibits102: Data Table on India - Market size and forecast 2023-2028 ($ million)
- Exhibits103: Chart on India - Year-over-year growth 2023-2028 (%)
- Exhibits104: Data Table on India - Year-over-year growth 2023-2028 (%)
- Exhibits105: Market opportunity By Geographical Landscape($ million)
- Exhibits106: Data Tables on Market opportunity By Geographical Landscape($ million)
- Exhibits107: Impact of drivers and challenges in 2023 and 2028
- Exhibits108: Overview on criticality of inputs and factors of differentiation
- Exhibits109: Overview on factors of disruption
- Exhibits110: Impact of key risks on business
- Exhibits111: Companies covered
- Exhibits112: Matrix on companies position and classification
- Exhibits113: Adobe Inc. - Overview
- Exhibits114: Adobe Inc. - Business segments
- Exhibits115: Adobe Inc. - Key news
- Exhibits116: Adobe Inc. - Key offerings
- Exhibits117: Adobe Inc. - Segment focus
- Exhibits118: City and Guilds Group - Overview
- Exhibits119: City and Guilds Group - Product / Service
- Exhibits120: City and Guilds Group - Key offerings
- Exhibits121: D2L Inc. - Overview
- Exhibits122: D2L Inc. - Product / Service
- Exhibits123: D2L Inc. - Key news
- Exhibits124: D2L Inc. - Key offerings
- Exhibits125: Docebo Inc. - Overview
- Exhibits126: Docebo Inc. - Product / Service
- Exhibits127: Docebo Inc. - Key offerings
- Exhibits128: Educomp Solutions Ltd. - Overview
- Exhibits129: Educomp Solutions Ltd. - Product / Service
- Exhibits130: Educomp Solutions Ltd. - Key offerings
- Exhibits131: Epignosis LLC - Overview
- Exhibits132: Epignosis LLC - Product / Service
- Exhibits133: Epignosis LLC - Key offerings
- Exhibits134: Novac Learning - Overview
- Exhibits135: Novac Learning - Product / Service
- Exhibits136: Novac Learning - Key offerings
- Exhibits137: Pearson Plc - Overview
- Exhibits138: Pearson Plc - Business segments
- Exhibits139: Pearson Plc - Key news
- Exhibits140: Pearson Plc - Key offerings
- Exhibits141: Pearson Plc - Segment focus
- Exhibits142: Platinum Equity Advisors LLC - Overview
- Exhibits143: Platinum Equity Advisors LLC - Product / Service
- Exhibits144: Platinum Equity Advisors LLC - Key offerings
- Exhibits145: PowerSchool Holdings Inc. - Overview
- Exhibits146: PowerSchool Holdings Inc. - Product / Service
- Exhibits147: PowerSchool Holdings Inc. - Key news
- Exhibits148: PowerSchool Holdings Inc. - Key offerings
- Exhibits149: Providence Equity Partners LLC - Overview
- Exhibits150: Providence Equity Partners LLC - Product / Service
- Exhibits151: Providence Equity Partners LLC - Key offerings
- Exhibits152: Litmos US L.P. - Overview
- Exhibits153: Litmos US L.P. - Product / Service
- Exhibits154: Litmos US L.P. - Key offerings
- Exhibits155: Simplilearn - Overview
- Exhibits156: Simplilearn - Product / Service
- Exhibits157: Simplilearn - Key offerings
- Exhibits158: Thoma Bravo LP - Overview
- Exhibits159: Thoma Bravo LP - Product / Service
- Exhibits160: Thoma Bravo LP - Key offerings
- Exhibits161: Thought Industries - Overview
- Exhibits162: Thought Industries - Product / Service
- Exhibits163: Thought Industries - Key offerings
- Exhibits164: Inclusions checklist
- Exhibits165: Exclusions checklist
- Exhibits166: Currency conversion rates for US$
- Exhibits167: Research methodology
- Exhibits168: Information sources
- Exhibits169: Data validation
- Exhibits170: Validation techniques employed for market sizing
- Exhibits171: Data synthesis
- Exhibits172: 360 degree market analysis
- Exhibits173: List of abbreviations
The higher education m-learning market is forecasted to grow by USD 90654.3 mn during 2023-2028, accelerating at a CAGR of 28.96% during the forecast period. The report on the higher education m-learning market provides a holistic analysis, market size and forecast, trends, growth drivers, and challenges, as well as vendor analysis covering around 25 vendors.
The report offers an up-to-date analysis regarding the current market scenario, the latest trends and drivers, and the overall market environment. The market is driven by increased penetration of internet spurring widespread adoption of mobile-based learning, growing preference for self-paced m-learning, and growing emphasis on personalized learning.
Technavio's higher education m-learning market is segmented as below:
| Market Scope | |
|---|---|
| Base Year | 2024 |
| End Year | 2028 |
| Series Year | 2024-2028 |
| Growth Momentum | Accelerate |
| YOY 2024 | 22.04% |
| CAGR | 28.96% |
| Incremental Value | $90654.3mn |
By Type
- Non-learning applications
- Learning applications
By Courses
- Technical courses
- Non-technical courses
By Geography
- North America
- APAC
- Europe
- South America
- Middle East and Africa
This study identifies the inclusion of gamification to drive learner engagement levels as one of the prime reasons driving the higher education m-learning market growth during the next few years. Also, growing prominence of alternative credential systems and emergence of subject proficiency assessment and certification tools will lead to sizable demand in the market.
The report on the higher education m-learning market covers the following areas:
- Higher education m-learning market sizing
- Higher education m-learning market forecast
- Higher education m-learning market industry analysis
The robust vendor analysis is designed to help clients improve their market position, and in line with this, this report provides a detailed analysis of several leading higher education m-learning market vendors that include 2U Inc., Adobe Inc., City and Guilds Group, D2L Inc., Docebo Inc., Edubrite Systems Inc., Educomp Solutions Ltd., Ellucian Co., Epignosis LLC, Microsoft Corp., Novac Learning, Oracle Corp., Pearson Plc, Platinum Equity Advisors LLC, PowerSchool Holdings Inc., Providence Equity Partners LLC, Litmos US L.P., Simplilearn, Thoma Bravo LP, and Thought Industries. Also, the higher education m-learning market analysis report includes information on upcoming trends and challenges that will influence market growth. This is to help companies strategize and leverage all forthcoming growth opportunities.
The study was conducted using an objective combination of primary and secondary information including inputs from key participants in the industry. The report contains a comprehensive market and vendor landscape in addition to an analysis of the key vendors.
The publisher presents a detailed picture of the market by the way of study, synthesis, and summation of data from multiple sources by an analysis of key parameters such as profit, pricing, competition, and promotions. It presents various market facets by identifying the key industry influencers. The data presented is comprehensive, reliable, and a result of extensive research - both primary and secondary. The market research reports provide a complete competitive landscape and an in-depth vendor selection methodology and analysis using qualitative and quantitative research to forecast the accurate market growth.
Table of Contents
1 Executive Summary
- 1.1 Market overview
- Executive Summary - Chart on Market Overview
- Executive Summary - Data Table on Market Overview
- Executive Summary - Chart on Global Market Characteristics
- Executive Summary - Chart on Market by Geography
- Executive Summary - Chart on Market Segmentation by Type
- Executive Summary - Chart on Market Segmentation by Courses
- Executive Summary - Chart on Incremental Growth
- Executive Summary - Data Table on Incremental Growth
- Executive Summary - Chart on Company Market Positioning
2 Market Landscape
- 2.1 Market ecosystem
- Parent Market
- Data Table on - Parent Market
- 2.2 Market characteristics
- Market characteristics analysis
- 2.3 Value chain analysis
- Value Chain Analysis
3 Market Sizing
- 3.1 Market definition
- Offerings of companies included in the market definition
- 3.2 Market segment analysis
- Market segments
- 3.3 Market size 2023
- 3.4 Market outlook: Forecast for 2023-2028
- Chart on Global - Market size and forecast 2023-2028 ($ million)
- Data Table on Global - Market size and forecast 2023-2028 ($ million)
- Chart on Global Market: Year-over-year growth 2023-2028 (%)
- Data Table on Global Market: Year-over-year growth 2023-2028 (%)
4 Historic Market Size
- 4.1 Global Higher Education M-Learning Market 2018 - 2022
- Historic Market Size - Data Table on Global Higher Education M-Learning Market 2018 - 2022 ($ million)
- 4.2 Type segment analysis 2018 - 2022
- Historic Market Size - Type Segment 2018 - 2022 ($ million)
- 4.3 Courses segment analysis 2018 - 2022
- Historic Market Size - Courses Segment 2018 - 2022 ($ million)
- 4.4 Geography segment analysis 2018 - 2022
- Historic Market Size - Geography Segment 2018 - 2022 ($ million)
- 4.5 Country segment analysis 2018 - 2022
- Historic Market Size - Country Segment 2018 - 2022 ($ million)
5 Five Forces Analysis
- 5.1 Five forces summary
- Five forces analysis - Comparison between 2023 and 2028
- 5.2 Bargaining power of buyers
- Bargaining power of buyers - Impact of key factors 2023 and 2028
- 5.3 Bargaining power of suppliers
- Bargaining power of suppliers - Impact of key factors in 2023 and 2028
- 5.4 Threat of new entrants
- Threat of new entrants - Impact of key factors in 2023 and 2028
- 5.5 Threat of substitutes
- Threat of substitutes - Impact of key factors in 2023 and 2028
- 5.6 Threat of rivalry
- Threat of rivalry - Impact of key factors in 2023 and 2028
- 5.7 Market condition
- Chart on Market condition - Five forces 2023 and 2028
6 Market Segmentation by Type
- 6.1 Market segments
- Chart on Type - Market share 2023-2028 (%)
- Data Table on Type - Market share 2023-2028 (%)
- 6.2 Comparison by Type
- Chart on Comparison by Type
- Data Table on Comparison by Type
- 6.3 Non-learning applications - Market size and forecast 2023-2028
- Chart on Non-learning applications - Market size and forecast 2023-2028 ($ million)
- Data Table on Non-learning applications - Market size and forecast 2023-2028 ($ million)
- Chart on Non-learning applications - Year-over-year growth 2023-2028 (%)
- Data Table on Non-learning applications - Year-over-year growth 2023-2028 (%)
- 6.4 Learning applications - Market size and forecast 2023-2028
- Chart on Learning applications - Market size and forecast 2023-2028 ($ million)
- Data Table on Learning applications - Market size and forecast 2023-2028 ($ million)
- Chart on Learning applications - Year-over-year growth 2023-2028 (%)
- Data Table on Learning applications - Year-over-year growth 2023-2028 (%)
- 6.5 Market opportunity by Type
- Market opportunity by Type ($ million)
- Data Table on Market opportunity by Type ($ million)
7 Market Segmentation by Courses
- 7.1 Market segments
- Chart on Courses - Market share 2023-2028 (%)
- Data Table on Courses - Market share 2023-2028 (%)
- 7.2 Comparison by Courses
- Chart on Comparison by Courses
- Data Table on Comparison by Courses
- 7.3 Technical courses - Market size and forecast 2023-2028
- Chart on Technical courses - Market size and forecast 2023-2028 ($ million)
- Data Table on Technical courses - Market size and forecast 2023-2028 ($ million)
- Chart on Technical courses - Year-over-year growth 2023-2028 (%)
- Data Table on Technical courses - Year-over-year growth 2023-2028 (%)
- 7.4 Non-technical courses - Market size and forecast 2023-2028
- Chart on Non-technical courses - Market size and forecast 2023-2028 ($ million)
- Data Table on Non-technical courses - Market size and forecast 2023-2028 ($ million)
- Chart on Non-technical courses - Year-over-year growth 2023-2028 (%)
- Data Table on Non-technical courses - Year-over-year growth 2023-2028 (%)
- 7.5 Market opportunity by Courses
- Market opportunity by Courses ($ million)
- Data Table on Market opportunity by Courses ($ million)
8 Customer Landscape
- 8.1 Customer landscape overview
- Analysis of price sensitivity, lifecycle, customer purchase basket, adoption rates, and purchase criteria
9 Geographic Landscape
- 9.1 Geographic segmentation
- Chart on Market share By Geographical Landscape2023-2028 (%)
- Data Table on Market share By Geographical Landscape2023-2028 (%)
- 9.2 Geographic comparison
- Chart on Geographic comparison
- Data Table on Geographic comparison
- 9.3 North America - Market size and forecast 2023-2028
- Chart on North America - Market size and forecast 2023-2028 ($ million)
- Data Table on North America - Market size and forecast 2023-2028 ($ million)
- Chart on North America - Year-over-year growth 2023-2028 (%)
- Data Table on North America - Year-over-year growth 2023-2028 (%)
- 9.4 APAC - Market size and forecast 2023-2028
- Chart on APAC - Market size and forecast 2023-2028 ($ million)
- Data Table on APAC - Market size and forecast 2023-2028 ($ million)
- Chart on APAC - Year-over-year growth 2023-2028 (%)
- Data Table on APAC - Year-over-year growth 2023-2028 (%)
- 9.5 Europe - Market size and forecast 2023-2028
- Chart on Europe - Market size and forecast 2023-2028 ($ million)
- Data Table on Europe - Market size and forecast 2023-2028 ($ million)
- Chart on Europe - Year-over-year growth 2023-2028 (%)
- Data Table on Europe - Year-over-year growth 2023-2028 (%)
- 9.6 South America - Market size and forecast 2023-2028
- Chart on South America - Market size and forecast 2023-2028 ($ million)
- Data Table on South America - Market size and forecast 2023-2028 ($ million)
- Chart on South America - Year-over-year growth 2023-2028 (%)
- Data Table on South America - Year-over-year growth 2023-2028 (%)
- 9.7 Middle East and Africa - Market size and forecast 2023-2028
- Chart on Middle East and Africa - Market size and forecast 2023-2028 ($ million)
- Data Table on Middle East and Africa - Market size and forecast 2023-2028 ($ million)
- Chart on Middle East and Africa - Year-over-year growth 2023-2028 (%)
- Data Table on Middle East and Africa - Year-over-year growth 2023-2028 (%)
- 9.8 US - Market size and forecast 2023-2028
- Chart on US - Market size and forecast 2023-2028 ($ million)
- Data Table on US - Market size and forecast 2023-2028 ($ million)
- Chart on US - Year-over-year growth 2023-2028 (%)
- Data Table on US - Year-over-year growth 2023-2028 (%)
- 9.9 China - Market size and forecast 2023-2028
- Chart on China - Market size and forecast 2023-2028 ($ million)
- Data Table on China - Market size and forecast 2023-2028 ($ million)
- Chart on China - Year-over-year growth 2023-2028 (%)
- Data Table on China - Year-over-year growth 2023-2028 (%)
- 9.10 UK - Market size and forecast 2023-2028
- Chart on UK - Market size and forecast 2023-2028 ($ million)
- Data Table on UK - Market size and forecast 2023-2028 ($ million)
- Chart on UK - Year-over-year growth 2023-2028 (%)
- Data Table on UK - Year-over-year growth 2023-2028 (%)
- 9.11 Germany - Market size and forecast 2023-2028
- Chart on Germany - Market size and forecast 2023-2028 ($ million)
- Data Table on Germany - Market size and forecast 2023-2028 ($ million)
- Chart on Germany - Year-over-year growth 2023-2028 (%)
- Data Table on Germany - Year-over-year growth 2023-2028 (%)
- 9.12 India - Market size and forecast 2023-2028
- Chart on India - Market size and forecast 2023-2028 ($ million)
- Data Table on India - Market size and forecast 2023-2028 ($ million)
- Chart on India - Year-over-year growth 2023-2028 (%)
- Data Table on India - Year-over-year growth 2023-2028 (%)
- 9.13 Market opportunity by geography
- Market opportunity By Geographical Landscape($ million)
- Data Tables on Market opportunity By Geographical Landscape($ million)
10 Drivers, Challenges, and Opportunity/Restraints
- 10.1 Market drivers
- 10.2 Market challenges
- 10.3 Impact of drivers and challenges
- Impact of drivers and challenges in 2023 and 2028
- 10.4 Market opportunities/restraints
11 Competitive Landscape
- 11.1 Overview
- 11.2 Competitive Landscape
- Overview on criticality of inputs and factors of differentiation
- 11.3 Landscape disruption
- Overview on factors of disruption
- 11.4 Industry risks
- Impact of key risks on business
12 Competitive Analysis
- 12.1 Companies profiled
- Companies covered
- 12.2 Market positioning of companies
- Matrix on companies position and classification
- 12.3 Adobe Inc.
- Adobe Inc. - Overview
- Adobe Inc. - Business segments
- Adobe Inc. - Key news
- Adobe Inc. - Key offerings
- Adobe Inc. - Segment focus
- 12.4 City and Guilds Group
- City and Guilds Group - Overview
- City and Guilds Group - Product / Service
- City and Guilds Group - Key offerings
- 12.5 D2L Inc.
- D2L Inc. - Overview
- D2L Inc. - Product / Service
- D2L Inc. - Key news
- D2L Inc. - Key offerings
- 12.6 Docebo Inc.
- Docebo Inc. - Overview
- Docebo Inc. - Product / Service
- Docebo Inc. - Key offerings
- 12.7 Educomp Solutions Ltd.
- Educomp Solutions Ltd. - Overview
- Educomp Solutions Ltd. - Product / Service
- Educomp Solutions Ltd. - Key offerings
- 12.8 Epignosis LLC
- Epignosis LLC - Overview
- Epignosis LLC - Product / Service
- Epignosis LLC - Key offerings
- 12.9 Novac Learning
- Novac Learning - Overview
- Novac Learning - Product / Service
- Novac Learning - Key offerings
- 12.10 Pearson Plc
- Pearson Plc - Overview
- Pearson Plc - Business segments
- Pearson Plc - Key news
- Pearson Plc - Key offerings
- Pearson Plc - Segment focus
- 12.11 Platinum Equity Advisors LLC
- Platinum Equity Advisors LLC - Overview
- Platinum Equity Advisors LLC - Product / Service
- Platinum Equity Advisors LLC - Key offerings
- 12.12 PowerSchool Holdings Inc.
- PowerSchool Holdings Inc. - Overview
- PowerSchool Holdings Inc. - Product / Service
- PowerSchool Holdings Inc. - Key news
- PowerSchool Holdings Inc. - Key offerings
- 12.13 Providence Equity Partners LLC
- Providence Equity Partners LLC - Overview
- Providence Equity Partners LLC - Product / Service
- Providence Equity Partners LLC - Key offerings
- 12.14 Litmos US L.P.
- Litmos US L.P. - Overview
- Litmos US L.P. - Product / Service
- Litmos US L.P. - Key offerings
- 12.15 Simplilearn
- Simplilearn - Overview
- Simplilearn - Product / Service
- Simplilearn - Key offerings
- 12.16 Thoma Bravo LP
- Thoma Bravo LP - Overview
- Thoma Bravo LP - Product / Service
- Thoma Bravo LP - Key offerings
- 12.17 Thought Industries
- Thought Industries - Overview
- Thought Industries - Product / Service
- Thought Industries - Key offerings
13 Appendix
- 13.1 Scope of the report
- 13.2 Inclusions and exclusions checklist
- Inclusions checklist
- Exclusions checklist
- 13.3 Currency conversion rates for US$
- Currency conversion rates for US$
- 13.4 Research methodology
- Research methodology
- 13.5 Data procurement
- Information sources
- 13.6 Data validation
- Data validation
- 13.7 Validation techniques employed for market sizing
- Validation techniques employed for market sizing
- 13.8 Data synthesis
- Data synthesis
- 13.9 360 degree market analysis
- 360 degree market analysis
- 13.10 List of abbreviations
- List of abbreviations

