|
|
市場調査レポート
商品コード
1681163
オンライン玩具・ゲーム小売の世界市場 2025~2029年Global Online Toys and Games Retailing Market 2025-2029 |
||||||

|
|||||||
カスタマイズ可能
|
|||||||


| オンライン玩具・ゲーム小売の世界市場 2025~2029年 |
|
出版日: 2025年03月01日
発行: TechNavio
ページ情報: 英文 249 Pages
納期: 即納可能
|

全表示
- 概要
- 目次
オンライン玩具・ゲーム小売市場は2024~2029年に331億9,770万米ドル、予測期間中のCAGRは8.7%で成長すると予測されます。
当レポートでは、オンライン玩具・ゲーム小売市場の全体的な分析、市場規模・予測、動向、成長促進要因、課題、約25のベンダーを網羅したベンダー分析などを掲載しています。
現在の市場シナリオ、最新動向と促進要因、市場環境全体に関する最新分析を提供しています。市場は、多目的玩具やゲーム、モバイルゲームと従来型ゲームの同期、映画や番組の影響力の増大などの需要の増加が牽引しています。
| 市場範囲 | |
|---|---|
| 基準年 | 2025年 |
| 終了年 | 2029年 |
| 予測期間 | 2025~2029年 |
| 成長モメンタム | 加速 |
| 前年比2025年 | 7.4% |
| CAGR | 8.7% |
| 増分額 | 331億9,770万米ドル |
本調査は、業界の主要参加者からのインプットを含め、一次情報と二次情報を客観的に組み合わせて実施しました。レポートには、主要企業の分析に加え、包括的な市場規模データ、地域分析によるセグメント、ベンダー情勢が含まれています。レポートには過去データと予測データがあります。
本調査では、今後数年間におけるオンライン玩具・ゲーム小売市場の成長を促進する主な要因の一つとして、世界市場における新興技術を挙げています。また、持続可能で環境に優しい玩具や3Dプリンティングの台頭は、市場の大きな需要につながります。
目次
第1章 エグゼクティブサマリー
- 市場概要
第2章 Technavio分析
- 価格・ライフサイクル・顧客購入バスケット・採用率・購入基準の分析
- インプットの重要性と差別化の要因
- 混乱の要因
- 促進要因と課題の影響
第3章 市場情勢
- 市場エコシステム
- 市場の特徴
- バリューチェーン分析
第4章 市場規模
- 市場の定義
- 市場セグメント分析
- 市場規模 2024年
- 市場展望 2024~2029年
第5章 市場規模実績
- オンライン玩具・ゲーム小売の世界市場 2019~2023年
- 製品別セグメント分析 2019~2023年
- 用途別セグメント分析 2019~2023年
- 価格帯別セグメント分析 2019~2023年
- 素材別セグメント分析 2019~2023年
- 地域別セグメント分析 2019~2023年
- 国別セグメント分析 2019~2023年
第6章 定性分析
- AIの影響:オンライン玩具・ゲーム小売の世界市場
第7章 ファイブフォース分析
- ファイブフォースの要約
- 買い手の交渉力
- 供給企業の交渉力
- 新規参入業者の脅威
- 代替品の脅威
- 競争の脅威
- 市況
第8章 市場セグメンテーション:製品別
- 市場セグメント
- 比較:製品別
- アクティビティ玩具・乗用玩具:市場規模と予測 2024~2029年
- 幼児・就学前児童向け玩具:市場規模と予測 2024~2029年
- ぬいぐるみ:市場規模と予測 2024~2029年
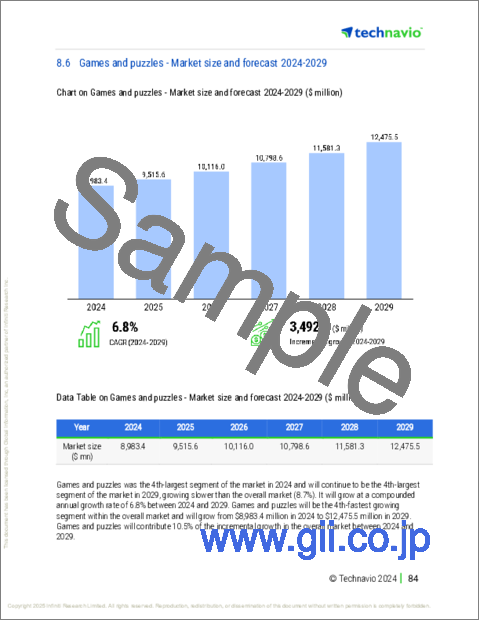
- ゲーム・パズル:市場規模と予測 2024~2029年
- その他:市場規模と予測 2024~2029年
- 市場機会:製品別
第9章 市場セグメンテーション:用途別
- 市場セグメント
- 比較:用途別
- 学齢期の子供・十代の若者:市場規模と予測 2024~2029年
- 乳幼児:市場規模と予測 2024~2029年
- 市場機会:用途別
第10章 市場セグメンテーション:価格帯別
- 市場セグメント
- 比較:価格帯別
- エコノミー:市場規模と予測 2024~2029年
- ミッドレンジ:市場規模と予測 2024~2029年
- プレミアム:市場規模と予測 2024~2029年
- 市場機会:価格帯別
第11章 市場セグメンテーション:素材別
- 市場セグメント
- 比較:素材別
- プラスチック:市場規模と予測 2024~2029年
- 電子部品:市場規模と予測 2024~2029年
- 木材:市場規模と予測 2024~2029年
- ハイブリッド材料:市場規模と予測 2024~2029年
- その他:市場規模と予測 2024~2029年
- 市場機会:素材別
第12章 顧客情勢
- 顧客情勢の概要
第13章 地域別情勢
- 地域別セグメンテーション
- 地域別比較
- アジア太平洋:市場規模と予測 2024~2029年
- 北米:市場規模と予測 2024~2029年
- 欧州:市場規模と予測 2024~2029年
- 南米:市場規模と予測 2024~2029年
- 中東・アフリカ:市場規模と予測 2024~2029年
- 米国:市場規模と予測 2024~2029年
- 中国:市場規模と予測 2024~2029年
- カナダ:市場規模と予測 2024~2029年
- 日本:市場規模と予測 2024~2029年
- インド:市場規模と予測 2024~2029年
- 英国:市場規模と予測 2024~2029年
- ドイツ:市場規模と予測 2024~2029年
- 韓国:市場規模と予測 2024~2029年
- フランス:市場規模と予測 2024~2029年
- イタリア:市場規模と予測 2024~2029年
- 市場機会:地域情勢別
第14章 促進要因・課題・機会・抑制要因
- 市場促進要因
- 市場の課題
- 促進要因と課題の影響
- 市場の機会・抑制要因
第15章 競合情勢
- 概要
- 競合情勢
- 混乱の状況
- 業界のリスク
第16章 競合分析
- 企業プロファイル
- 企業ランキング指数
- 企業の市場ポジショニング
- Aldi Stores Ltd.
- Amazon.com Inc.
- BFL Group
- Fat Brain Toys LLC
- Fishpond Ltd.
- Kohls Inc
- LEGO System AS
- Mattel Inc.
- Nordstrom Inc.
- Qurate Retail Inc.
- Reliance Industries Ltd.
- Takara Tomy Co. Ltd.
- The Walt Disney Co.
- Tru Kids Brand
- UncommonGoods LLC
第17章 付録
The online toys and games retailing market is forecasted to grow by USD 33197.7 million during 2024-2029, accelerating at a CAGR of 8.7% during the forecast period. The report on the online toys and games retailing market provides a holistic analysis, market size and forecast, trends, growth drivers, and challenges, as well as vendor analysis covering around 25 vendors.
The report offers an up-to-date analysis regarding the current market scenario, the latest trends and drivers, and the overall market environment. The market is driven by the increasing demand for multipurpose toys and games, in-sync mobile and traditional games, and growing influence of movies and shows.
| Market Scope | |
|---|---|
| Base Year | 2025 |
| End Year | 2029 |
| Series Year | 2025-2029 |
| Growth Momentum | Accelerate |
| YOY 2025 | 7.4% |
| CAGR | 8.7% |
| Incremental Value | $33197.7 mn |
The study was conducted using an objective combination of primary and secondary information including inputs from key participants in the industry. The report contains a comprehensive market size data, segment with regional analysis and vendor landscape in addition to an analysis of the key companies. Reports have historic and forecast data.
Technavio's online toys and games retailing market is segmented as below:
By Product
- Activity and ride-on toys
- Infant and pre-school toys
- Plush toys
- Games and puzzles
- Others
By Application
- School age children and teens
- Infants and toddlers
By Price Range
- Economy
- Mid-range
- Premium
By Material
- Plastic
- Electronic components
- Wood
- Hybrid materials
- Others
By Geographical Landscape
- APAC
- North America
- Europe
- South America
- Middle East and Africa
This study identifies the emerging technologies in global market as one of the prime reasons driving the online toys and games retailing market growth during the next few years. Also, sustainable and environmentally friendly toys and emergence of 3d printing will lead to sizable demand in the market.
The report on the online toys and games retailing market covers the following areas:
- Online Toys And Games Retailing Market sizing
- Online Toys And Games Retailing Market forecast
- Online Toys And Games Retailing Market industry analysis
The robust vendor analysis is designed to help clients improve their market position, and in line with this, this report provides a detailed analysis of several leading online toys and games retailing market vendors that include Aldi Stores Ltd., Alpha Group Animation, Amazon.com Inc., BFL Group, Fat Brain Toys LLC, Fishpond Ltd., Hasbro Inc., Kidding Around Toys, Kohls Inc, Le Toys Van Inc, LEGO System AS, Mary Arnold Toys, Mattel Inc., Nordstrom Inc., Qurate Retail Inc., Ravensburger AG, Reliance Industries Ltd., Shumee, Simba Dickie Group GmbH, Snooplay, Takara Tomy Co. Ltd., The Walt Disney Co., TinToyArcade.com LLC, Toy Cra, Tru Kids Brand, UncommonGoods LLC, and Uttam Toys. Also, the online toys and games retailing market analysis report includes information on upcoming trends and challenges that will influence market growth. This is to help companies strategize and leverage all forthcoming growth opportunities.
The publisher presents a detailed picture of the market by the way of study, synthesis, and summation of data from multiple sources by an analysis of key parameters such as profit, pricing, competition, and promotions. It presents various market facets by identifying the key industry influencers. The data presented is comprehensive, reliable, and a result of extensive primary and secondary research. The market research reports provide a complete competitive landscape and an in-depth vendor selection methodology and analysis using qualitative and quantitative research to forecast accurate market growth.
Table of Contents
1 Executive Summary
- 1.1 Market overview
- Executive Summary - Chart on Market Overview
- Executive Summary - Data Table on Market Overview
- Executive Summary - Chart on Global Market Characteristics
- Executive Summary - Chart on Market By Geographical Landscape
- Executive Summary - Chart on Market Segmentation by Product
- Executive Summary - Chart on Market Segmentation by Application
- Executive Summary - Chart on Market Segmentation by Price Range
- Executive Summary - Chart on Market Segmentation by Material
- Executive Summary - Chart on Incremental Growth
- Executive Summary - Data Table on Incremental Growth
- Executive Summary - Chart on Company Market Positioning
2 Technavio Analysis
- 2.1 Analysis of price sensitivity, lifecycle, customer purchase basket, adoption rates, and purchase criteria
- Analysis of price sensitivity, lifecycle, customer purchase basket, adoption rates, and purchase criteria
- 2.2 Criticality of inputs and Factors of differentiation
- Overview on criticality of inputs and factors of differentiation
- 2.3 Factors of disruption
- Overview on factors of disruption
- 2.4 Impact of drivers and challenges
- Impact of drivers and challenges in 2024 and 2029
3 Market Landscape
- 3.1 Market ecosystem
- Parent Market
- Data Table on - Parent Market
- 3.2 Market characteristics
- Market characteristics analysis
- 3.3 Value chain analysis
- Value chain analysis
4 Market Sizing
- 4.1 Market definition
- Offerings of companies included in the market definition
- 4.2 Market segment analysis
- Market segments
- 4.3 Market size 2024
- 4.4 Market outlook: Forecast for 2024-2029
- Chart on Global - Market size and forecast 2024-2029 ($ million)
- Data Table on Global - Market size and forecast 2024-2029 ($ million)
- Chart on Global Market: Year-over-year growth 2024-2029 (%)
- Data Table on Global Market: Year-over-year growth 2024-2029 (%)
5 Historic Market Size
- 5.1 Global Online Toys And Games Retailing Market 2019 - 2023
- Historic Market Size - Data Table on Global Online Toys And Games Retailing Market 2019 - 2023 ($ million)
- 5.2 Product segment analysis 2019 - 2023
- Historic Market Size - Product Segment 2019 - 2023 ($ million)
- 5.3 Application segment analysis 2019 - 2023
- Historic Market Size - Application Segment 2019 - 2023 ($ million)
- 5.4 Price Range segment analysis 2019 - 2023
- Historic Market Size - Price Range Segment 2019 - 2023 ($ million)
- 5.5 Material segment analysis 2019 - 2023
- Historic Market Size - Material Segment 2019 - 2023 ($ million)
- 5.6 Geography segment analysis 2019 - 2023
- Historic Market Size - Geography Segment 2019 - 2023 ($ million)
- 5.7 Country segment analysis 2019 - 2023
- Historic Market Size - Country Segment 2019 - 2023 ($ million)
6 Qualitative Analysis
- 6.1 AI impact on global online toys and games retailing
7 Five Forces Analysis
- 7.1 Five forces summary
- Five forces analysis - Comparison between 2024 and 2029
- 7.2 Bargaining power of buyers
- Bargaining power of buyers - Impact of key factors 2024 and 2029
- 7.3 Bargaining power of suppliers
- Bargaining power of suppliers - Impact of key factors in 2024 and 2029
- 7.4 Threat of new entrants
- Threat of new entrants - Impact of key factors in 2024 and 2029
- 7.5 Threat of substitutes
- Threat of substitutes - Impact of key factors in 2024 and 2029
- 7.6 Threat of rivalry
- Threat of rivalry - Impact of key factors in 2024 and 2029
- 7.7 Market condition
- Chart on Market condition - Five forces 2024 and 2029
8 Market Segmentation by Product
- 8.1 Market segments
- Chart on Product - Market share 2024-2029 (%)
- Data Table on Product - Market share 2024-2029 (%)
- 8.2 Comparison by Product
- Chart on Comparison by Product
- Data Table on Comparison by Product
- 8.3 Activity and ride-on toys - Market size and forecast 2024-2029
- Chart on Activity and ride-on toys - Market size and forecast 2024-2029 ($ million)
- Data Table on Activity and ride-on toys - Market size and forecast 2024-2029 ($ million)
- Chart on Activity and ride-on toys - Year-over-year growth 2024-2029 (%)
- Data Table on Activity and ride-on toys - Year-over-year growth 2024-2029 (%)
- 8.4 Infant and pre-school toys - Market size and forecast 2024-2029
- Chart on Infant and pre-school toys - Market size and forecast 2024-2029 ($ million)
- Data Table on Infant and pre-school toys - Market size and forecast 2024-2029 ($ million)
- Chart on Infant and pre-school toys - Year-over-year growth 2024-2029 (%)
- Data Table on Infant and pre-school toys - Year-over-year growth 2024-2029 (%)
- 8.5 Plush toys - Market size and forecast 2024-2029
- Chart on Plush toys - Market size and forecast 2024-2029 ($ million)
- Data Table on Plush toys - Market size and forecast 2024-2029 ($ million)
- Chart on Plush toys - Year-over-year growth 2024-2029 (%)
- Data Table on Plush toys - Year-over-year growth 2024-2029 (%)
- 8.6 Games and puzzles - Market size and forecast 2024-2029
- Chart on Games and puzzles - Market size and forecast 2024-2029 ($ million)
- Data Table on Games and puzzles - Market size and forecast 2024-2029 ($ million)
- Chart on Games and puzzles - Year-over-year growth 2024-2029 (%)
- Data Table on Games and puzzles - Year-over-year growth 2024-2029 (%)
- 8.7 Others - Market size and forecast 2024-2029
- Chart on Others - Market size and forecast 2024-2029 ($ million)
- Data Table on Others - Market size and forecast 2024-2029 ($ million)
- Chart on Others - Year-over-year growth 2024-2029 (%)
- Data Table on Others - Year-over-year growth 2024-2029 (%)
- 8.8 Market opportunity by Product
- Market opportunity by Product ($ million)
- Data Table on Market opportunity by Product ($ million)
9 Market Segmentation by Application
- 9.1 Market segments
- Chart on Application - Market share 2024-2029 (%)
- Data Table on Application - Market share 2024-2029 (%)
- 9.2 Comparison by Application
- Chart on Comparison by Application
- Data Table on Comparison by Application
- 9.3 School age children and teens - Market size and forecast 2024-2029
- Chart on School age children and teens - Market size and forecast 2024-2029 ($ million)
- Data Table on School age children and teens - Market size and forecast 2024-2029 ($ million)
- Chart on School age children and teens - Year-over-year growth 2024-2029 (%)
- Data Table on School age children and teens - Year-over-year growth 2024-2029 (%)
- 9.4 Infants and toddlers - Market size and forecast 2024-2029
- Chart on Infants and toddlers - Market size and forecast 2024-2029 ($ million)
- Data Table on Infants and toddlers - Market size and forecast 2024-2029 ($ million)
- Chart on Infants and toddlers - Year-over-year growth 2024-2029 (%)
- Data Table on Infants and toddlers - Year-over-year growth 2024-2029 (%)
- 9.5 Market opportunity by Application
- Market opportunity by Application ($ million)
- Data Table on Market opportunity by Application ($ million)
10 Market Segmentation by Price Range
- 10.1 Market segments
- Chart on Price Range - Market share 2024-2029 (%)
- Data Table on Price Range - Market share 2024-2029 (%)
- 10.2 Comparison by Price Range
- Chart on Comparison by Price Range
- Data Table on Comparison by Price Range
- 10.3 Economy - Market size and forecast 2024-2029
- Chart on Economy - Market size and forecast 2024-2029 ($ million)
- Data Table on Economy - Market size and forecast 2024-2029 ($ million)
- Chart on Economy - Year-over-year growth 2024-2029 (%)
- Data Table on Economy - Year-over-year growth 2024-2029 (%)
- 10.4 Mid-range - Market size and forecast 2024-2029
- Chart on Mid-range - Market size and forecast 2024-2029 ($ million)
- Data Table on Mid-range - Market size and forecast 2024-2029 ($ million)
- Chart on Mid-range - Year-over-year growth 2024-2029 (%)
- Data Table on Mid-range - Year-over-year growth 2024-2029 (%)
- 10.5 Premium - Market size and forecast 2024-2029
- Chart on Premium - Market size and forecast 2024-2029 ($ million)
- Data Table on Premium - Market size and forecast 2024-2029 ($ million)
- Chart on Premium - Year-over-year growth 2024-2029 (%)
- Data Table on Premium - Year-over-year growth 2024-2029 (%)
- 10.6 Market opportunity by Price Range
- Market opportunity by Price Range ($ million)
- Data Table on Market opportunity by Price Range ($ million)
11 Market Segmentation by Material
- 11.1 Market segments
- Chart on Material - Market share 2024-2029 (%)
- Data Table on Material - Market share 2024-2029 (%)
- 11.2 Comparison by Material
- Chart on Comparison by Material
- Data Table on Comparison by Material
- 11.3 Plastic - Market size and forecast 2024-2029
- Chart on Plastic - Market size and forecast 2024-2029 ($ million)
- Data Table on Plastic - Market size and forecast 2024-2029 ($ million)
- Chart on Plastic - Year-over-year growth 2024-2029 (%)
- Data Table on Plastic - Year-over-year growth 2024-2029 (%)
- 11.4 Electronic components - Market size and forecast 2024-2029
- Chart on Electronic components - Market size and forecast 2024-2029 ($ million)
- Data Table on Electronic components - Market size and forecast 2024-2029 ($ million)
- Chart on Electronic components - Year-over-year growth 2024-2029 (%)
- Data Table on Electronic components - Year-over-year growth 2024-2029 (%)
- 11.5 Wood - Market size and forecast 2024-2029
- Chart on Wood - Market size and forecast 2024-2029 ($ million)
- Data Table on Wood - Market size and forecast 2024-2029 ($ million)
- Chart on Wood - Year-over-year growth 2024-2029 (%)
- Data Table on Wood - Year-over-year growth 2024-2029 (%)
- 11.6 Hybrid materials - Market size and forecast 2024-2029
- Chart on Hybrid materials - Market size and forecast 2024-2029 ($ million)
- Data Table on Hybrid materials - Market size and forecast 2024-2029 ($ million)
- Chart on Hybrid materials - Year-over-year growth 2024-2029 (%)
- Data Table on Hybrid materials - Year-over-year growth 2024-2029 (%)
- 11.7 Others - Market size and forecast 2024-2029
- Chart on Others - Market size and forecast 2024-2029 ($ million)
- Data Table on Others - Market size and forecast 2024-2029 ($ million)
- Chart on Others - Year-over-year growth 2024-2029 (%)
- Data Table on Others - Year-over-year growth 2024-2029 (%)
- 11.8 Market opportunity by Material
- Market opportunity by Material ($ million)
- Data Table on Market opportunity by Material ($ million)
12 Customer Landscape
- 12.1 Customer landscape overview
- Analysis of price sensitivity, lifecycle, customer purchase basket, adoption rates, and purchase criteria
13 Geographic Landscape
- 13.1 Geographic segmentation
- Chart on Market share By Geographical Landscape 2024-2029 (%)
- Data Table on Market share By Geographical Landscape 2024-2029 (%)
- 13.2 Geographic comparison
- Chart on Geographic comparison
- Data Table on Geographic comparison
- 13.3 APAC - Market size and forecast 2024-2029
- Chart on APAC - Market size and forecast 2024-2029 ($ million)
- Data Table on APAC - Market size and forecast 2024-2029 ($ million)
- Chart on APAC - Year-over-year growth 2024-2029 (%)
- Data Table on APAC - Year-over-year growth 2024-2029 (%)
- 13.4 North America - Market size and forecast 2024-2029
- Chart on North America - Market size and forecast 2024-2029 ($ million)
- Data Table on North America - Market size and forecast 2024-2029 ($ million)
- Chart on North America - Year-over-year growth 2024-2029 (%)
- Data Table on North America - Year-over-year growth 2024-2029 (%)
- 13.5 Europe - Market size and forecast 2024-2029
- Chart on Europe - Market size and forecast 2024-2029 ($ million)
- Data Table on Europe - Market size and forecast 2024-2029 ($ million)
- Chart on Europe - Year-over-year growth 2024-2029 (%)
- Data Table on Europe - Year-over-year growth 2024-2029 (%)
- 13.6 South America - Market size and forecast 2024-2029
- Chart on South America - Market size and forecast 2024-2029 ($ million)
- Data Table on South America - Market size and forecast 2024-2029 ($ million)
- Chart on South America - Year-over-year growth 2024-2029 (%)
- Data Table on South America - Year-over-year growth 2024-2029 (%)
- 13.7 Middle East and Africa - Market size and forecast 2024-2029
- Chart on Middle East and Africa - Market size and forecast 2024-2029 ($ million)
- Data Table on Middle East and Africa - Market size and forecast 2024-2029 ($ million)
- Chart on Middle East and Africa - Year-over-year growth 2024-2029 (%)
- Data Table on Middle East and Africa - Year-over-year growth 2024-2029 (%)
- 13.8 US - Market size and forecast 2024-2029
- Chart on US - Market size and forecast 2024-2029 ($ million)
- Data Table on US - Market size and forecast 2024-2029 ($ million)
- Chart on US - Year-over-year growth 2024-2029 (%)
- Data Table on US - Year-over-year growth 2024-2029 (%)
- 13.9 China - Market size and forecast 2024-2029
- Chart on China - Market size and forecast 2024-2029 ($ million)
- Data Table on China - Market size and forecast 2024-2029 ($ million)
- Chart on China - Year-over-year growth 2024-2029 (%)
- Data Table on China - Year-over-year growth 2024-2029 (%)
- 13.10 Canada - Market size and forecast 2024-2029
- Chart on Canada - Market size and forecast 2024-2029 ($ million)
- Data Table on Canada - Market size and forecast 2024-2029 ($ million)
- Chart on Canada - Year-over-year growth 2024-2029 (%)
- Data Table on Canada - Year-over-year growth 2024-2029 (%)
- 13.11 Japan - Market size and forecast 2024-2029
- Chart on Japan - Market size and forecast 2024-2029 ($ million)
- Data Table on Japan - Market size and forecast 2024-2029 ($ million)
- Chart on Japan - Year-over-year growth 2024-2029 (%)
- Data Table on Japan - Year-over-year growth 2024-2029 (%)
- 13.12 India - Market size and forecast 2024-2029
- Chart on India - Market size and forecast 2024-2029 ($ million)
- Data Table on India - Market size and forecast 2024-2029 ($ million)
- Chart on India - Year-over-year growth 2024-2029 (%)
- Data Table on India - Year-over-year growth 2024-2029 (%)
- 13.13 UK - Market size and forecast 2024-2029
- Chart on UK - Market size and forecast 2024-2029 ($ million)
- Data Table on UK - Market size and forecast 2024-2029 ($ million)
- Chart on UK - Year-over-year growth 2024-2029 (%)
- Data Table on UK - Year-over-year growth 2024-2029 (%)
- 13.14 Germany - Market size and forecast 2024-2029
- Chart on Germany - Market size and forecast 2024-2029 ($ million)
- Data Table on Germany - Market size and forecast 2024-2029 ($ million)
- Chart on Germany - Year-over-year growth 2024-2029 (%)
- Data Table on Germany - Year-over-year growth 2024-2029 (%)
- 13.15 South Korea - Market size and forecast 2024-2029
- Chart on South Korea - Market size and forecast 2024-2029 ($ million)
- Data Table on South Korea - Market size and forecast 2024-2029 ($ million)
- Chart on South Korea - Year-over-year growth 2024-2029 (%)
- Data Table on South Korea - Year-over-year growth 2024-2029 (%)
- 13.16 France - Market size and forecast 2024-2029
- Chart on France - Market size and forecast 2024-2029 ($ million)
- Data Table on France - Market size and forecast 2024-2029 ($ million)
- Chart on France - Year-over-year growth 2024-2029 (%)
- Data Table on France - Year-over-year growth 2024-2029 (%)
- 13.17 Italy - Market size and forecast 2024-2029
- Chart on Italy - Market size and forecast 2024-2029 ($ million)
- Data Table on Italy - Market size and forecast 2024-2029 ($ million)
- Chart on Italy - Year-over-year growth 2024-2029 (%)
- Data Table on Italy - Year-over-year growth 2024-2029 (%)
- 13.18 Market opportunity By Geographical Landscape
- Market opportunity By Geographical Landscape ($ million)
- Data Tables on Market opportunity By Geographical Landscape ($ million)
14 Drivers, Challenges, and Opportunity/Restraints
- 14.1 Market drivers
- 14.2 Market challenges
- 14.3 Impact of drivers and challenges
- Impact of drivers and challenges in 2024 and 2029
- 14.4 Market opportunities/restraints
15 Competitive Landscape
- 15.1 Overview
- 15.2 Competitive Landscape
- Overview on criticality of inputs and factors of differentiation
- 15.3 Landscape disruption
- Overview on factors of disruption
- 15.4 Industry risks
- Impact of key risks on business
16 Competitive Analysis
- 16.1 Companies profiled
- Companies covered
- 16.2 Company ranking index
- Company ranking index
- 16.3 Market positioning of companies
- Matrix on companies position and classification
- 16.4 Aldi Stores Ltd.
- Aldi Stores Ltd. - Overview
- Aldi Stores Ltd. - Product / Service
- Aldi Stores Ltd. - Key offerings
- SWOT
- 16.5 Amazon.com Inc.
- Amazon.com Inc. - Overview
- Amazon.com Inc. - Business segments
- Amazon.com Inc. - Key news
- Amazon.com Inc. - Key offerings
- Amazon.com Inc. - Segment focus
- SWOT
- 16.6 BFL Group
- BFL Group - Overview
- BFL Group - Product / Service
- BFL Group - Key news
- BFL Group - Key offerings
- SWOT
- 16.7 Fat Brain Toys LLC
- Fat Brain Toys LLC - Overview
- Fat Brain Toys LLC - Product / Service
- Fat Brain Toys LLC - Key offerings
- SWOT
- 16.8 Fishpond Ltd.
- Fishpond Ltd. - Overview
- Fishpond Ltd. - Product / Service
- Fishpond Ltd. - Key offerings
- SWOT
- 16.9 Kohls Inc
- Kohls Inc - Overview
- Kohls Inc - Product / Service
- Kohls Inc - Key news
- Kohls Inc - Key offerings
- SWOT
- 16.10 LEGO System AS
- LEGO System AS - Overview
- LEGO System AS - Product / Service
- LEGO System AS - Key news
- LEGO System AS - Key offerings
- SWOT
- 16.11 Mattel Inc.
- Mattel Inc. - Overview
- Mattel Inc. - Business segments
- Mattel Inc. - Key news
- Mattel Inc. - Key offerings
- Mattel Inc. - Segment focus
- SWOT
- 16.12 Nordstrom Inc.
- Nordstrom Inc. - Overview
- Nordstrom Inc. - Product / Service
- Nordstrom Inc. - Key offerings
- SWOT
- 16.13 Qurate Retail Inc.
- Qurate Retail Inc. - Overview
- Qurate Retail Inc. - Business segments
- Qurate Retail Inc. - Key offerings
- Qurate Retail Inc. - Segment focus
- SWOT
- 16.14 Reliance Industries Ltd.
- Reliance Industries Ltd. - Overview
- Reliance Industries Ltd. - Business segments
- Reliance Industries Ltd. - Key news
- Reliance Industries Ltd. - Key offerings
- Reliance Industries Ltd. - Segment focus
- SWOT
- 16.15 Takara Tomy Co. Ltd.
- Takara Tomy Co. Ltd. - Overview
- Takara Tomy Co. Ltd. - Product / Service
- Takara Tomy Co. Ltd. - Key offerings
- SWOT
- 16.16 The Walt Disney Co.
- The Walt Disney Co. - Overview
- The Walt Disney Co. - Business segments
- The Walt Disney Co. - Key news
- The Walt Disney Co. - Key offerings
- The Walt Disney Co. - Segment focus
- SWOT
- 16.17 Tru Kids Brand
- Tru Kids Brand - Overview
- Tru Kids Brand - Product / Service
- Tru Kids Brand - Key offerings
- SWOT
- 16.18 UncommonGoods LLC
- UncommonGoods LLC - Overview
- UncommonGoods LLC - Product / Service
- UncommonGoods LLC - Key offerings
- SWOT
17 Appendix
- 17.1 Scope of the report
- 17.2 Inclusions and exclusions checklist
- Inclusions checklist
- Exclusions checklist
- 17.3 Currency conversion rates for US$
- Currency conversion rates for US$
- 17.4 Research methodology
- Research methodology
- 17.5 Data procurement
- Information sources
- 17.6 Data validation
- Data validation
- 17.7 Validation techniques employed for market sizing
- Validation techniques employed for market sizing
- 17.8 Data synthesis
- Data synthesis
- 17.9 360 degree market analysis
- 360 degree market analysis
- 17.10 List of abbreviations
- List of abbreviations

