|
|
市場調査レポート
商品コード
1517247
グルタミン酸ナトリウム(MSG)の世界市場 2024-2028Global Monosodium Glutamate (MSG) market 2024-2028 |
||||||

|
|||||||
カスタマイズ可能
|
|||||||


| グルタミン酸ナトリウム(MSG)の世界市場 2024-2028 |
|
出版日: 2024年06月12日
発行: TechNavio
ページ情報: 英文 195 Pages
納期: 即納可能
|

全表示
- 概要
- 図表
- 目次
グルタミン酸ナトリウム(MSG)市場は2023-2028年に16億4,240万米ドル、予測期間中のCAGRは5.52%で成長すると予測されます。
当レポートでは、グルタミン酸ナトリウム(MSG)市場の全体的な分析、市場規模・予測、動向、成長促進要因、課題、約25のベンダーを網羅したベンダー分析などを掲載しています。
現在の市場シナリオ、最新動向と促進要因、市場環境全体に関する最新分析を提供しています。MSGに対する認識と受容の高まり、ベンダーによるMSGの戦略的マーケティングと製品イノベーション、アジア料理の人気の高まりなどが市場を牽引しています。
| 市場範囲 | |
|---|---|
| 基準年 | 2024 |
| 終了年 | 2028 |
| 予測期間 | 2024-2028 |
| 成長モメンタム | 加速 |
| 前年比2024年 | 4.83% |
| CAGR | 5.52% |
| 増分額 | 16億4,240万米ドル |
本調査では、MSG用途の拡大が今後数年間のグルタミン酸ナトリウム(MSG)市場成長を牽引する主要因の一つであると特定しています。また、MSGの持続可能で倫理的な調達に重点が置かれるようになり、MSG製造における発酵と生産技術の進歩が市場の大きな需要につながります。
目次
第1章 エグゼクティブサマリー
- 市場概要
第2章 Technavio分析
- 価格・ライフサイクル・顧客購入バスケット・採用率・購入基準の分析
- インプットの重要性と差別化の要因
- 混乱の要因
- 促進要因と課題の影響
第3章 市場情勢
- 市場エコシステム
- 市場の特徴
- バリューチェーン分析
第4章 市場規模の評価
- 市場の定義
- 市場セグメント分析
- 市場規模 2023
- 市場の見通し 2023-2028
第5章 市場規模実績
- 世界グルタミン酸ナトリウム(MSG)市場 2018-2022
- 流通チャネル別セグメント分析 2018-2022
- エンドユーザー別セグメント分析 2018-2022
- 地域別セグメント分析 2018-2022
- 国別セグメント分析 2018-2022
第6章 ファイブフォース分析
- ファイブフォースの要約
- 買い手の交渉力
- 供給企業の交渉力
- 新規参入業者の脅威
- 代替品の脅威
- 競争の脅威
- 市況
第7章 市場セグメンテーション:流通チャネル別
- 市場セグメンテーション
- 比較:流通チャネル別
- オフライン:市場規模と予測 2023-2028
- オンライン:市場規模と予測 2023-2028
- 市場機会:流通チャネル別
第8章 市場セグメンテーション:エンドユーザー別
- 市場セグメンテーション
- 比較:エンドユーザー別
- 食品加工産業:市場規模と予測 2023-2028
- ホテル:市場規模と予測 2023-2028
- 施設内飲食サービス:市場規模と予測 2023-2028
- 直接消費者:市場規模と予測 2023-2028
- 市場機会:エンドユーザー別
第9章 顧客情勢
- 顧客情勢の概要
第10章 地域別情勢
- 地域別セグメンテーション
- 地域別比較
- アジア太平洋:市場規模と予測 2023-2028
- 中東・アフリカ:市場規模と予測 2023-2028
- 欧州:市場規模と予測 2023-2028
- 北米:市場規模と予測 2023-2028
- 南米:市場規模と予測 2023-2028
- 中国:市場規模と予測 2023-2028
- 日本:市場規模と予測 2023-2028
- インドネシア:市場規模と予測 2023-2028
- インド:市場規模と予測 2023-2028
- タイ:市場規模と予測 2023-2028
- 市場機会:地域情勢別
第11章 促進要因・課題・機会・抑制要因
- 市場促進要因
- 市場の課題
- 促進要因と課題の影響
- 市場の機会・抑制要因
第12章 競合情勢
- 概要
- 競合情勢
- 混乱の状況
- 業界のリスク
第13章 競合分析
- 企業プロファイル
- 企業ランキング指数
- 企業の市場ポジショニング
- Ace Ingredients Co. Ltd.
- Ajinomoto Co. Inc.
- Badia Spices Inc.
- BAKERS AUTHORITY
- Bolners Fiesta Products Inc.
- Daesang Corp.
- Foodchem International Corp.
- Lerochem
- Masda Chemical Pte Ltd
- Meihua Holdings Group Co. Ltd.
- Merck KGaA
- Pearl River Bridge
- The Great American Spice Co.
- VEDAN Weidan Enterprise
- Waltons
第14章 付録
Exhibits:
- Exhibits1: Executive Summary - Chart on Market Overview
- Exhibits2: Executive Summary - Data Table on Market Overview
- Exhibits3: Executive Summary - Chart on Global Market Characteristics
- Exhibits4: Executive Summary - Chart on Market By Geographical Landscape
- Exhibits5: Executive Summary - Chart on Market Segmentation by Distribution Channel
- Exhibits6: Executive Summary - Chart on Market Segmentation by End-user
- Exhibits7: Executive Summary - Chart on Incremental Growth
- Exhibits8: Executive Summary - Data Table on Incremental Growth
- Exhibits9: Executive Summary - Chart on Company Market Positioning
- Exhibits10: Analysis of price sensitivity, lifecycle, customer purchase basket, adoption rates, and purchase criteria
- Exhibits11: Overview on criticality of inputs and factors of differentiation
- Exhibits12: Overview on factors of disruption
- Exhibits13: Impact of drivers and challenges in 2023 and 2028
- Exhibits14: Parent Market
- Exhibits15: Data Table on - Parent Market
- Exhibits16: Market characteristics analysis
- Exhibits17: Value Chain Analysis
- Exhibits18: Offerings of companies included in the market definition
- Exhibits19: Market segments
- Exhibits20: Chart on Global - Market size and forecast 2023-2028 ($ million)
- Exhibits21: Data Table on Global - Market size and forecast 2023-2028 ($ million)
- Exhibits22: Chart on Global Market: Year-over-year growth 2023-2028 (%)
- Exhibits23: Data Table on Global Market: Year-over-year growth 2023-2028 (%)
- Exhibits24: Historic Market Size - Data Table on Global Monosodium Glutamate (MSG) Market 2018 - 2022 ($ million)
- Exhibits25: Historic Market Size - Distribution Channel Segment 2018 - 2022 ($ million)
- Exhibits26: Historic Market Size - End-user Segment 2018 - 2022 ($ million)
- Exhibits27: Historic Market Size - Geography Segment 2018 - 2022 ($ million)
- Exhibits28: Historic Market Size - Country Segment 2018 - 2022 ($ million)
- Exhibits29: Five forces analysis - Comparison between 2023 and 2028
- Exhibits30: Bargaining power of buyers - Impact of key factors 2023 and 2028
- Exhibits31: Bargaining power of suppliers - Impact of key factors in 2023 and 2028
- Exhibits32: Threat of new entrants - Impact of key factors in 2023 and 2028
- Exhibits33: Threat of substitutes - Impact of key factors in 2023 and 2028
- Exhibits34: Threat of rivalry - Impact of key factors in 2023 and 2028
- Exhibits35: Chart on Market condition - Five forces 2023 and 2028
- Exhibits36: Chart on Distribution Channel - Market share 2023-2028 (%)
- Exhibits37: Data Table on Distribution Channel - Market share 2023-2028 (%)
- Exhibits38: Chart on Comparison by Distribution Channel
- Exhibits39: Data Table on Comparison by Distribution Channel
- Exhibits40: Chart on Offline - Market size and forecast 2023-2028 ($ million)
- Exhibits41: Data Table on Offline - Market size and forecast 2023-2028 ($ million)
- Exhibits42: Chart on Offline - Year-over-year growth 2023-2028 (%)
- Exhibits43: Data Table on Offline - Year-over-year growth 2023-2028 (%)
- Exhibits44: Chart on Online - Market size and forecast 2023-2028 ($ million)
- Exhibits45: Data Table on Online - Market size and forecast 2023-2028 ($ million)
- Exhibits46: Chart on Online - Year-over-year growth 2023-2028 (%)
- Exhibits47: Data Table on Online - Year-over-year growth 2023-2028 (%)
- Exhibits48: Market opportunity by Distribution Channel ($ million)
- Exhibits49: Data Table on Market opportunity by Distribution Channel ($ million)
- Exhibits50: Chart on End-user - Market share 2023-2028 (%)
- Exhibits51: Data Table on End-user - Market share 2023-2028 (%)
- Exhibits52: Chart on Comparison by End-user
- Exhibits53: Data Table on Comparison by End-user
- Exhibits54: Chart on Food processing industry - Market size and forecast 2023-2028 ($ million)
- Exhibits55: Data Table on Food processing industry - Market size and forecast 2023-2028 ($ million)
- Exhibits56: Chart on Food processing industry - Year-over-year growth 2023-2028 (%)
- Exhibits57: Data Table on Food processing industry - Year-over-year growth 2023-2028 (%)
- Exhibits58: Chart on Hotels - Market size and forecast 2023-2028 ($ million)
- Exhibits59: Data Table on Hotels - Market size and forecast 2023-2028 ($ million)
- Exhibits60: Chart on Hotels - Year-over-year growth 2023-2028 (%)
- Exhibits61: Data Table on Hotels - Year-over-year growth 2023-2028 (%)
- Exhibits62: Chart on Institutional food service - Market size and forecast 2023-2028 ($ million)
- Exhibits63: Data Table on Institutional food service - Market size and forecast 2023-2028 ($ million)
- Exhibits64: Chart on Institutional food service - Year-over-year growth 2023-2028 (%)
- Exhibits65: Data Table on Institutional food service - Year-over-year growth 2023-2028 (%)
- Exhibits66: Chart on Direct consumer - Market size and forecast 2023-2028 ($ million)
- Exhibits67: Data Table on Direct consumer - Market size and forecast 2023-2028 ($ million)
- Exhibits68: Chart on Direct consumer - Year-over-year growth 2023-2028 (%)
- Exhibits69: Data Table on Direct consumer - Year-over-year growth 2023-2028 (%)
- Exhibits70: Market opportunity by End-user ($ million)
- Exhibits71: Data Table on Market opportunity by End-user ($ million)
- Exhibits72: Analysis of price sensitivity, lifecycle, customer purchase basket, adoption rates, and purchase criteria
- Exhibits73: Chart on Market share By Geographical Landscape 2023-2028 (%)
- Exhibits74: Data Table on Market share By Geographical Landscape 2023-2028 (%)
- Exhibits75: Chart on Geographic comparison
- Exhibits76: Data Table on Geographic comparison
- Exhibits77: Chart on APAC - Market size and forecast 2023-2028 ($ million)
- Exhibits78: Data Table on APAC - Market size and forecast 2023-2028 ($ million)
- Exhibits79: Chart on APAC - Year-over-year growth 2023-2028 (%)
- Exhibits80: Data Table on APAC - Year-over-year growth 2023-2028 (%)
- Exhibits81: Chart on Middle East and Africa - Market size and forecast 2023-2028 ($ million)
- Exhibits82: Data Table on Middle East and Africa - Market size and forecast 2023-2028 ($ million)
- Exhibits83: Chart on Middle East and Africa - Year-over-year growth 2023-2028 (%)
- Exhibits84: Data Table on Middle East and Africa - Year-over-year growth 2023-2028 (%)
- Exhibits85: Chart on Europe - Market size and forecast 2023-2028 ($ million)
- Exhibits86: Data Table on Europe - Market size and forecast 2023-2028 ($ million)
- Exhibits87: Chart on Europe - Year-over-year growth 2023-2028 (%)
- Exhibits88: Data Table on Europe - Year-over-year growth 2023-2028 (%)
- Exhibits89: Chart on North America - Market size and forecast 2023-2028 ($ million)
- Exhibits90: Data Table on North America - Market size and forecast 2023-2028 ($ million)
- Exhibits91: Chart on North America - Year-over-year growth 2023-2028 (%)
- Exhibits92: Data Table on North America - Year-over-year growth 2023-2028 (%)
- Exhibits93: Chart on South America - Market size and forecast 2023-2028 ($ million)
- Exhibits94: Data Table on South America - Market size and forecast 2023-2028 ($ million)
- Exhibits95: Chart on South America - Year-over-year growth 2023-2028 (%)
- Exhibits96: Data Table on South America - Year-over-year growth 2023-2028 (%)
- Exhibits97: Chart on China - Market size and forecast 2023-2028 ($ million)
- Exhibits98: Data Table on China - Market size and forecast 2023-2028 ($ million)
- Exhibits99: Chart on China - Year-over-year growth 2023-2028 (%)
- Exhibits100: Data Table on China - Year-over-year growth 2023-2028 (%)
- Exhibits101: Chart on Japan - Market size and forecast 2023-2028 ($ million)
- Exhibits102: Data Table on Japan - Market size and forecast 2023-2028 ($ million)
- Exhibits103: Chart on Japan - Year-over-year growth 2023-2028 (%)
- Exhibits104: Data Table on Japan - Year-over-year growth 2023-2028 (%)
- Exhibits105: Chart on Indonesia - Market size and forecast 2023-2028 ($ million)
- Exhibits106: Data Table on Indonesia - Market size and forecast 2023-2028 ($ million)
- Exhibits107: Chart on Indonesia - Year-over-year growth 2023-2028 (%)
- Exhibits108: Data Table on Indonesia - Year-over-year growth 2023-2028 (%)
- Exhibits109: Chart on India - Market size and forecast 2023-2028 ($ million)
- Exhibits110: Data Table on India - Market size and forecast 2023-2028 ($ million)
- Exhibits111: Chart on India - Year-over-year growth 2023-2028 (%)
- Exhibits112: Data Table on India - Year-over-year growth 2023-2028 (%)
- Exhibits113: Chart on Thailand - Market size and forecast 2023-2028 ($ million)
- Exhibits114: Data Table on Thailand - Market size and forecast 2023-2028 ($ million)
- Exhibits115: Chart on Thailand - Year-over-year growth 2023-2028 (%)
- Exhibits116: Data Table on Thailand - Year-over-year growth 2023-2028 (%)
- Exhibits117: Market opportunity By Geographical Landscape ($ million)
- Exhibits118: Data Tables on Market opportunity By Geographical Landscape ($ million)
- Exhibits119: Impact of drivers and challenges in 2023 and 2028
- Exhibits120: Overview on criticality of inputs and factors of differentiation
- Exhibits121: Overview on factors of disruption
- Exhibits122: Impact of key risks on business
- Exhibits123: Companies covered
- Exhibits124: Company ranking index
- Exhibits125: Matrix on companies position and classification
- Exhibits126: Ace Ingredients Co. Ltd. - Overview
- Exhibits127: Ace Ingredients Co. Ltd. - Product / Service
- Exhibits128: Ace Ingredients Co. Ltd. - Key offerings
- Exhibits129: SWOT
- Exhibits130: Ajinomoto Co. Inc. - Overview
- Exhibits131: Ajinomoto Co. Inc. - Business segments
- Exhibits132: Ajinomoto Co. Inc. - Key news
- Exhibits133: Ajinomoto Co. Inc. - Key offerings
- Exhibits134: Ajinomoto Co. Inc. - Segment focus
- Exhibits135: SWOT
- Exhibits136: Badia Spices Inc. - Overview
- Exhibits137: Badia Spices Inc. - Product / Service
- Exhibits138: Badia Spices Inc. - Key offerings
- Exhibits139: SWOT
- Exhibits140: BAKERS AUTHORITY - Overview
- Exhibits141: BAKERS AUTHORITY - Product / Service
- Exhibits142: BAKERS AUTHORITY - Key offerings
- Exhibits143: SWOT
- Exhibits144: Bolners Fiesta Products Inc. - Overview
- Exhibits145: Bolners Fiesta Products Inc. - Product / Service
- Exhibits146: Bolners Fiesta Products Inc. - Key offerings
- Exhibits147: SWOT
- Exhibits148: Daesang Corp. - Overview
- Exhibits149: Daesang Corp. - Business segments
- Exhibits150: Daesang Corp. - Key offerings
- Exhibits151: Daesang Corp. - Segment focus
- Exhibits152: SWOT
- Exhibits153: Foodchem International Corp. - Overview
- Exhibits154: Foodchem International Corp. - Product / Service
- Exhibits155: Foodchem International Corp. - Key offerings
- Exhibits156: SWOT
- Exhibits157: Lerochem - Overview
- Exhibits158: Lerochem - Product / Service
- Exhibits159: Lerochem - Key offerings
- Exhibits160: SWOT
- Exhibits161: Masda Chemical Pte Ltd - Overview
- Exhibits162: Masda Chemical Pte Ltd - Product / Service
- Exhibits163: Masda Chemical Pte Ltd - Key offerings
- Exhibits164: SWOT
- Exhibits165: Meihua Holdings Group Co. Ltd. - Overview
- Exhibits166: Meihua Holdings Group Co. Ltd. - Product / Service
- Exhibits167: Meihua Holdings Group Co. Ltd. - Key offerings
- Exhibits168: SWOT
- Exhibits169: Merck KGaA - Overview
- Exhibits170: Merck KGaA - Business segments
- Exhibits171: Merck KGaA - Key news
- Exhibits172: Merck KGaA - Key offerings
- Exhibits173: Merck KGaA - Segment focus
- Exhibits174: SWOT
- Exhibits175: Pearl River Bridge - Overview
- Exhibits176: Pearl River Bridge - Product / Service
- Exhibits177: Pearl River Bridge - Key offerings
- Exhibits178: SWOT
- Exhibits179: The Great American Spice Co. - Overview
- Exhibits180: The Great American Spice Co. - Product / Service
- Exhibits181: The Great American Spice Co. - Key offerings
- Exhibits182: SWOT
- Exhibits183: VEDAN Weidan Enterprise - Overview
- Exhibits184: VEDAN Weidan Enterprise - Product / Service
- Exhibits185: VEDAN Weidan Enterprise - Key offerings
- Exhibits186: SWOT
- Exhibits187: Waltons - Overview
- Exhibits188: Waltons - Product / Service
- Exhibits189: Waltons - Key offerings
- Exhibits190: SWOT
- Exhibits191: Inclusions checklist
- Exhibits192: Exclusions checklist
- Exhibits193: Currency conversion rates for US$
- Exhibits194: Research methodology
- Exhibits195: Information sources
- Exhibits196: Data validation
- Exhibits197: Validation techniques employed for market sizing
- Exhibits198: Data synthesis
- Exhibits199: 360 degree market analysis
- Exhibits200: List of abbreviations
The monosodium glutamate (MSG) market is forecasted to grow by USD 1642.4 mn during 2023-2028, accelerating at a CAGR of 5.52% during the forecast period. The report on the monosodium glutamate (MSG) market provides a holistic analysis, market size and forecast, trends, growth drivers, and challenges, as well as vendor analysis covering around 25 vendors.
The report offers an up-to-date analysis regarding the current market scenario, the latest trends and drivers, and the overall market environment. The market is driven by increased awareness and acceptance of MSG, strategic marketing of MSG and product innovations by market vendors, and growing popularity of asian cuisines.
Technavio's monosodium glutamate (MSG) market is segmented as below:
| Market Scope | |
|---|---|
| Base Year | 2024 |
| End Year | 2028 |
| Series Year | 2024-2028 |
| Growth Momentum | Accelerate |
| YOY 2024 | 4.83% |
| CAGR | 5.52% |
| Incremental Value | $1642.4mn |
By Distribution Channel
- Offline
- Online
By End-user
- Food processing industry
- Restaurants
- Institutional food service
- Direct consumer
By Geographical Landscape
- APAC
- Middle East and Africa
- Europe
- North America
- South America
This study identifies the expansion of MSG applications as one of the prime reasons driving the monosodium glutamate (MSG) market growth during the next few years. Also, growing emphasis on sustainable and ethical sourcing of MSG and advances in fermentation and production technologies in MSG manufacturing will lead to sizable demand in the market.
The report on the monosodium glutamate (MSG) market covers the following areas:
- Monosodium glutamate (MSG) market sizing
- Monosodium glutamate (MSG) market forecast
- Monosodium glutamate (MSG) market industry analysis
The robust vendor analysis is designed to help clients improve their market position, and in line with this, this report provides a detailed analysis of several leading monosodium glutamate (MSG) market vendors that include Ace Ingredients Co. Ltd. , Ajinomoto Co. Inc., Badia Spices Inc., BAKERS AUTHORITY, Bolners Fiesta Products Inc., ChemCeed, Daesang Corp., Foodchem International Corp., Lerochem, Masda Chemical Pte Ltd, Meihua Holdings Group Co. Ltd., Merck KGaA, Pearl River Bridge, Prakash Chemicals Agencies Pvt. Ltd., Puramate India Pvt Ltd, The Great American Spice Co., Urban Platter, VEDAN Weidan Enterprise, Waltons, and World of Spice.. Also, the monosodium glutamate (MSG) market analysis report includes information on upcoming trends and challenges that will influence market growth. This is to help companies strategize and leverage all forthcoming growth opportunities.
The study was conducted using an objective combination of primary and secondary information including inputs from key participants in the industry. The report contains a comprehensive market and vendor landscape in addition to an analysis of the key vendors.
The publisher presents a detailed picture of the market by the way of study, synthesis, and summation of data from multiple sources by an analysis of key parameters such as profit, pricing, competition, and promotions. IT presents various market facets by identifying the key industry influencers. The data presented is comprehensive, reliable, and a result of extensive research - both primary and secondary. The market research reports provide a complete competitive landscape and an in-depth vendor selection methodology and analysis using qualitative and quantitative research to forecast the accurate market growth.
Table of Contents
1 Executive Summary
- 1.1 Market overview
- Executive Summary - Chart on Market Overview
- Executive Summary - Data Table on Market Overview
- Executive Summary - Chart on Global Market Characteristics
- Executive Summary - Chart on Market By Geographical Landscape
- Executive Summary - Chart on Market Segmentation by Distribution Channel
- Executive Summary - Chart on Market Segmentation by End-user
- Executive Summary - Chart on Incremental Growth
- Executive Summary - Data Table on Incremental Growth
- Executive Summary - Chart on Company Market Positioning
2 Technavio Analysis
- 2.1 Analysis of price sensitivity, lifecycle, customer purchase basket, adoption rates, and purchase criteria
- Analysis of price sensitivity, lifecycle, customer purchase basket, adoption rates, and purchase criteria
- 2.2 Criticality of inputs and Factors of differentiation
- Overview on criticality of inputs and factors of differentiation
- 2.3 Factors of disruption
- Overview on factors of disruption
- 2.4 Impact of drivers and challenges
- Impact of drivers and challenges in 2023 and 2028
3 Market Landscape
- 3.1 Market ecosystem
- Parent Market
- Data Table on - Parent Market
- 3.2 Market characteristics
- Market characteristics analysis
- 3.3 Value chain analysis
- Value Chain Analysis
4 Market Sizing
- 4.1 Market definition
- Offerings of companies included in the market definition
- 4.2 Market segment analysis
- Market segments
- 4.3 Market size 2023
- 4.4 Market outlook: Forecast for 2023-2028
- Chart on Global - Market size and forecast 2023-2028 ($ million)
- Data Table on Global - Market size and forecast 2023-2028 ($ million)
- Chart on Global Market: Year-over-year growth 2023-2028 (%)
- Data Table on Global Market: Year-over-year growth 2023-2028 (%)
5 Historic Market Size
- 5.1 Global Monosodium Glutamate (MSG) Market 2018 - 2022
- Historic Market Size - Data Table on Global Monosodium Glutamate (MSG) Market 2018 - 2022 ($ million)
- 5.2 Distribution Channel segment analysis 2018 - 2022
- Historic Market Size - Distribution Channel Segment 2018 - 2022 ($ million)
- 5.3 End-user segment analysis 2018 - 2022
- Historic Market Size - End-user Segment 2018 - 2022 ($ million)
- 5.4 Geography segment analysis 2018 - 2022
- Historic Market Size - Geography Segment 2018 - 2022 ($ million)
- 5.5 Country segment analysis 2018 - 2022
- Historic Market Size - Country Segment 2018 - 2022 ($ million)
6 Five Forces Analysis
- 6.1 Five forces summary
- Five forces analysis - Comparison between 2023 and 2028
- 6.2 Bargaining power of buyers
- Bargaining power of buyers - Impact of key factors 2023 and 2028
- 6.3 Bargaining power of suppliers
- Bargaining power of suppliers - Impact of key factors in 2023 and 2028
- 6.4 Threat of new entrants
- Threat of new entrants - Impact of key factors in 2023 and 2028
- 6.5 Threat of substitutes
- Threat of substitutes - Impact of key factors in 2023 and 2028
- 6.6 Threat of rivalry
- Threat of rivalry - Impact of key factors in 2023 and 2028
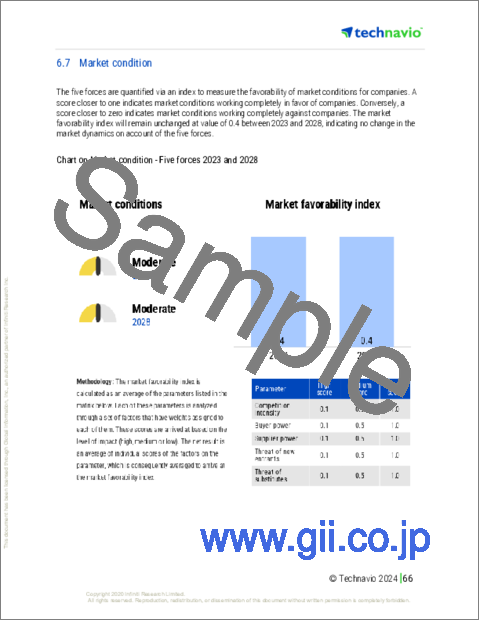
- 6.7 Market condition
- Chart on Market condition - Five forces 2023 and 2028
7 Market Segmentation by Distribution Channel
- 7.1 Market segments
- Chart on Distribution Channel - Market share 2023-2028 (%)
- Data Table on Distribution Channel - Market share 2023-2028 (%)
- 7.2 Comparison by Distribution Channel
- Chart on Comparison by Distribution Channel
- Data Table on Comparison by Distribution Channel
- 7.3 Offline - Market size and forecast 2023-2028
- Chart on Offline - Market size and forecast 2023-2028 ($ million)
- Data Table on Offline - Market size and forecast 2023-2028 ($ million)
- Chart on Offline - Year-over-year growth 2023-2028 (%)
- Data Table on Offline - Year-over-year growth 2023-2028 (%)
- 7.4 Online - Market size and forecast 2023-2028
- Chart on Online - Market size and forecast 2023-2028 ($ million)
- Data Table on Online - Market size and forecast 2023-2028 ($ million)
- Chart on Online - Year-over-year growth 2023-2028 (%)
- Data Table on Online - Year-over-year growth 2023-2028 (%)
- 7.5 Market opportunity by Distribution Channel
- Market opportunity by Distribution Channel ($ million)
- Data Table on Market opportunity by Distribution Channel ($ million)
8 Market Segmentation by End-user
- 8.1 Market segments
- Chart on End-user - Market share 2023-2028 (%)
- Data Table on End-user - Market share 2023-2028 (%)
- 8.2 Comparison by End-user
- Chart on Comparison by End-user
- Data Table on Comparison by End-user
- 8.3 Food processing industry - Market size and forecast 2023-2028
- Chart on Food processing industry - Market size and forecast 2023-2028 ($ million)
- Data Table on Food processing industry - Market size and forecast 2023-2028 ($ million)
- Chart on Food processing industry - Year-over-year growth 2023-2028 (%)
- Data Table on Food processing industry - Year-over-year growth 2023-2028 (%)
- 8.4 Hotels - Market size and forecast 2023-2028
- Chart on Hotels - Market size and forecast 2023-2028 ($ million)
- Data Table on Hotels - Market size and forecast 2023-2028 ($ million)
- Chart on Hotels - Year-over-year growth 2023-2028 (%)
- Data Table on Hotels - Year-over-year growth 2023-2028 (%)
- 8.5 Institutional food service - Market size and forecast 2023-2028
- Chart on Institutional food service - Market size and forecast 2023-2028 ($ million)
- Data Table on Institutional food service - Market size and forecast 2023-2028 ($ million)
- Chart on Institutional food service - Year-over-year growth 2023-2028 (%)
- Data Table on Institutional food service - Year-over-year growth 2023-2028 (%)
- 8.6 Direct consumer - Market size and forecast 2023-2028
- Chart on Direct consumer - Market size and forecast 2023-2028 ($ million)
- Data Table on Direct consumer - Market size and forecast 2023-2028 ($ million)
- Chart on Direct consumer - Year-over-year growth 2023-2028 (%)
- Data Table on Direct consumer - Year-over-year growth 2023-2028 (%)
- 8.7 Market opportunity by End-user
- Market opportunity by End-user ($ million)
- Data Table on Market opportunity by End-user ($ million)
9 Customer Landscape
- 9.1 Customer landscape overview
- Analysis of price sensitivity, lifecycle, customer purchase basket, adoption rates, and purchase criteria
10 Geographic Landscape
- 10.1 Geographic segmentation
- Chart on Market share By Geographical Landscape 2023-2028 (%)
- Data Table on Market share By Geographical Landscape 2023-2028 (%)
- 10.2 Geographic comparison
- Chart on Geographic comparison
- Data Table on Geographic comparison
- 10.3 APAC - Market size and forecast 2023-2028
- Chart on APAC - Market size and forecast 2023-2028 ($ million)
- Data Table on APAC - Market size and forecast 2023-2028 ($ million)
- Chart on APAC - Year-over-year growth 2023-2028 (%)
- Data Table on APAC - Year-over-year growth 2023-2028 (%)
- 10.4 Middle East and Africa - Market size and forecast 2023-2028
- Chart on Middle East and Africa - Market size and forecast 2023-2028 ($ million)
- Data Table on Middle East and Africa - Market size and forecast 2023-2028 ($ million)
- Chart on Middle East and Africa - Year-over-year growth 2023-2028 (%)
- Data Table on Middle East and Africa - Year-over-year growth 2023-2028 (%)
- 10.5 Europe - Market size and forecast 2023-2028
- Chart on Europe - Market size and forecast 2023-2028 ($ million)
- Data Table on Europe - Market size and forecast 2023-2028 ($ million)
- Chart on Europe - Year-over-year growth 2023-2028 (%)
- Data Table on Europe - Year-over-year growth 2023-2028 (%)
- 10.6 North America - Market size and forecast 2023-2028
- Chart on North America - Market size and forecast 2023-2028 ($ million)
- Data Table on North America - Market size and forecast 2023-2028 ($ million)
- Chart on North America - Year-over-year growth 2023-2028 (%)
- Data Table on North America - Year-over-year growth 2023-2028 (%)
- 10.7 South America - Market size and forecast 2023-2028
- Chart on South America - Market size and forecast 2023-2028 ($ million)
- Data Table on South America - Market size and forecast 2023-2028 ($ million)
- Chart on South America - Year-over-year growth 2023-2028 (%)
- Data Table on South America - Year-over-year growth 2023-2028 (%)
- 10.8 China - Market size and forecast 2023-2028
- Chart on China - Market size and forecast 2023-2028 ($ million)
- Data Table on China - Market size and forecast 2023-2028 ($ million)
- Chart on China - Year-over-year growth 2023-2028 (%)
- Data Table on China - Year-over-year growth 2023-2028 (%)
- 10.9 Japan - Market size and forecast 2023-2028
- Chart on Japan - Market size and forecast 2023-2028 ($ million)
- Data Table on Japan - Market size and forecast 2023-2028 ($ million)
- Chart on Japan - Year-over-year growth 2023-2028 (%)
- Data Table on Japan - Year-over-year growth 2023-2028 (%)
- 10.10 Indonesia - Market size and forecast 2023-2028
- Chart on Indonesia - Market size and forecast 2023-2028 ($ million)
- Data Table on Indonesia - Market size and forecast 2023-2028 ($ million)
- Chart on Indonesia - Year-over-year growth 2023-2028 (%)
- Data Table on Indonesia - Year-over-year growth 2023-2028 (%)
- 10.11 India - Market size and forecast 2023-2028
- Chart on India - Market size and forecast 2023-2028 ($ million)
- Data Table on India - Market size and forecast 2023-2028 ($ million)
- Chart on India - Year-over-year growth 2023-2028 (%)
- Data Table on India - Year-over-year growth 2023-2028 (%)
- 10.12 Thailand - Market size and forecast 2023-2028
- Chart on Thailand - Market size and forecast 2023-2028 ($ million)
- Data Table on Thailand - Market size and forecast 2023-2028 ($ million)
- Chart on Thailand - Year-over-year growth 2023-2028 (%)
- Data Table on Thailand - Year-over-year growth 2023-2028 (%)
- 10.13 Market opportunity By Geographical Landscape
- Market opportunity By Geographical Landscape ($ million)
- Data Tables on Market opportunity By Geographical Landscape ($ million)
11 Drivers, Challenges, and Opportunity/Restraints
- 11.1 Market drivers
- 11.2 Market challenges
- 11.3 Impact of drivers and challenges
- Impact of drivers and challenges in 2023 and 2028
- 11.4 Market opportunities/restraints
12 Competitive Landscape
- 12.1 Overview
- 12.2 Competitive Landscape
- Overview on criticality of inputs and factors of differentiation
- 12.3 Landscape disruption
- Overview on factors of disruption
- 12.4 Industry risks
- Impact of key risks on business
13 Competitive Analysis
- 13.1 Companies profiled
- Companies covered
- 13.2 Company ranking index
- Company ranking index
- 13.3 Market positioning of companies
- Matrix on companies position and classification
- 13.4 Ace Ingredients Co. Ltd.
- Ace Ingredients Co. Ltd. - Overview
- Ace Ingredients Co. Ltd. - Product / Service
- Ace Ingredients Co. Ltd. - Key offerings
- SWOT
- 13.5 Ajinomoto Co. Inc.
- Ajinomoto Co. Inc. - Overview
- Ajinomoto Co. Inc. - Business segments
- Ajinomoto Co. Inc. - Key news
- Ajinomoto Co. Inc. - Key offerings
- Ajinomoto Co. Inc. - Segment focus
- SWOT
- 13.6 Badia Spices Inc.
- Badia Spices Inc. - Overview
- Badia Spices Inc. - Product / Service
- Badia Spices Inc. - Key offerings
- SWOT
- 13.7 BAKERS AUTHORITY
- BAKERS AUTHORITY - Overview
- BAKERS AUTHORITY - Product / Service
- BAKERS AUTHORITY - Key offerings
- SWOT
- 13.8 Bolners Fiesta Products Inc.
- Bolners Fiesta Products Inc. - Overview
- Bolners Fiesta Products Inc. - Product / Service
- Bolners Fiesta Products Inc. - Key offerings
- SWOT
- 13.9 Daesang Corp.
- Daesang Corp. - Overview
- Daesang Corp. - Business segments
- Daesang Corp. - Key offerings
- Daesang Corp. - Segment focus
- SWOT
- 13.10 Foodchem International Corp.
- Foodchem International Corp. - Overview
- Foodchem International Corp. - Product / Service
- Foodchem International Corp. - Key offerings
- SWOT
- 13.11 Lerochem
- Lerochem - Overview
- Lerochem - Product / Service
- Lerochem - Key offerings
- SWOT
- 13.12 Masda Chemical Pte Ltd
- Masda Chemical Pte Ltd - Overview
- Masda Chemical Pte Ltd - Product / Service
- Masda Chemical Pte Ltd - Key offerings
- SWOT
- 13.13 Meihua Holdings Group Co. Ltd.
- Meihua Holdings Group Co. Ltd. - Overview
- Meihua Holdings Group Co. Ltd. - Product / Service
- Meihua Holdings Group Co. Ltd. - Key offerings
- SWOT
- 13.14 Merck KGaA
- Merck KGaA - Overview
- Merck KGaA - Business segments
- Merck KGaA - Key news
- Merck KGaA - Key offerings
- Merck KGaA - Segment focus
- SWOT
- 13.15 Pearl River Bridge
- Pearl River Bridge - Overview
- Pearl River Bridge - Product / Service
- Pearl River Bridge - Key offerings
- SWOT
- 13.16 The Great American Spice Co.
- The Great American Spice Co. - Overview
- The Great American Spice Co. - Product / Service
- The Great American Spice Co. - Key offerings
- SWOT
- 13.17 VEDAN Weidan Enterprise
- VEDAN Weidan Enterprise - Overview
- VEDAN Weidan Enterprise - Product / Service
- VEDAN Weidan Enterprise - Key offerings
- SWOT
- 13.18 Waltons
- Waltons - Overview
- Waltons - Product / Service
- Waltons - Key offerings
- SWOT
14 Appendix
- 14.1 Scope of the report
- 14.2 Inclusions and exclusions checklist
- Inclusions checklist
- Exclusions checklist
- 14.3 Currency conversion rates for US$
- Currency conversion rates for US$
- 14.4 Research methodology
- Research methodology
- 14.5 Data procurement
- Information sources
- 14.6 Data validation
- Data validation
- 14.7 Validation techniques employed for market sizing
- Validation techniques employed for market sizing
- 14.8 Data synthesis
- Data synthesis
- 14.9 360 degree market analysis
- 360 degree market analysis
- 14.10 List of abbreviations
- List of abbreviations
