|
|
市場調査レポート
商品コード
1645559
スヌースの世界市場 2025~2029年Global Snus Market 2025-2029 |
||||||

|
|||||||
カスタマイズ可能
|
|||||||


| スヌースの世界市場 2025~2029年 |
|
出版日: 2025年01月18日
発行: TechNavio
ページ情報: 英文 197 Pages
納期: 即納可能
|

全表示
- 概要
- 図表
- 目次
スヌース市場は2024~2029年に11億9,680万米ドル、予測期間中のCAGRは10.7%で成長すると予測されます。
当レポートでは、スヌース市場の全体的な分析、市場規模・予測、動向、成長促進要因、課題、約25のベンダーを網羅したベンダー分析などを掲載しています。
現在の市場シナリオ、最新動向と促進要因、市場環境全体に関する最新分析を提供しています。市場は、フレーバー付きスヌースの入手可能性、スヌース消費による健康への悪影響の少なさ、喫煙禁止の増加などが牽引しています。
| 市場範囲 | |
|---|---|
| 基準年 | 2025年 |
| 終了年 | 2029年 |
| 予測期間 | 2025~2029年 |
| 成長モメンタム | 加速 |
| 前年比[2025年] | 10% |
| CAGR | 10.7% |
| 増分額 | 11億9,680万米ドル |
本調査では、世界のスヌース市場における消費動向の変化が、今後数年間のスヌース市場の成長を促進する主要な要因の一つであると分析しています。また、オンライン小売と原料タバコの調達における持続可能性の高まりは、市場の大きな需要につながります。
目次
第1章 エグゼクティブサマリー
- 市場概要
第2章 Technavio分析
- 価格・ライフサイクル・顧客購入バスケット・採用率・購入基準の分析
- インプットの重要性と差別化の要因
- 混乱の要因
- 促進要因と課題の影響
第3章 市場情勢
- 市場エコシステム
- 市場の特徴
- バリューチェーン分析
第4章 市場規模
- 市場の定義
- 市場セグメント分析
- 市場規模 2024年
- 市場の展望 2024~2029年
第5章 市場規模実績
- スヌースの世界市場 2019~2023年
- フレーバーセグメント分析 2019~2023年
- 製品別セグメント分析 2019~2023年
- 地域別セグメント分析 2019~2023年
- 国別セグメント分析 2019~2023年
第6章 定性分析
- AIの影響:スヌースの世界市場
第7章 ファイブフォース分析
- ファイブフォースの要約
- 買い手の交渉力
- 供給企業の交渉力
- 新規参入業者の脅威
- 代替品の脅威
- 競争の脅威
- 市況
第8章 市場セグメンテーション:フレーバー別
- 市場セグメント
- 比較:フレーバー別
- ミント:市場規模と予測 2024~2029年
- フルーツ:市場規模と予測 2024~2029年
- ウィスキー:市場規模と予測 2024~2029年
- その他:市場規模と予測 2024~2029年
- 市場機会:フレーバー別
第9章 市場セグメンテーション:製品別
- 市場セグメント
- 比較:製品別
- ポーション:市場規模と予測 2024~2029年
- ルース:市場規模と予測 2024~2029年
- 市場機会:製品別
第10章 顧客情勢
- 顧客情勢概要
第11章 地域別情勢
- 地域別セグメンテーション
- 比較:地域別
- 欧州:市場規模と予測 2024~2029年
- 北米:市場規模と予測 2024~2029年
- アジア太平洋:市場規模と予測 2024~2029年
- 南米:市場規模と予測 2024~2029年
- 中東・アフリカ:市場規模と予測 2024~2029年
- スウェーデン:市場規模と予測 2024~2029年
- 米国:市場規模と予測 2024~2029年
- ノルウェー:市場規模と予測 2024~2029年
- ポーランド:市場規模と予測 2024~2029年
- スペイン:市場規模と予測 2024~2029年
- デンマーク:市場規模と予測 2024~2029年
- カナダ:市場規模と予測 2024~2029年
- ドイツ:市場規模と予測 2024~2029年
- 中国:市場規模と予測 2024~2029年
- フィンランド:市場規模と予測 2024~2029年
- 地域情勢による市場機会
第12章 促進要因・課題・機会・抑制要因
- 市場促進要因
- 市場課題
- 促進要因と課題の影響
- 市場機会・抑制要因
第13章 競合情勢
- 概要
- 競合情勢
- 混乱の状況
- 産業のリスク
第14章 競合分析
- 企業プロファイル
- 企業ランキング指数
- 企業の市場ポジショニング
- Altria Group Inc.
- Another Snus Factory Stockholm AB
- British American Tobacco Plc
- Dholakia Tobacco Pvt. Ltd.
- Empire of Snus
- GN Tobacco Sweden AB
- Harsh International
- Imperial Brands Plc
- Japan Tobacco Inc.
- Philip Morris International Inc.
- Swisher International Inc.
- TIGERSNUS ORGANIC SNUS TOBACCO
- Turning Point Brands Inc.
- Wilsons and Co. Sharrow Ltd.
第15章 付録
Exhibits:
- Exhibits1: Executive Summary - Chart on Market Overview
- Exhibits2: Executive Summary - Data Table on Market Overview
- Exhibits3: Executive Summary - Chart on Global Market Characteristics
- Exhibits4: Executive Summary - Chart on Market By Geographical Landscape
- Exhibits5: Executive Summary - Chart on Market Segmentation by Flavor
- Exhibits6: Executive Summary - Chart on Market Segmentation by Product
- Exhibits7: Executive Summary - Chart on Incremental Growth
- Exhibits8: Executive Summary - Data Table on Incremental Growth
- Exhibits9: Executive Summary - Chart on Company Market Positioning
- Exhibits10: Analysis of price sensitivity, lifecycle, customer purchase basket, adoption rates, and purchase criteria
- Exhibits11: Overview on criticality of inputs and factors of differentiation
- Exhibits12: Overview on factors of disruption
- Exhibits13: Impact of drivers and challenges in 2024 and 2029
- Exhibits14: Parent Market
- Exhibits15: Data Table on - Parent Market
- Exhibits16: Market characteristics analysis
- Exhibits17: Value chain analysis
- Exhibits18: Offerings of companies included in the market definition
- Exhibits19: Market segments
- Exhibits20: Chart on Global - Market size and forecast 2024-2029 ($ million)
- Exhibits21: Data Table on Global - Market size and forecast 2024-2029 ($ million)
- Exhibits22: Chart on Global Market: Year-over-year growth 2024-2029 (%)
- Exhibits23: Data Table on Global Market: Year-over-year growth 2024-2029 (%)
- Exhibits24: Historic Market Size - Data Table on Global Snus Market 2019 - 2023 ($ million)
- Exhibits25: Historic Market Size - Flavor Segment 2019 - 2023 ($ million)
- Exhibits26: Historic Market Size - Product Segment 2019 - 2023 ($ million)
- Exhibits27: Historic Market Size - Geography Segment 2019 - 2023 ($ million)
- Exhibits28: Historic Market Size - Country Segment 2019 - 2023 ($ million)
- Exhibits29: Five forces analysis - Comparison between 2024 and 2029
- Exhibits30: Bargaining power of buyers - Impact of key factors 2024 and 2029
- Exhibits31: Bargaining power of suppliers - Impact of key factors in 2024 and 2029
- Exhibits32: Threat of new entrants - Impact of key factors in 2024 and 2029
- Exhibits33: Threat of substitutes - Impact of key factors in 2024 and 2029
- Exhibits34: Threat of rivalry - Impact of key factors in 2024 and 2029
- Exhibits35: Chart on Market condition - Five forces 2024 and 2029
- Exhibits36: Chart on Flavor - Market share 2024-2029 (%)
- Exhibits37: Data Table on Flavor - Market share 2024-2029 (%)
- Exhibits38: Chart on Comparison by Flavor
- Exhibits39: Data Table on Comparison by Flavor
- Exhibits40: Chart on Mint - Market size and forecast 2024-2029 ($ million)
- Exhibits41: Data Table on Mint - Market size and forecast 2024-2029 ($ million)
- Exhibits42: Chart on Mint - Year-over-year growth 2024-2029 (%)
- Exhibits43: Data Table on Mint - Year-over-year growth 2024-2029 (%)
- Exhibits44: Chart on Fruit - Market size and forecast 2024-2029 ($ million)
- Exhibits45: Data Table on Fruit - Market size and forecast 2024-2029 ($ million)
- Exhibits46: Chart on Fruit - Year-over-year growth 2024-2029 (%)
- Exhibits47: Data Table on Fruit - Year-over-year growth 2024-2029 (%)
- Exhibits48: Chart on Whiskey - Market size and forecast 2024-2029 ($ million)
- Exhibits49: Data Table on Whiskey - Market size and forecast 2024-2029 ($ million)
- Exhibits50: Chart on Whiskey - Year-over-year growth 2024-2029 (%)
- Exhibits51: Data Table on Whiskey - Year-over-year growth 2024-2029 (%)
- Exhibits52: Chart on Others - Market size and forecast 2024-2029 ($ million)
- Exhibits53: Data Table on Others - Market size and forecast 2024-2029 ($ million)
- Exhibits54: Chart on Others - Year-over-year growth 2024-2029 (%)
- Exhibits55: Data Table on Others - Year-over-year growth 2024-2029 (%)
- Exhibits56: Market opportunity by Flavor ($ million)
- Exhibits57: Data Table on Market opportunity by Flavor ($ million)
- Exhibits58: Chart on Product - Market share 2024-2029 (%)
- Exhibits59: Data Table on Product - Market share 2024-2029 (%)
- Exhibits60: Chart on Comparison by Product
- Exhibits61: Data Table on Comparison by Product
- Exhibits62: Chart on Portion - Market size and forecast 2024-2029 ($ million)
- Exhibits63: Data Table on Portion - Market size and forecast 2024-2029 ($ million)
- Exhibits64: Chart on Portion - Year-over-year growth 2024-2029 (%)
- Exhibits65: Data Table on Portion - Year-over-year growth 2024-2029 (%)
- Exhibits66: Chart on Loose - Market size and forecast 2024-2029 ($ million)
- Exhibits67: Data Table on Loose - Market size and forecast 2024-2029 ($ million)
- Exhibits68: Chart on Loose - Year-over-year growth 2024-2029 (%)
- Exhibits69: Data Table on Loose - Year-over-year growth 2024-2029 (%)
- Exhibits70: Market opportunity by Product ($ million)
- Exhibits71: Data Table on Market opportunity by Product ($ million)
- Exhibits72: Analysis of price sensitivity, lifecycle, customer purchase basket, adoption rates, and purchase criteria
- Exhibits73: Chart on Market share By Geographical Landscape 2024-2029 (%)
- Exhibits74: Data Table on Market share By Geographical Landscape 2024-2029 (%)
- Exhibits75: Chart on Geographic comparison
- Exhibits76: Data Table on Geographic comparison
- Exhibits77: Chart on Europe - Market size and forecast 2024-2029 ($ million)
- Exhibits78: Data Table on Europe - Market size and forecast 2024-2029 ($ million)
- Exhibits79: Chart on Europe - Year-over-year growth 2024-2029 (%)
- Exhibits80: Data Table on Europe - Year-over-year growth 2024-2029 (%)
- Exhibits81: Chart on North America - Market size and forecast 2024-2029 ($ million)
- Exhibits82: Data Table on North America - Market size and forecast 2024-2029 ($ million)
- Exhibits83: Chart on North America - Year-over-year growth 2024-2029 (%)
- Exhibits84: Data Table on North America - Year-over-year growth 2024-2029 (%)
- Exhibits85: Chart on APAC - Market size and forecast 2024-2029 ($ million)
- Exhibits86: Data Table on APAC - Market size and forecast 2024-2029 ($ million)
- Exhibits87: Chart on APAC - Year-over-year growth 2024-2029 (%)
- Exhibits88: Data Table on APAC - Year-over-year growth 2024-2029 (%)
- Exhibits89: Chart on South America - Market size and forecast 2024-2029 ($ million)
- Exhibits90: Data Table on South America - Market size and forecast 2024-2029 ($ million)
- Exhibits91: Chart on South America - Year-over-year growth 2024-2029 (%)
- Exhibits92: Data Table on South America - Year-over-year growth 2024-2029 (%)
- Exhibits93: Chart on Middle East and Africa - Market size and forecast 2024-2029 ($ million)
- Exhibits94: Data Table on Middle East and Africa - Market size and forecast 2024-2029 ($ million)
- Exhibits95: Chart on Middle East and Africa - Year-over-year growth 2024-2029 (%)
- Exhibits96: Data Table on Middle East and Africa - Year-over-year growth 2024-2029 (%)
- Exhibits97: Chart on Sweden - Market size and forecast 2024-2029 ($ million)
- Exhibits98: Data Table on Sweden - Market size and forecast 2024-2029 ($ million)
- Exhibits99: Chart on Sweden - Year-over-year growth 2024-2029 (%)
- Exhibits100: Data Table on Sweden - Year-over-year growth 2024-2029 (%)
- Exhibits101: Chart on US - Market size and forecast 2024-2029 ($ million)
- Exhibits102: Data Table on US - Market size and forecast 2024-2029 ($ million)
- Exhibits103: Chart on US - Year-over-year growth 2024-2029 (%)
- Exhibits104: Data Table on US - Year-over-year growth 2024-2029 (%)
- Exhibits105: Chart on Norway - Market size and forecast 2024-2029 ($ million)
- Exhibits106: Data Table on Norway - Market size and forecast 2024-2029 ($ million)
- Exhibits107: Chart on Norway - Year-over-year growth 2024-2029 (%)
- Exhibits108: Data Table on Norway - Year-over-year growth 2024-2029 (%)
- Exhibits109: Chart on Poland - Market size and forecast 2024-2029 ($ million)
- Exhibits110: Data Table on Poland - Market size and forecast 2024-2029 ($ million)
- Exhibits111: Chart on Poland - Year-over-year growth 2024-2029 (%)
- Exhibits112: Data Table on Poland - Year-over-year growth 2024-2029 (%)
- Exhibits113: Chart on Spain - Market size and forecast 2024-2029 ($ million)
- Exhibits114: Data Table on Spain - Market size and forecast 2024-2029 ($ million)
- Exhibits115: Chart on Spain - Year-over-year growth 2024-2029 (%)
- Exhibits116: Data Table on Spain - Year-over-year growth 2024-2029 (%)
- Exhibits117: Chart on Denmark - Market size and forecast 2024-2029 ($ million)
- Exhibits118: Data Table on Denmark - Market size and forecast 2024-2029 ($ million)
- Exhibits119: Chart on Denmark - Year-over-year growth 2024-2029 (%)
- Exhibits120: Data Table on Denmark - Year-over-year growth 2024-2029 (%)
- Exhibits121: Chart on Canada - Market size and forecast 2024-2029 ($ million)
- Exhibits122: Data Table on Canada - Market size and forecast 2024-2029 ($ million)
- Exhibits123: Chart on Canada - Year-over-year growth 2024-2029 (%)
- Exhibits124: Data Table on Canada - Year-over-year growth 2024-2029 (%)
- Exhibits125: Chart on Germany - Market size and forecast 2024-2029 ($ million)
- Exhibits126: Data Table on Germany - Market size and forecast 2024-2029 ($ million)
- Exhibits127: Chart on Germany - Year-over-year growth 2024-2029 (%)
- Exhibits128: Data Table on Germany - Year-over-year growth 2024-2029 (%)
- Exhibits129: Chart on China - Market size and forecast 2024-2029 ($ million)
- Exhibits130: Data Table on China - Market size and forecast 2024-2029 ($ million)
- Exhibits131: Chart on China - Year-over-year growth 2024-2029 (%)
- Exhibits132: Data Table on China - Year-over-year growth 2024-2029 (%)
- Exhibits133: Chart on Finland - Market size and forecast 2024-2029 ($ million)
- Exhibits134: Data Table on Finland - Market size and forecast 2024-2029 ($ million)
- Exhibits135: Chart on Finland - Year-over-year growth 2024-2029 (%)
- Exhibits136: Data Table on Finland - Year-over-year growth 2024-2029 (%)
- Exhibits137: Market opportunity By Geographical Landscape ($ million)
- Exhibits138: Data Tables on Market opportunity By Geographical Landscape ($ million)
- Exhibits139: Impact of drivers and challenges in 2024 and 2029
- Exhibits140: Overview on criticality of inputs and factors of differentiation
- Exhibits141: Overview on factors of disruption
- Exhibits142: Impact of key risks on business
- Exhibits143: Companies covered
- Exhibits144: Company ranking index
- Exhibits145: Matrix on companies position and classification
- Exhibits146: Altria Group Inc. - Overview
- Exhibits147: Altria Group Inc. - Business segments
- Exhibits148: Altria Group Inc. - Key offerings
- Exhibits149: Altria Group Inc. - Segment focus
- Exhibits150: SWOT
- Exhibits151: Another Snus Factory Stockholm AB - Overview
- Exhibits152: Another Snus Factory Stockholm AB - Product / Service
- Exhibits153: Another Snus Factory Stockholm AB - Key offerings
- Exhibits154: SWOT
- Exhibits155: British American Tobacco Plc - Overview
- Exhibits156: British American Tobacco Plc - Business segments
- Exhibits157: British American Tobacco Plc - Key offerings
- Exhibits158: British American Tobacco Plc - Segment focus
- Exhibits159: SWOT
- Exhibits160: Dholakia Tobacco Pvt. Ltd. - Overview
- Exhibits161: Dholakia Tobacco Pvt. Ltd. - Product / Service
- Exhibits162: Dholakia Tobacco Pvt. Ltd. - Key offerings
- Exhibits163: SWOT
- Exhibits164: Empire of Snus - Overview
- Exhibits165: Empire of Snus - Product / Service
- Exhibits166: Empire of Snus - Key offerings
- Exhibits167: SWOT
- Exhibits168: GN Tobacco Sweden AB - Overview
- Exhibits169: GN Tobacco Sweden AB - Product / Service
- Exhibits170: GN Tobacco Sweden AB - Key offerings
- Exhibits171: SWOT
- Exhibits172: Harsh International - Overview
- Exhibits173: Harsh International - Product / Service
- Exhibits174: Harsh International - Key offerings
- Exhibits175: SWOT
- Exhibits176: Imperial Brands Plc - Overview
- Exhibits177: Imperial Brands Plc - Business segments
- Exhibits178: Imperial Brands Plc - Key offerings
- Exhibits179: Imperial Brands Plc - Segment focus
- Exhibits180: SWOT
- Exhibits181: Japan Tobacco Inc. - Overview
- Exhibits182: Japan Tobacco Inc. - Business segments
- Exhibits183: Japan Tobacco Inc. - Key offerings
- Exhibits184: Japan Tobacco Inc. - Segment focus
- Exhibits185: SWOT
- Exhibits186: Philip Morris International Inc. - Overview
- Exhibits187: Philip Morris International Inc. - Business segments
- Exhibits188: Philip Morris International Inc. - Key offerings
- Exhibits189: Philip Morris International Inc. - Segment focus
- Exhibits190: SWOT
- Exhibits191: Swisher International Inc. - Overview
- Exhibits192: Swisher International Inc. - Product / Service
- Exhibits193: Swisher International Inc. - Key offerings
- Exhibits194: SWOT
- Exhibits195: TIGERSNUS ORGANIC SNUS TOBACCO - Overview
- Exhibits196: TIGERSNUS ORGANIC SNUS TOBACCO - Product / Service
- Exhibits197: TIGERSNUS ORGANIC SNUS TOBACCO - Key offerings
- Exhibits198: SWOT
- Exhibits199: Turning Point Brands Inc. - Overview
- Exhibits200: Turning Point Brands Inc. - Business segments
- Exhibits201: Turning Point Brands Inc. - Key offerings
- Exhibits202: Turning Point Brands Inc. - Segment focus
- Exhibits203: SWOT
- Exhibits204: Wilsons and Co. Sharrow Ltd. - Overview
- Exhibits205: Wilsons and Co. Sharrow Ltd. - Product / Service
- Exhibits206: Wilsons and Co. Sharrow Ltd. - Key offerings
- Exhibits207: SWOT
- Exhibits208: Inclusions checklist
- Exhibits209: Exclusions checklist
- Exhibits210: Currency conversion rates for US$
- Exhibits211: Research methodology
- Exhibits212: Information sources
- Exhibits213: Data validation
- Exhibits214: Validation techniques employed for market sizing
- Exhibits215: Data synthesis
- Exhibits216: 360 degree market analysis
- Exhibits217: List of abbreviations
The snus market is forecasted to grow by USD 1196.8 mn during 2024-2029, accelerating at a CAGR of 10.7% during the forecast period. The report on the snus market provides a holistic analysis, market size and forecast, trends, growth drivers, and challenges, as well as vendor analysis covering around 25 vendors.
The report offers an up-to-date analysis regarding the current market scenario, the latest trends and drivers, and the overall market environment. The market is driven by availability of flavored snus, lesser number of adverse health impacts from snus consumption, and increasing number of smoking bans.
| Market Scope | |
|---|---|
| Base Year | 2025 |
| End Year | 2029 |
| Series Year | 2025-2029 |
| Growth Momentum | Accelerate |
| YOY 2025 | 10% |
| CAGR | 10.7% |
| Incremental Value | $1196.8 mn |
Technavio's snus market is segmented as below:
By Flavor
- Mint
- Fruit
- Whiskey
- Others
By Product
- Portion
- Loose
By Geographical Landscape
- Europe
- North America
- APAC
- South America
- Middle East and Africa
This study identifies the changing consumption trends in global snus market as one of the prime reasons driving the snus market growth during the next few years. Also, online retailing and rising sustainability in raw tobacco sourcing will lead to sizable demand in the market.
The report on the snus market covers the following areas:
- Snus Market sizing
- Snus Market forecast
- Snus Market industry analysis
The robust vendor analysis is designed to help clients improve their market position, and in line with this, this report provides a detailed analysis of several leading snus market vendors that include Altria Group Inc., Another Snus Factory Stockholm AB, British American Tobacco Plc, Dholakia Tobacco Pvt. Ltd., Empire of Snus, GN Tobacco Sweden AB, Harsh International, Imperial Brands Plc, Japan Tobacco Inc., Philip Morris International Inc., Swisher International Inc., TIGERSNUS ORGANIC SNUS TOBACCO, Turning Point Brands Inc., and Wilsons and Co. Sharrow Ltd.. Also, the snus market analysis report includes information on upcoming trends and challenges that will influence market growth. This is to help companies strategize and leverage all forthcoming growth opportunities.
The study was conducted using an objective combination of primary and secondary information including inputs from key participants in the industry. The report contains a comprehensive market and vendor landscape in addition to an analysis of the key vendors.
The publisher presents a detailed picture of the market by the way of study, synthesis, and summation of data from multiple sources by an analysis of key parameters such as profit, pricing, competition, and promotions. It presents various market facets by identifying the key industry influencers. The data presented is comprehensive, reliable, and a result of extensive primary and secondary research. The market research reports provide a complete competitive landscape and an in-depth vendor selection methodology and analysis using qualitative and quantitative research to forecast accurate market growth.
Table of Contents
1 Executive Summary
- 1.1 Market overview
- Executive Summary - Chart on Market Overview
- Executive Summary - Data Table on Market Overview
- Executive Summary - Chart on Global Market Characteristics
- Executive Summary - Chart on Market By Geographical Landscape
- Executive Summary - Chart on Market Segmentation by Flavor
- Executive Summary - Chart on Market Segmentation by Product
- Executive Summary - Chart on Incremental Growth
- Executive Summary - Data Table on Incremental Growth
- Executive Summary - Chart on Company Market Positioning
2 Technavio Analysis
- 2.1 Analysis of price sensitivity, lifecycle, customer purchase basket, adoption rates, and purchase criteria
- Analysis of price sensitivity, lifecycle, customer purchase basket, adoption rates, and purchase criteria
- 2.2 Criticality of inputs and Factors of differentiation
- Overview on criticality of inputs and factors of differentiation
- 2.3 Factors of disruption
- Overview on factors of disruption
- 2.4 Impact of drivers and challenges
- Impact of drivers and challenges in 2024 and 2029
3 Market Landscape
- 3.1 Market ecosystem
- Parent Market
- Data Table on - Parent Market
- 3.2 Market characteristics
- Market characteristics analysis
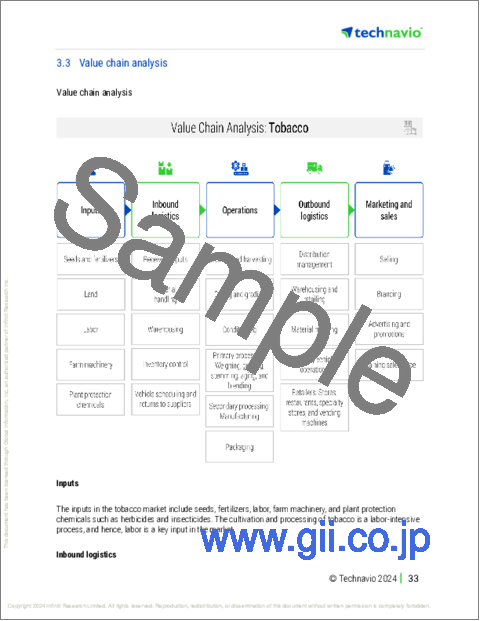
- 3.3 Value chain analysis
- Value chain analysis
4 Market Sizing
- 4.1 Market definition
- Offerings of companies included in the market definition
- 4.2 Market segment analysis
- Market segments
- 4.3 Market size 2024
- 4.4 Market outlook: Forecast for 2024-2029
- Chart on Global - Market size and forecast 2024-2029 ($ million)
- Data Table on Global - Market size and forecast 2024-2029 ($ million)
- Chart on Global Market: Year-over-year growth 2024-2029 (%)
- Data Table on Global Market: Year-over-year growth 2024-2029 (%)
5 Historic Market Size
- 5.1 Global Snus Market 2019 - 2023
- Historic Market Size - Data Table on Global Snus Market 2019 - 2023 ($ million)
- 5.2 Flavor segment analysis 2019 - 2023
- Historic Market Size - Flavor Segment 2019 - 2023 ($ million)
- 5.3 Product segment analysis 2019 - 2023
- Historic Market Size - Product Segment 2019 - 2023 ($ million)
- 5.4 Geography segment analysis 2019 - 2023
- Historic Market Size - Geography Segment 2019 - 2023 ($ million)
- 5.5 Country segment analysis 2019 - 2023
- Historic Market Size - Country Segment 2019 - 2023 ($ million)
6 Qualitative Analysis
- 6.1 Impact of AI on the Global Snus Market
7 Five Forces Analysis
- 7.1 Five forces summary
- Five forces analysis - Comparison between 2024 and 2029
- 7.2 Bargaining power of buyers
- Bargaining power of buyers - Impact of key factors 2024 and 2029
- 7.3 Bargaining power of suppliers
- Bargaining power of suppliers - Impact of key factors in 2024 and 2029
- 7.4 Threat of new entrants
- Threat of new entrants - Impact of key factors in 2024 and 2029
- 7.5 Threat of substitutes
- Threat of substitutes - Impact of key factors in 2024 and 2029
- 7.6 Threat of rivalry
- Threat of rivalry - Impact of key factors in 2024 and 2029
- 7.7 Market condition
- Chart on Market condition - Five forces 2024 and 2029
8 Market Segmentation by Flavor
- 8.1 Market segments
- Chart on Flavor - Market share 2024-2029 (%)
- Data Table on Flavor - Market share 2024-2029 (%)
- 8.2 Comparison by Flavor
- Chart on Comparison by Flavor
- Data Table on Comparison by Flavor
- 8.3 Mint - Market size and forecast 2024-2029
- Chart on Mint - Market size and forecast 2024-2029 ($ million)
- Data Table on Mint - Market size and forecast 2024-2029 ($ million)
- Chart on Mint - Year-over-year growth 2024-2029 (%)
- Data Table on Mint - Year-over-year growth 2024-2029 (%)
- 8.4 Fruit - Market size and forecast 2024-2029
- Chart on Fruit - Market size and forecast 2024-2029 ($ million)
- Data Table on Fruit - Market size and forecast 2024-2029 ($ million)
- Chart on Fruit - Year-over-year growth 2024-2029 (%)
- Data Table on Fruit - Year-over-year growth 2024-2029 (%)
- 8.5 Whiskey - Market size and forecast 2024-2029
- Chart on Whiskey - Market size and forecast 2024-2029 ($ million)
- Data Table on Whiskey - Market size and forecast 2024-2029 ($ million)
- Chart on Whiskey - Year-over-year growth 2024-2029 (%)
- Data Table on Whiskey - Year-over-year growth 2024-2029 (%)
- 8.6 Others - Market size and forecast 2024-2029
- Chart on Others - Market size and forecast 2024-2029 ($ million)
- Data Table on Others - Market size and forecast 2024-2029 ($ million)
- Chart on Others - Year-over-year growth 2024-2029 (%)
- Data Table on Others - Year-over-year growth 2024-2029 (%)
- 8.7 Market opportunity by Flavor
- Market opportunity by Flavor ($ million)
- Data Table on Market opportunity by Flavor ($ million)
9 Market Segmentation by Product
- 9.1 Market segments
- Chart on Product - Market share 2024-2029 (%)
- Data Table on Product - Market share 2024-2029 (%)
- 9.2 Comparison by Product
- Chart on Comparison by Product
- Data Table on Comparison by Product
- 9.3 Portion - Market size and forecast 2024-2029
- Chart on Portion - Market size and forecast 2024-2029 ($ million)
- Data Table on Portion - Market size and forecast 2024-2029 ($ million)
- Chart on Portion - Year-over-year growth 2024-2029 (%)
- Data Table on Portion - Year-over-year growth 2024-2029 (%)
- 9.4 Loose - Market size and forecast 2024-2029
- Chart on Loose - Market size and forecast 2024-2029 ($ million)
- Data Table on Loose - Market size and forecast 2024-2029 ($ million)
- Chart on Loose - Year-over-year growth 2024-2029 (%)
- Data Table on Loose - Year-over-year growth 2024-2029 (%)
- 9.5 Market opportunity by Product
- Market opportunity by Product ($ million)
- Data Table on Market opportunity by Product ($ million)
10 Customer Landscape
- 10.1 Customer landscape overview
- Analysis of price sensitivity, lifecycle, customer purchase basket, adoption rates, and purchase criteria
11 Geographic Landscape
- 11.1 Geographic segmentation
- Chart on Market share By Geographical Landscape 2024-2029 (%)
- Data Table on Market share By Geographical Landscape 2024-2029 (%)
- 11.2 Geographic comparison
- Chart on Geographic comparison
- Data Table on Geographic comparison
- 11.3 Europe - Market size and forecast 2024-2029
- Chart on Europe - Market size and forecast 2024-2029 ($ million)
- Data Table on Europe - Market size and forecast 2024-2029 ($ million)
- Chart on Europe - Year-over-year growth 2024-2029 (%)
- Data Table on Europe - Year-over-year growth 2024-2029 (%)
- 11.4 North America - Market size and forecast 2024-2029
- Chart on North America - Market size and forecast 2024-2029 ($ million)
- Data Table on North America - Market size and forecast 2024-2029 ($ million)
- Chart on North America - Year-over-year growth 2024-2029 (%)
- Data Table on North America - Year-over-year growth 2024-2029 (%)
- 11.5 APAC - Market size and forecast 2024-2029
- Chart on APAC - Market size and forecast 2024-2029 ($ million)
- Data Table on APAC - Market size and forecast 2024-2029 ($ million)
- Chart on APAC - Year-over-year growth 2024-2029 (%)
- Data Table on APAC - Year-over-year growth 2024-2029 (%)
- 11.6 South America - Market size and forecast 2024-2029
- Chart on South America - Market size and forecast 2024-2029 ($ million)
- Data Table on South America - Market size and forecast 2024-2029 ($ million)
- Chart on South America - Year-over-year growth 2024-2029 (%)
- Data Table on South America - Year-over-year growth 2024-2029 (%)
- 11.7 Middle East and Africa - Market size and forecast 2024-2029
- Chart on Middle East and Africa - Market size and forecast 2024-2029 ($ million)
- Data Table on Middle East and Africa - Market size and forecast 2024-2029 ($ million)
- Chart on Middle East and Africa - Year-over-year growth 2024-2029 (%)
- Data Table on Middle East and Africa - Year-over-year growth 2024-2029 (%)
- 11.8 Sweden - Market size and forecast 2024-2029
- Chart on Sweden - Market size and forecast 2024-2029 ($ million)
- Data Table on Sweden - Market size and forecast 2024-2029 ($ million)
- Chart on Sweden - Year-over-year growth 2024-2029 (%)
- Data Table on Sweden - Year-over-year growth 2024-2029 (%)
- 11.9 US - Market size and forecast 2024-2029
- Chart on US - Market size and forecast 2024-2029 ($ million)
- Data Table on US - Market size and forecast 2024-2029 ($ million)
- Chart on US - Year-over-year growth 2024-2029 (%)
- Data Table on US - Year-over-year growth 2024-2029 (%)
- 11.10 Norway - Market size and forecast 2024-2029
- Chart on Norway - Market size and forecast 2024-2029 ($ million)
- Data Table on Norway - Market size and forecast 2024-2029 ($ million)
- Chart on Norway - Year-over-year growth 2024-2029 (%)
- Data Table on Norway - Year-over-year growth 2024-2029 (%)
- 11.11 Poland - Market size and forecast 2024-2029
- Chart on Poland - Market size and forecast 2024-2029 ($ million)
- Data Table on Poland - Market size and forecast 2024-2029 ($ million)
- Chart on Poland - Year-over-year growth 2024-2029 (%)
- Data Table on Poland - Year-over-year growth 2024-2029 (%)
- 11.12 Spain - Market size and forecast 2024-2029
- Chart on Spain - Market size and forecast 2024-2029 ($ million)
- Data Table on Spain - Market size and forecast 2024-2029 ($ million)
- Chart on Spain - Year-over-year growth 2024-2029 (%)
- Data Table on Spain - Year-over-year growth 2024-2029 (%)
- 11.13 Denmark - Market size and forecast 2024-2029
- Chart on Denmark - Market size and forecast 2024-2029 ($ million)
- Data Table on Denmark - Market size and forecast 2024-2029 ($ million)
- Chart on Denmark - Year-over-year growth 2024-2029 (%)
- Data Table on Denmark - Year-over-year growth 2024-2029 (%)
- 11.14 Canada - Market size and forecast 2024-2029
- Chart on Canada - Market size and forecast 2024-2029 ($ million)
- Data Table on Canada - Market size and forecast 2024-2029 ($ million)
- Chart on Canada - Year-over-year growth 2024-2029 (%)
- Data Table on Canada - Year-over-year growth 2024-2029 (%)
- 11.15 Germany - Market size and forecast 2024-2029
- Chart on Germany - Market size and forecast 2024-2029 ($ million)
- Data Table on Germany - Market size and forecast 2024-2029 ($ million)
- Chart on Germany - Year-over-year growth 2024-2029 (%)
- Data Table on Germany - Year-over-year growth 2024-2029 (%)
- 11.16 China - Market size and forecast 2024-2029
- Chart on China - Market size and forecast 2024-2029 ($ million)
- Data Table on China - Market size and forecast 2024-2029 ($ million)
- Chart on China - Year-over-year growth 2024-2029 (%)
- Data Table on China - Year-over-year growth 2024-2029 (%)
- 11.17 Finland - Market size and forecast 2024-2029
- Chart on Finland - Market size and forecast 2024-2029 ($ million)
- Data Table on Finland - Market size and forecast 2024-2029 ($ million)
- Chart on Finland - Year-over-year growth 2024-2029 (%)
- Data Table on Finland - Year-over-year growth 2024-2029 (%)
- 11.18 Market opportunity By Geographical Landscape
- Market opportunity By Geographical Landscape ($ million)
- Data Tables on Market opportunity By Geographical Landscape ($ million)
12 Drivers, Challenges, and Opportunity/Restraints
- 12.1 Market drivers
- 12.2 Market challenges
- 12.3 Impact of drivers and challenges
- Impact of drivers and challenges in 2024 and 2029
- 12.4 Market opportunities/restraints
13 Competitive Landscape
- 13.1 Overview
- 13.2 Competitive Landscape
- Overview on criticality of inputs and factors of differentiation
- 13.3 Landscape disruption
- Overview on factors of disruption
- 13.4 Industry risks
- Impact of key risks on business
14 Competitive Analysis
- 14.1 Companies profiled
- Companies covered
- 14.2 Company ranking index
- Company ranking index
- 14.3 Market positioning of companies
- Matrix on companies position and classification
- 14.4 Altria Group Inc.
- Altria Group Inc. - Overview
- Altria Group Inc. - Business segments
- Altria Group Inc. - Key offerings
- Altria Group Inc. - Segment focus
- SWOT
- 14.5 Another Snus Factory Stockholm AB
- Another Snus Factory Stockholm AB - Overview
- Another Snus Factory Stockholm AB - Product / Service
- Another Snus Factory Stockholm AB - Key offerings
- SWOT
- 14.6 British American Tobacco Plc
- British American Tobacco Plc - Overview
- British American Tobacco Plc - Business segments
- British American Tobacco Plc - Key offerings
- British American Tobacco Plc - Segment focus
- SWOT
- 14.7 Dholakia Tobacco Pvt. Ltd.
- Dholakia Tobacco Pvt. Ltd. - Overview
- Dholakia Tobacco Pvt. Ltd. - Product / Service
- Dholakia Tobacco Pvt. Ltd. - Key offerings
- SWOT
- 14.8 Empire of Snus
- Empire of Snus - Overview
- Empire of Snus - Product / Service
- Empire of Snus - Key offerings
- SWOT
- 14.9 GN Tobacco Sweden AB
- GN Tobacco Sweden AB - Overview
- GN Tobacco Sweden AB - Product / Service
- GN Tobacco Sweden AB - Key offerings
- SWOT
- 14.10 Harsh International
- Harsh International - Overview
- Harsh International - Product / Service
- Harsh International - Key offerings
- SWOT
- 14.11 Imperial Brands Plc
- Imperial Brands Plc - Overview
- Imperial Brands Plc - Business segments
- Imperial Brands Plc - Key offerings
- Imperial Brands Plc - Segment focus
- SWOT
- 14.12 Japan Tobacco Inc.
- Japan Tobacco Inc. - Overview
- Japan Tobacco Inc. - Business segments
- Japan Tobacco Inc. - Key offerings
- Japan Tobacco Inc. - Segment focus
- SWOT
- 14.13 Philip Morris International Inc.
- Philip Morris International Inc. - Overview
- Philip Morris International Inc. - Business segments
- Philip Morris International Inc. - Key offerings
- Philip Morris International Inc. - Segment focus
- SWOT
- 14.14 Swisher International Inc.
- Swisher International Inc. - Overview
- Swisher International Inc. - Product / Service
- Swisher International Inc. - Key offerings
- SWOT
- 14.15 TIGERSNUS ORGANIC SNUS TOBACCO
- TIGERSNUS ORGANIC SNUS TOBACCO - Overview
- TIGERSNUS ORGANIC SNUS TOBACCO - Product / Service
- TIGERSNUS ORGANIC SNUS TOBACCO - Key offerings
- SWOT
- 14.16 Turning Point Brands Inc.
- Turning Point Brands Inc. - Overview
- Turning Point Brands Inc. - Business segments
- Turning Point Brands Inc. - Key offerings
- Turning Point Brands Inc. - Segment focus
- SWOT
- 14.17 Wilsons and Co. Sharrow Ltd.
- Wilsons and Co. Sharrow Ltd. - Overview
- Wilsons and Co. Sharrow Ltd. - Product / Service
- Wilsons and Co. Sharrow Ltd. - Key offerings
- SWOT
15 Appendix
- 15.1 Scope of the report
- 15.2 Inclusions and exclusions checklist
- Inclusions checklist
- Exclusions checklist
- 15.3 Currency conversion rates for US$
- Currency conversion rates for US$
- 15.4 Research methodology
- Research methodology
- 15.5 Data procurement
- Information sources
- 15.6 Data validation
- Data validation
- 15.7 Validation techniques employed for market sizing
- Validation techniques employed for market sizing
- 15.8 Data synthesis
- Data synthesis
- 15.9 360 degree market analysis
- 360 degree market analysis
- 15.10 List of abbreviations
- List of abbreviations
