|
|
市場調査レポート
商品コード
1491522
企業向けmラーニングの世界市場2024-2028Global corporate m-learning market 2024-2028 |
||||||

|
|||||||
カスタマイズ可能
|
|||||||


| 企業向けmラーニングの世界市場2024-2028 |
|
出版日: 2024年05月17日
発行: TechNavio
ページ情報: 英文 157 Pages
納期: 即納可能
|

全表示
- 概要
- 図表
- 目次
企業向けmラーニング市場は2023-2028年に628億米ドル、予測期間中のCAGRは24.68%で成長すると予測されます。
当レポートでは、企業向けmラーニング市場の全体的な分析、市場規模・予測、動向、成長促進要因、課題、約25のベンダーを網羅したベンダー分析などを掲載しています。
現在の市場シナリオ、最新動向と促進要因、市場環境全体に関する最新分析を提供しています。市場は、雇用者の従業員教育コストの削減、新興技術における熟練専門家への需要の高まり、クラウドコンピューティングの採用の高まりによって牽引されています。
| 市場範囲 | |
|---|---|
| 基準年 | 2024 |
| 終了年 | 2028 |
| 予測期間 | 2024-2028 |
| 成長モメンタム | 加速 |
| 前年比2024年 | 19.55% |
| CAGR | 24.68% |
| 増分額 | 628億米ドル |
本調査では、今後数年間の企業向けmラーニング市場成長を牽引する主な要因の1つとして、ゲームベースの学習人気の高まりを挙げています。また、企業向けmラーニングにアナリティクスが統合され、mラーニングソリューションに先進技術が統合されることで、市場の大きな需要が見込まれます。
目次
第1章 エグゼクティブサマリー
- 市場概要
第2章 市場情勢
- 市場エコシステム
- 市場の特徴
- バリューチェーン分析
第3章 市場規模の評価
- 市場の定義
- 市場セグメント分析
- 市場規模 2023
- 市場の見通し 2023-2028
第4章 市場規模実績
- 世界企業向けmラーニング市場 2018-2022
- タイプセグメント分析 2018-2022
- エンドユーザーセグメント分析 2018-2022
- 地域別セグメント分析 2018-2022
- 国別セグメント分析 2018-2022
第5章 ファイブフォース分析
- ファイブフォースの要約
- 買い手の交渉力
- 供給企業の交渉力
- 新規参入業者の脅威
- 代替品の脅威
- 競争の脅威
- 市況
第6章 市場セグメンテーション:タイプ別
- 市場セグメンテーション
- 比較:タイプ別
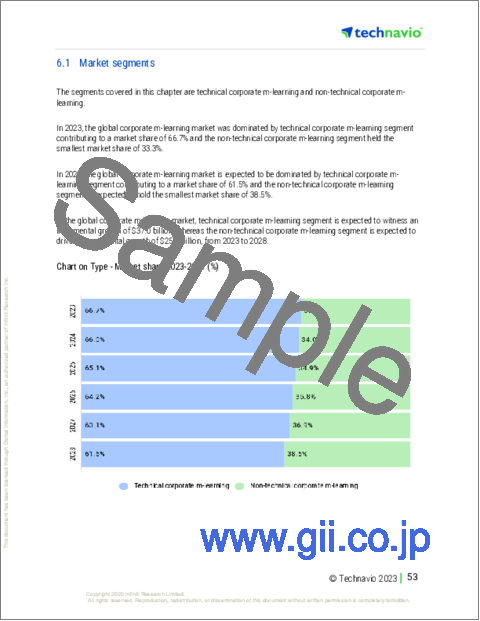
- 技術的な企業向けmラーニング:市場規模と予測 2023-2028
- 非技術的な企業向けmラーニング:市場規模と予測 2023-2028
- 市場機会:タイプ別
第7章 市場セグメンテーション:エンドユーザー別
- 市場セグメンテーション
- 比較:エンドユーザー別
- 大企業:市場規模と予測 2023-2028
- 中小企業:市場規模と予測 2023-2028
- 市場機会:エンドユーザー別
第8章 顧客情勢
- 顧客情勢の概要
第9章 地域別情勢
- 地域別セグメンテーション
- 地域別比較
- アジア太平洋:市場規模と予測 2023-2028
- 北米:市場規模と予測 2023-2028
- 欧州:市場規模と予測 2023-2028
- 中東・アフリカ:市場規模と予測 2023-2028
- 南米:市場規模と予測 2023-2028
- 米国:市場規模と予測 2023-2028
- インド:市場規模と予測 2023-2028
- 英国:市場規模と予測 2023-2028
- ドイツ:市場規模と予測 2023-2028
- 日本:市場規模と予測 2023-2028
- 市場機会:地域情勢別
第10章 促進要因・課題・機会・抑制要因
- 市場促進要因
- 市場の課題
- 促進要因と課題の影響
- 市場の機会・抑制要因
第11章 競合情勢
- 概要
- 競合情勢
- 混乱の状況
- 業界のリスク
第12章 競合分析
- 企業プロファイル
- 企業の市場ポジショニング
- Adobe Inc.
- Allen Interactions Inc.
- Aptara Inc.
- Articulate Global Inc.
- Blackboard Inc.
- Citrix Systems Inc.
- Cornerstone OnDemand Inc.
- D2L Corp.
- dominKnow Inc.
- EdApp
- Higher Learning Technologies Corp.
- Kallidus Ltd.
- Koch Industries Inc.
- Learning Pool
- Qstream Inc.
第13章 付録
Exhibits:
- Exhibits1: Executive Summary - Chart on Market Overview
- Exhibits2: Executive Summary - Data Table on Market Overview
- Exhibits3: Executive Summary - Chart on Global Market Characteristics
- Exhibits4: Executive Summary - Chart on Market By Geographical Landscape
- Exhibits5: Executive Summary - Chart on Market Segmentation by Type
- Exhibits6: Executive Summary - Chart on Market Segmentation by End-user
- Exhibits7: Executive Summary - Chart on Incremental Growth
- Exhibits8: Executive Summary - Data Table on Incremental Growth
- Exhibits9: Executive Summary - Chart on Company Market Positioning
- Exhibits10: Parent Market
- Exhibits11: Data Table on - Parent Market
- Exhibits12: Market characteristics analysis
- Exhibits13: Value Chain Analysis
- Exhibits14: Offerings of companies included in the market definition
- Exhibits15: Market segments
- Exhibits16: Chart on Global - Market size and forecast 2023-2028 ($ billion)
- Exhibits17: Data Table on Global - Market size and forecast 2023-2028 ($ billion)
- Exhibits18: Chart on Global Market: Year-over-year growth 2023-2028 (%)
- Exhibits19: Data Table on Global Market: Year-over-year growth 2023-2028 (%)
- Exhibits20: Historic Market Size - Data Table on Global Corporate M-Learning Market 2018 - 2022 ($ billion)
- Exhibits21: Historic Market Size - Type Segment 2018 - 2022 ($ billion)
- Exhibits22: Historic Market Size - End-user Segment 2018 - 2022 ($ billion)
- Exhibits23: Historic Market Size - Geography Segment 2018 - 2022 ($ billion)
- Exhibits24: Historic Market Size - Country Segment 2018 - 2022 ($ billion)
- Exhibits25: Five forces analysis - Comparison between 2023 and 2028
- Exhibits26: Bargaining power of buyers - Impact of key factors 2023 and 2028
- Exhibits27: Bargaining power of suppliers - Impact of key factors in 2023 and 2028
- Exhibits28: Threat of new entrants - Impact of key factors in 2023 and 2028
- Exhibits29: Threat of substitutes - Impact of key factors in 2023 and 2028
- Exhibits30: Threat of rivalry - Impact of key factors in 2023 and 2028
- Exhibits31: Chart on Market condition - Five forces 2023 and 2028
- Exhibits32: Chart on Type - Market share 2023-2028 (%)
- Exhibits33: Data Table on Type - Market share 2023-2028 (%)
- Exhibits34: Chart on Comparison by Type
- Exhibits35: Data Table on Comparison by Type
- Exhibits36: Chart on Technical corporate m-learning - Market size and forecast 2023-2028 ($ billion)
- Exhibits37: Data Table on Technical corporate m-learning - Market size and forecast 2023-2028 ($ billion)
- Exhibits38: Chart on Technical corporate m-learning - Year-over-year growth 2023-2028 (%)
- Exhibits39: Data Table on Technical corporate m-learning - Year-over-year growth 2023-2028 (%)
- Exhibits40: Chart on Non-technical corporate m-learning - Market size and forecast 2023-2028 ($ billion)
- Exhibits41: Data Table on Non-technical corporate m-learning - Market size and forecast 2023-2028 ($ billion)
- Exhibits42: Chart on Non-technical corporate m-learning - Year-over-year growth 2023-2028 (%)
- Exhibits43: Data Table on Non-technical corporate m-learning - Year-over-year growth 2023-2028 (%)
- Exhibits44: Market opportunity by Type ($ billion)
- Exhibits45: Data Table on Market opportunity by Type ($ billion)
- Exhibits46: Chart on End-user - Market share 2023-2028 (%)
- Exhibits47: Data Table on End-user - Market share 2023-2028 (%)
- Exhibits48: Chart on Comparison by End-user
- Exhibits49: Data Table on Comparison by End-user
- Exhibits50: Chart on Large organizations - Market size and forecast 2023-2028 ($ billion)
- Exhibits51: Data Table on Large organizations - Market size and forecast 2023-2028 ($ billion)
- Exhibits52: Chart on Large organizations - Year-over-year growth 2023-2028 (%)
- Exhibits53: Data Table on Large organizations - Year-over-year growth 2023-2028 (%)
- Exhibits54: Chart on Small and medium-sized enterprises - Market size and forecast 2023-2028 ($ billion)
- Exhibits55: Data Table on Small and medium-sized enterprises - Market size and forecast 2023-2028 ($ billion)
- Exhibits56: Chart on Small and medium-sized enterprises - Year-over-year growth 2023-2028 (%)
- Exhibits57: Data Table on Small and medium-sized enterprises - Year-over-year growth 2023-2028 (%)
- Exhibits58: Market opportunity by End-user ($ billion)
- Exhibits59: Data Table on Market opportunity by End-user ($ billion)
- Exhibits60: Analysis of price sensitivity, lifecycle, customer purchase basket, adoption rates, and purchase criteria
- Exhibits61: Chart on Market share By Geographical Landscape 2023-2028 (%)
- Exhibits62: Data Table on Market share By Geographical Landscape 2023-2028 (%)
- Exhibits63: Chart on Geographic comparison
- Exhibits64: Data Table on Geographic comparison
- Exhibits65: Chart on APAC - Market size and forecast 2023-2028 ($ billion)
- Exhibits66: Data Table on APAC - Market size and forecast 2023-2028 ($ billion)
- Exhibits67: Chart on APAC - Year-over-year growth 2023-2028 (%)
- Exhibits68: Data Table on APAC - Year-over-year growth 2023-2028 (%)
- Exhibits69: Chart on North America - Market size and forecast 2023-2028 ($ billion)
- Exhibits70: Data Table on North America - Market size and forecast 2023-2028 ($ billion)
- Exhibits71: Chart on North America - Year-over-year growth 2023-2028 (%)
- Exhibits72: Data Table on North America - Year-over-year growth 2023-2028 (%)
- Exhibits73: Chart on Europe - Market size and forecast 2023-2028 ($ billion)
- Exhibits74: Data Table on Europe - Market size and forecast 2023-2028 ($ billion)
- Exhibits75: Chart on Europe - Year-over-year growth 2023-2028 (%)
- Exhibits76: Data Table on Europe - Year-over-year growth 2023-2028 (%)
- Exhibits77: Chart on Middle East and Africa - Market size and forecast 2023-2028 ($ billion)
- Exhibits78: Data Table on Middle East and Africa - Market size and forecast 2023-2028 ($ billion)
- Exhibits79: Chart on Middle East and Africa - Year-over-year growth 2023-2028 (%)
- Exhibits80: Data Table on Middle East and Africa - Year-over-year growth 2023-2028 (%)
- Exhibits81: Chart on South America - Market size and forecast 2023-2028 ($ billion)
- Exhibits82: Data Table on South America - Market size and forecast 2023-2028 ($ billion)
- Exhibits83: Chart on South America - Year-over-year growth 2023-2028 (%)
- Exhibits84: Data Table on South America - Year-over-year growth 2023-2028 (%)
- Exhibits85: Chart on US - Market size and forecast 2023-2028 ($ billion)
- Exhibits86: Data Table on US - Market size and forecast 2023-2028 ($ billion)
- Exhibits87: Chart on US - Year-over-year growth 2023-2028 (%)
- Exhibits88: Data Table on US - Year-over-year growth 2023-2028 (%)
- Exhibits89: Chart on India - Market size and forecast 2023-2028 ($ billion)
- Exhibits90: Data Table on India - Market size and forecast 2023-2028 ($ billion)
- Exhibits91: Chart on India - Year-over-year growth 2023-2028 (%)
- Exhibits92: Data Table on India - Year-over-year growth 2023-2028 (%)
- Exhibits93: Chart on UK - Market size and forecast 2023-2028 ($ billion)
- Exhibits94: Data Table on UK - Market size and forecast 2023-2028 ($ billion)
- Exhibits95: Chart on UK - Year-over-year growth 2023-2028 (%)
- Exhibits96: Data Table on UK - Year-over-year growth 2023-2028 (%)
- Exhibits97: Chart on Germany - Market size and forecast 2023-2028 ($ billion)
- Exhibits98: Data Table on Germany - Market size and forecast 2023-2028 ($ billion)
- Exhibits99: Chart on Germany - Year-over-year growth 2023-2028 (%)
- Exhibits100: Data Table on Germany - Year-over-year growth 2023-2028 (%)
- Exhibits101: Chart on Japan - Market size and forecast 2023-2028 ($ billion)
- Exhibits102: Data Table on Japan - Market size and forecast 2023-2028 ($ billion)
- Exhibits103: Chart on Japan - Year-over-year growth 2023-2028 (%)
- Exhibits104: Data Table on Japan - Year-over-year growth 2023-2028 (%)
- Exhibits105: Market opportunity By Geographical Landscape ($ billion)
- Exhibits106: Data Tables on Market opportunity By Geographical Landscape ($ billion)
- Exhibits107: Impact of drivers and challenges in 2023 and 2028
- Exhibits108: Overview on criticality of inputs and factors of differentiation
- Exhibits109: Overview on factors of disruption
- Exhibits110: Impact of key risks on business
- Exhibits111: Companies covered
- Exhibits112: Matrix on companies position and classification
- Exhibits113: Adobe Inc. - Overview
- Exhibits114: Adobe Inc. - Business segments
- Exhibits115: Adobe Inc. - Key offerings
- Exhibits116: Adobe Inc. - Segment focus
- Exhibits117: Allen Interactions Inc. - Overview
- Exhibits118: Allen Interactions Inc. - Product / Service
- Exhibits119: Allen Interactions Inc. - Key offerings
- Exhibits120: Aptara Inc. - Overview
- Exhibits121: Aptara Inc. - Product / Service
- Exhibits122: Aptara Inc. - Key offerings
- Exhibits123: Articulate Global Inc. - Overview
- Exhibits124: Articulate Global Inc. - Product / Service
- Exhibits125: Articulate Global Inc. - Key offerings
- Exhibits126: Blackboard Inc. - Overview
- Exhibits127: Blackboard Inc. - Product / Service
- Exhibits128: Blackboard Inc. - Key offerings
- Exhibits129: Citrix Systems Inc. - Overview
- Exhibits130: Citrix Systems Inc. - Product / Service
- Exhibits131: Citrix Systems Inc. - Key offerings
- Exhibits132: Cornerstone OnDemand Inc. - Overview
- Exhibits133: Cornerstone OnDemand Inc. - Product / Service
- Exhibits134: Cornerstone OnDemand Inc. - Key offerings
- Exhibits135: D2L Corp. - Overview
- Exhibits136: D2L Corp. - Product / Service
- Exhibits137: D2L Corp. - Key offerings
- Exhibits138: dominKnow Inc. - Overview
- Exhibits139: dominKnow Inc. - Product / Service
- Exhibits140: dominKnow Inc. - Key offerings
- Exhibits141: EdApp - Overview
- Exhibits142: EdApp - Product / Service
- Exhibits143: EdApp - Key offerings
- Exhibits144: Higher Learning Technologies Corp. - Overview
- Exhibits145: Higher Learning Technologies Corp. - Product / Service
- Exhibits146: Higher Learning Technologies Corp. - Key offerings
- Exhibits147: Kallidus Ltd. - Overview
- Exhibits148: Kallidus Ltd. - Product / Service
- Exhibits149: Kallidus Ltd. - Key offerings
- Exhibits150: Koch Industries Inc. - Overview
- Exhibits151: Koch Industries Inc. - Product / Service
- Exhibits152: Koch Industries Inc. - Key offerings
- Exhibits153: Learning Pool - Overview
- Exhibits154: Learning Pool - Product / Service
- Exhibits155: Learning Pool - Key offerings
- Exhibits156: Qstream Inc. - Overview
- Exhibits157: Qstream Inc. - Product / Service
- Exhibits158: Qstream Inc. - Key offerings
- Exhibits159: Inclusions checklist
- Exhibits160: Exclusions checklist
- Exhibits161: Currency conversion rates for US$
- Exhibits162: Research methodology
- Exhibits163: Information sources
- Exhibits164: Data validation
- Exhibits165: Validation techniques employed for market sizing
- Exhibits166: Data synthesis
- Exhibits167: 360 degree market analysis
- Exhibits168: List of abbreviations
The corporate m-learning market is forecasted to grow by USD 62.8 bn during 2023-2028, accelerating at a CAGR of 24.68% during the forecast period. The report on the corporate m-learning market provides a holistic analysis, market size and forecast, trends, growth drivers, and challenges, as well as vendor analysis covering around 25 vendors.
The report offers an up-to-date analysis regarding the current market scenario, the latest trends and drivers, and the overall market environment. The market is driven by reduction in employee training cost for employers, growing demand for skilled professionals in emerging technologies, and rising adoption of cloud computing.
Technavio's corporate m-learning market is segmented as below:
| Market Scope | |
|---|---|
| Base Year | 2024 |
| End Year | 2028 |
| Series Year | 2024-2028 |
| Growth Momentum | Accelerate |
| YOY 2024 | 19.55% |
| CAGR | 24.68% |
| Incremental Value | $62.8bn |
ByType
- Technical corporate m-learning
- Non-technical corporate m-learning
ByEnd-user
- Large organizations
- Small and medium-sized enterprises
ByGeography
- APAC
- North America
- Europe
- Middle East and Africa
- South America
This study identifies the growing popularity of game-based learning as one of the prime reasons driving the corporate m-learning market growth during the next few years. Also, the integration of analytics in corporate m-learning and the integration of advanced technologies in m-learning solution will lead to sizable demand in the market.
The report on the corporate m-learning market covers the following areas:
- Corporate m-learning market sizing
- Corporate m-learning market forecast
- Corporate m-learning market industry analysis
The robust vendor analysis is designed to help clients improve their market position, and in line with this, this report provides a detailed analysis of several leading corporate m-learning market vendors that include Adobe Inc., Allen Interactions Inc., Aptara Inc., Articulate Global Inc., Blackboard Inc., Citrix Systems Inc., Cornerstone OnDemand Inc., D2L Inc, dominKnow Inc., EdApp, Higher Learning Technologies Corp., Kallidus Ltd., Koch Industries Inc., Learning Pool, Meridian Knowledge Solutions LLC, Promethean World Ltd., Qstream Inc., SumTotal Systems LLC, Upside Learning Solutions Pvt. Ltd., and Yarno. Also, the corporate m-learning market analysis report includes information on upcoming trends and challenges that will influence market growth. This is to help companies strategize and leverage all forthcoming growth opportunities.
The study was conducted using an objective combination of primary and secondary information including inputs from key participants in the industry. The report contains a comprehensive market and vendor landscape in addition to an analysis of the key vendors.
The publisher presents a detailed picture of the market by way of study, synthesis, and summation of data from multiple sources through an analysis of key parameters such as profit, pricing, competition, and promotions. It presents various market facets by identifying the key industry influencers. The data presented is comprehensive, reliable, and a result of extensive research - both primary and secondary. The market research reports provide a complete competitive landscape and an in-depth vendor selection methodology and analysis using qualitative and quantitative research to forecast accurate market growth.
Table of Contents
1 Executive Summary
- 1.1 Market overview
- Executive Summary - Chart on Market Overview
- Executive Summary - Data Table on Market Overview
- Executive Summary - Chart on Global Market Characteristics
- Executive Summary - Chart on Market By Geographical Landscape
- Executive Summary - Chart on Market Segmentation by Type
- Executive Summary - Chart on Market Segmentation by End-user
- Executive Summary - Chart on Incremental Growth
- Executive Summary - Data Table on Incremental Growth
- Executive Summary - Chart on Company Market Positioning
2 Market Landscape
- 2.1 Market ecosystem
- Parent Market
- Data Table on - Parent Market
- 2.2 Market characteristics
- Market characteristics analysis
- 2.3 Value chain analysis
- Value Chain Analysis
3 Market Sizing
- 3.1 Market definition
- Offerings of companies included in the market definition
- 3.2 Market segment analysis
- Market segments
- 3.3 Market size 2023
- 3.4 Market outlook: Forecast for 2023-2028
- Chart on Global - Market size and forecast 2023-2028 ($ billion)
- Data Table on Global - Market size and forecast 2023-2028 ($ billion)
- Chart on Global Market: Year-over-year growth 2023-2028 (%)
- Data Table on Global Market: Year-over-year growth 2023-2028 (%)
4 Historic Market Size
- 4.1 Global Corporate M-Learning Market 2018 - 2022
- Historic Market Size - Data Table on Global Corporate M-Learning Market 2018 - 2022 ($ billion)
- 4.2 Type segment analysis 2018 - 2022
- Historic Market Size - Type Segment 2018 - 2022 ($ billion)
- 4.3 End-user segment analysis 2018 - 2022
- Historic Market Size - End-user Segment 2018 - 2022 ($ billion)
- 4.4 Geography segment analysis 2018 - 2022
- Historic Market Size - Geography Segment 2018 - 2022 ($ billion)
- 4.5 Country segment analysis 2018 - 2022
- Historic Market Size - Country Segment 2018 - 2022 ($ billion)
5 Five Forces Analysis
- 5.1 Five forces summary
- Five forces analysis - Comparison between 2023 and 2028
- 5.2 Bargaining power of buyers
- Bargaining power of buyers - Impact of key factors 2023 and 2028
- 5.3 Bargaining power of suppliers
- Bargaining power of suppliers - Impact of key factors in 2023 and 2028
- 5.4 Threat of new entrants
- Threat of new entrants - Impact of key factors in 2023 and 2028
- 5.5 Threat of substitutes
- Threat of substitutes - Impact of key factors in 2023 and 2028
- 5.6 Threat of rivalry
- Threat of rivalry - Impact of key factors in 2023 and 2028
- 5.7 Market condition
- Chart on Market condition - Five forces 2023 and 2028
6 Market Segmentation by Type
- 6.1 Market segments
- Chart on Type - Market share 2023-2028 (%)
- Data Table on Type - Market share 2023-2028 (%)
- 6.2 Comparison by Type
- Chart on Comparison by Type
- Data Table on Comparison by Type
- 6.3 Technical corporate m-learning - Market size and forecast 2023-2028
- Chart on Technical corporate m-learning - Market size and forecast 2023-2028 ($ billion)
- Data Table on Technical corporate m-learning - Market size and forecast 2023-2028 ($ billion)
- Chart on Technical corporate m-learning - Year-over-year growth 2023-2028 (%)
- Data Table on Technical corporate m-learning - Year-over-year growth 2023-2028 (%)
- 6.4 Non-technical corporate m-learning - Market size and forecast 2023-2028
- Chart on Non-technical corporate m-learning - Market size and forecast 2023-2028 ($ billion)
- Data Table on Non-technical corporate m-learning - Market size and forecast 2023-2028 ($ billion)
- Chart on Non-technical corporate m-learning - Year-over-year growth 2023-2028 (%)
- Data Table on Non-technical corporate m-learning - Year-over-year growth 2023-2028 (%)
- 6.5 Market opportunity by Type
- Market opportunity by Type ($ billion)
- Data Table on Market opportunity by Type ($ billion)
7 Market Segmentation by End-user
- 7.1 Market segments
- Chart on End-user - Market share 2023-2028 (%)
- Data Table on End-user - Market share 2023-2028 (%)
- 7.2 Comparison by End-user
- Chart on Comparison by End-user
- Data Table on Comparison by End-user
- 7.3 Large organizations - Market size and forecast 2023-2028
- Chart on Large organizations - Market size and forecast 2023-2028 ($ billion)
- Data Table on Large organizations - Market size and forecast 2023-2028 ($ billion)
- Chart on Large organizations - Year-over-year growth 2023-2028 (%)
- Data Table on Large organizations - Year-over-year growth 2023-2028 (%)
- 7.4 Small and medium-sized enterprises - Market size and forecast 2023-2028
- Chart on Small and medium-sized enterprises - Market size and forecast 2023-2028 ($ billion)
- Data Table on Small and medium-sized enterprises - Market size and forecast 2023-2028 ($ billion)
- Chart on Small and medium-sized enterprises - Year-over-year growth 2023-2028 (%)
- Data Table on Small and medium-sized enterprises - Year-over-year growth 2023-2028 (%)
- 7.5 Market opportunity by End-user
- Market opportunity by End-user ($ billion)
- Data Table on Market opportunity by End-user ($ billion)
8 Customer Landscape
- 8.1 Customer landscape overview
- Analysis of price sensitivity, lifecycle, customer purchase basket, adoption rates, and purchase criteria
9 Geographic Landscape
- 9.1 Geographic segmentation
- Chart on Market share By Geographical Landscape 2023-2028 (%)
- Data Table on Market share By Geographical Landscape 2023-2028 (%)
- 9.2 Geographic comparison
- Chart on Geographic comparison
- Data Table on Geographic comparison
- 9.3 APAC - Market size and forecast 2023-2028
- Chart on APAC - Market size and forecast 2023-2028 ($ billion)
- Data Table on APAC - Market size and forecast 2023-2028 ($ billion)
- Chart on APAC - Year-over-year growth 2023-2028 (%)
- Data Table on APAC - Year-over-year growth 2023-2028 (%)
- 9.4 North America - Market size and forecast 2023-2028
- Chart on North America - Market size and forecast 2023-2028 ($ billion)
- Data Table on North America - Market size and forecast 2023-2028 ($ billion)
- Chart on North America - Year-over-year growth 2023-2028 (%)
- Data Table on North America - Year-over-year growth 2023-2028 (%)
- 9.5 Europe - Market size and forecast 2023-2028
- Chart on Europe - Market size and forecast 2023-2028 ($ billion)
- Data Table on Europe - Market size and forecast 2023-2028 ($ billion)
- Chart on Europe - Year-over-year growth 2023-2028 (%)
- Data Table on Europe - Year-over-year growth 2023-2028 (%)
- 9.6 Middle East and Africa - Market size and forecast 2023-2028
- Chart on Middle East and Africa - Market size and forecast 2023-2028 ($ billion)
- Data Table on Middle East and Africa - Market size and forecast 2023-2028 ($ billion)
- Chart on Middle East and Africa - Year-over-year growth 2023-2028 (%)
- Data Table on Middle East and Africa - Year-over-year growth 2023-2028 (%)
- 9.7 South America - Market size and forecast 2023-2028
- Chart on South America - Market size and forecast 2023-2028 ($ billion)
- Data Table on South America - Market size and forecast 2023-2028 ($ billion)
- Chart on South America - Year-over-year growth 2023-2028 (%)
- Data Table on South America - Year-over-year growth 2023-2028 (%)
- 9.8 US - Market size and forecast 2023-2028
- Chart on US - Market size and forecast 2023-2028 ($ billion)
- Data Table on US - Market size and forecast 2023-2028 ($ billion)
- Chart on US - Year-over-year growth 2023-2028 (%)
- Data Table on US - Year-over-year growth 2023-2028 (%)
- 9.9 India - Market size and forecast 2023-2028
- Chart on India - Market size and forecast 2023-2028 ($ billion)
- Data Table on India - Market size and forecast 2023-2028 ($ billion)
- Chart on India - Year-over-year growth 2023-2028 (%)
- Data Table on India - Year-over-year growth 2023-2028 (%)
- 9.10 UK - Market size and forecast 2023-2028
- Chart on UK - Market size and forecast 2023-2028 ($ billion)
- Data Table on UK - Market size and forecast 2023-2028 ($ billion)
- Chart on UK - Year-over-year growth 2023-2028 (%)
- Data Table on UK - Year-over-year growth 2023-2028 (%)
- 9.11 Germany - Market size and forecast 2023-2028
- Chart on Germany - Market size and forecast 2023-2028 ($ billion)
- Data Table on Germany - Market size and forecast 2023-2028 ($ billion)
- Chart on Germany - Year-over-year growth 2023-2028 (%)
- Data Table on Germany - Year-over-year growth 2023-2028 (%)
- 9.12 Japan - Market size and forecast 2023-2028
- Chart on Japan - Market size and forecast 2023-2028 ($ billion)
- Data Table on Japan - Market size and forecast 2023-2028 ($ billion)
- Chart on Japan - Year-over-year growth 2023-2028 (%)
- Data Table on Japan - Year-over-year growth 2023-2028 (%)
- 9.13 Market opportunity By Geographical Landscape
- Market opportunity By Geographical Landscape ($ billion)
- Data Tables on Market opportunity By Geographical Landscape ($ billion)
10 Drivers, Challenges, and Opportunity/Restraints
- 10.1 Market drivers
- 10.2 Market challenges
- 10.3 Impact of drivers and challenges
- Impact of drivers and challenges in 2023 and 2028
- 10.4 Market opportunities/restraints
11 Competitive Landscape
- 11.1 Overview
- 11.2 Competitive Landscape
- Overview on criticality of inputs and factors of differentiation
- 11.3 Landscape disruption
- Overview on factors of disruption
- 11.4 Industry risks
- Impact of key risks on business
12 Competitive Analysis
- 12.1 Companies profiled
- Companies covered
- 12.2 Market positioning of companies
- Matrix on companies position and classification
- 12.3 Adobe Inc.
- Adobe Inc. - Overview
- Adobe Inc. - Business segments
- Adobe Inc. - Key offerings
- Adobe Inc. - Segment focus
- 12.4 Allen Interactions Inc.
- Allen Interactions Inc. - Overview
- Allen Interactions Inc. - Product / Service
- Allen Interactions Inc. - Key offerings
- 12.5 Aptara Inc.
- Aptara Inc. - Overview
- Aptara Inc. - Product / Service
- Aptara Inc. - Key offerings
- 12.6 Articulate Global Inc.
- Articulate Global Inc. - Overview
- Articulate Global Inc. - Product / Service
- Articulate Global Inc. - Key offerings
- 12.7 Blackboard Inc.
- Blackboard Inc. - Overview
- Blackboard Inc. - Product / Service
- Blackboard Inc. - Key offerings
- 12.8 Citrix Systems Inc.
- Citrix Systems Inc. - Overview
- Citrix Systems Inc. - Product / Service
- Citrix Systems Inc. - Key offerings
- 12.9 Cornerstone OnDemand Inc.
- Cornerstone OnDemand Inc. - Overview
- Cornerstone OnDemand Inc. - Product / Service
- Cornerstone OnDemand Inc. - Key offerings
- 12.10 D2L Corp.
- D2L Corp. - Overview
- D2L Corp. - Product / Service
- D2L Corp. - Key offerings
- 12.11 dominKnow Inc.
- dominKnow Inc. - Overview
- dominKnow Inc. - Product / Service
- dominKnow Inc. - Key offerings
- 12.12 EdApp
- EdApp - Overview
- EdApp - Product / Service
- EdApp - Key offerings
- 12.13 Higher Learning Technologies Corp.
- Higher Learning Technologies Corp. - Overview
- Higher Learning Technologies Corp. - Product / Service
- Higher Learning Technologies Corp. - Key offerings
- 12.14 Kallidus Ltd.
- Kallidus Ltd. - Overview
- Kallidus Ltd. - Product / Service
- Kallidus Ltd. - Key offerings
- 12.15 Koch Industries Inc.
- Koch Industries Inc. - Overview
- Koch Industries Inc. - Product / Service
- Koch Industries Inc. - Key offerings
- 12.16 Learning Pool
- Learning Pool - Overview
- Learning Pool - Product / Service
- Learning Pool - Key offerings
- 12.17 Qstream Inc.
- Qstream Inc. - Overview
- Qstream Inc. - Product / Service
- Qstream Inc. - Key offerings
13 Appendix
- 13.1 Scope of the report
- 13.2 Inclusions and exclusions checklist
- Inclusions checklist
- Exclusions checklist
- 13.3 Currency conversion rates for US$
- Currency conversion rates for US$
- 13.4 Research methodology
- Research methodology
- 13.5 Data procurement
- Information sources
- 13.6 Data validation
- Data validation
- 13.7 Validation techniques employed for market sizing
- Validation techniques employed for market sizing
- 13.8 Data synthesis
- Data synthesis
- 13.9 360 degree market analysis
- 360 degree market analysis
- 13.10 List of abbreviations
- List of abbreviations

