|
|
市場調査レポート
商品コード
1462487
食品テクスチャーの世界市場 2024-2028Global Food Texture Market 2024-2028 |
||||||
|
|||||||
カスタマイズ可能
|
|||||||

| 食品テクスチャーの世界市場 2024-2028 |
|
出版日: 2024年04月01日
発行: TechNavio
ページ情報: 英文 173 Pages
納期: 即納可能
|

全表示
- 概要
- 図表
- 目次
食品テクスチャー市場は2023-2028年に41億5,000万米ドル、予測期間中のCAGRは4.57%で成長すると予測されます。
当レポートでは、食品テクスチャー市場の全体的な分析、市場規模・予測、動向、成長促進要因、課題、約25のベンダーを網羅したベンダー分析などを掲載しています。
現在の市場シナリオ、最新動向と促進要因、市場環境全体に関する最新分析を提供しています。市場は、食品の保存期間を延長する食品テクスチャー製品に対する需要の高まり、消費者の健康とウェルネスに対する意識の高まり、コンビニエンスフードに対する需要の高まりによって牽引されています。
| 市場範囲 | |
|---|---|
| 基準年 | 2024 |
| 終了年 | 2028 |
| 予測期間 | 2024-2028 |
| 成長モメンタム | 加速 |
| 前年比2024年 | 4.15% |
| CAGR | 4.57% |
| 増分額 | 41億5,000万米ドル |
本調査では、今後数年間の食品テクスチャー市場の成長を促進する主な理由の1つとして、市場ベンダー間の戦略的提携の高まりを挙げています。また、食品加工技術の革新や、職人的で審美的な食品に対する消費者の志向の高まりも、市場の大きな需要につながるであろう。
目次
第1章 エグゼクティブサマリー
- 市場概要
第2章 市場情勢
- 市場エコシステム
第3章 市場規模の評価
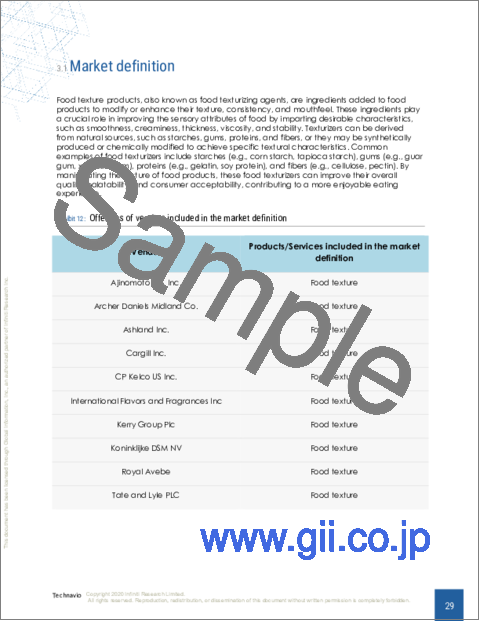
- 市場の定義
- 市場セグメント分析
- 市場規模 2023
- 市場の見通し 2023-2028
第4章 市場規模実績
- 食品テクスチャーの世界市場 2018-2022
- 製品セグメント分析 2018-2022
- ソースセグメント分析 2018-2022
- 地域別セグメント分析 2018-2022
- 国別セグメント分析 2018-2022
第5章 ファイブフォース分析
- ファイブフォースの要約
- 買い手の交渉力
- 供給企業の交渉力
- 新規参入業者の脅威
- 代替品の脅威
- 競争の脅威
- 市況
第6章 市場セグメンテーション:製品別
- 市場セグメント
- 比較:製品別
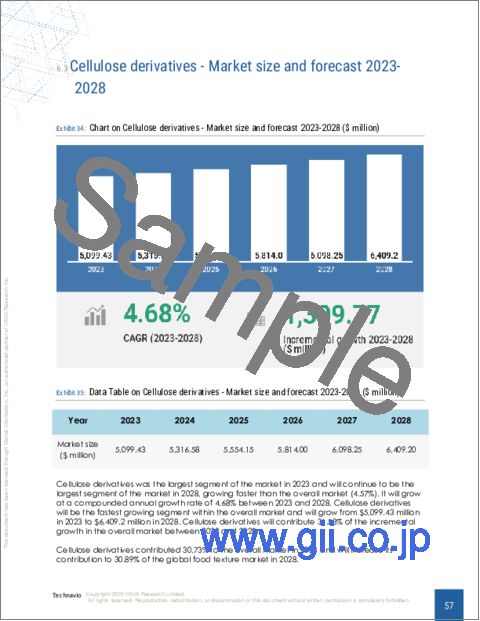
- セルロース誘導体:市場規模と予測 2023-2028
- GPG:市場規模と予測 2023-2028
- スターチ:市場規模と予測 2023-2028
- その他:市場規模と予測 2023-2028
- 市場機会:製品別
第7章 市場セグメンテーション:ソース別
- 市場セグメント
- 比較:ソース別
- 天然:市場規模と予測 2023-2028
- 合成:市場規模と予測 2023-2028
- 市場機会:ソース別
第8章 顧客情勢
- 顧客情勢の概要
第9章 地域別情勢
- 地域別セグメンテーション
- 地域別比較
- 北米:市場規模と予測 2023-2028
- 欧州:市場規模と予測 2023-2028
- アジア太平洋:市場規模と予測 2023-2028
- 南米:市場規模と予測 2023-2028
- 中東・アフリカ:市場規模と予測 2023-2028
- 米国:市場規模と予測 2023-2028
- 中国:市場規模と予測 2023-2028
- カナダ:市場規模と予測 2023-2028
- ドイツ:市場規模と予測 2023-2028
- 英国:市場規模と予測 2023-2028
- 市場機会:地域情勢別
第10章 促進要因、課題、および動向
- 市場促進要因
- 市場の課題
- 促進要因と課題の影響
- 市場動向
第11章 ベンダー情勢
- 概要
- ベンダー情勢
- 混乱の状況
- 業界のリスク
第12章 ベンダー分析
- 対象ベンダー
- ベンダーの市場ポジショニング
- Ajinomoto Co. Inc.
- Archer Daniels Midland Co.
- Ashland Inc.
- Cargill Inc.
- CP Kelco US Inc.
- Deosen Biochemical(Ordos)Ltd.
- Estelle Chemicals Pvt. Ltd.
- Fiberstar Inc.
- Ingredion Inc.
- International Flavors and Fragrances Inc
- Kerry Group Plc
- Koninklijke DSM NV
- Riken Vitamin Co. Ltd.
- Royal Avebe
- Tate and Lyle PLC
第13章 付録
Exhibits:
- Exhibits1: Executive Summary - Chart on Market Overview
- Exhibits2: Executive Summary - Data Table on Market Overview
- Exhibits3: Executive Summary - Chart on Global Market Characteristics
- Exhibits4: Executive Summary - Chart on Market By Geographical Landscape
- Exhibits5: Executive Summary - Chart on Market Segmentation by Product
- Exhibits6: Executive Summary - Chart on Market Segmentation by Source
- Exhibits7: Executive Summary - Chart on Incremental Growth
- Exhibits8: Executive Summary - Data Table on Incremental Growth
- Exhibits9: Executive Summary - Chart on Vendor Market Positioning
- Exhibits10: Parent market
- Exhibits11: Market Characteristics
- Exhibits12: Offerings of vendors included in the market definition
- Exhibits13: Market segments
- Exhibits14: Chart on Global - Market size and forecast 2023-2028 ($ billion)
- Exhibits15: Data Table on Global - Market size and forecast 2023-2028 ($ billion)
- Exhibits16: Chart on Global Market: Year-over-year growth 2023-2028 (%)
- Exhibits17: Data Table on Global Market: Year-over-year growth 2023-2028 (%)
- Exhibits18: Historic Market Size - Data Table on global food texture market 2018 - 2022 ($ billion)
- Exhibits19: Historic Market Size - Product Segment 2018 - 2022 ($ billion)
- Exhibits20: Historic Market Size - Source Segment 2018 - 2022 ($ billion)
- Exhibits21: Historic Market Size - Geography Segment 2018 - 2022 ($ billion)
- Exhibits22: Historic Market Size - Country Segment 2018 - 2022 ($ billion)
- Exhibits23: Five forces analysis - Comparison between 2023 and 2028
- Exhibits24: Chart on Bargaining power of buyers - Impact of key factors 2023 and 2028
- Exhibits25: Bargaining power of suppliers - Impact of key factors in 2023 and 2028
- Exhibits26: Threat of new entrants - Impact of key factors in 2023 and 2028
- Exhibits27: Threat of substitutes - Impact of key factors in 2023 and 2028
- Exhibits28: Threat of rivalry - Impact of key factors in 2023 and 2028
- Exhibits29: Chart on Market condition - Five forces 2023 and 2028
- Exhibits30: Chart on Product - Market share 2023-2028 (%)
- Exhibits31: Data Table on Product - Market share 2023-2028 (%)
- Exhibits32: Chart on Comparison by Product
- Exhibits33: Data Table on Comparison by Product
- Exhibits34: Chart on Cellulose derivatives - Market size and forecast 2023-2028 ($ billion)
- Exhibits35: Data Table on Cellulose derivatives - Market size and forecast 2023-2028 ($ billion)
- Exhibits36: Chart on Cellulose derivatives - Year-over-year growth 2023-2028 (%)
- Exhibits37: Data Table on Cellulose derivatives - Year-over-year growth 2023-2028 (%)
- Exhibits38: Chart on GPG - Market size and forecast 2023-2028 ($ billion)
- Exhibits39: Data Table on GPG - Market size and forecast 2023-2028 ($ billion)
- Exhibits40: Chart on GPG - Year-over-year growth 2023-2028 (%)
- Exhibits41: Data Table on GPG - Year-over-year growth 2023-2028 (%)
- Exhibits42: Chart on Starch - Market size and forecast 2023-2028 ($ billion)
- Exhibits43: Data Table on Starch - Market size and forecast 2023-2028 ($ billion)
- Exhibits44: Chart on Starch - Year-over-year growth 2023-2028 (%)
- Exhibits45: Data Table on Starch - Year-over-year growth 2023-2028 (%)
- Exhibits46: Chart on Others - Market size and forecast 2023-2028 ($ billion)
- Exhibits47: Data Table on Others - Market size and forecast 2023-2028 ($ billion)
- Exhibits48: Chart on Others - Year-over-year growth 2023-2028 (%)
- Exhibits49: Data Table on Others - Year-over-year growth 2023-2028 (%)
- Exhibits50: Market opportunity by Product ($ billion)
- Exhibits51: Data Table on Market opportunity by Product ($ billion)
- Exhibits52: Chart on Source - Market share 2023-2028 (%)
- Exhibits53: Data Table on Source - Market share 2023-2028 (%)
- Exhibits54: Chart on Comparison by Source
- Exhibits55: Data Table on Comparison by Source
- Exhibits56: Chart on Natural - Market size and forecast 2023-2028 ($ billion)
- Exhibits57: Data Table on Natural - Market size and forecast 2023-2028 ($ billion)
- Exhibits58: Chart on Natural - Year-over-year growth 2023-2028 (%)
- Exhibits59: Data Table on Natural - Year-over-year growth 2023-2028 (%)
- Exhibits60: Chart on Synthetic - Market size and forecast 2023-2028 ($ billion)
- Exhibits61: Data Table on Synthetic - Market size and forecast 2023-2028 ($ billion)
- Exhibits62: Chart on Synthetic - Year-over-year growth 2023-2028 (%)
- Exhibits63: Data Table on Synthetic - Year-over-year growth 2023-2028 (%)
- Exhibits64: Market opportunity by Source ($ billion)
- Exhibits65: Data Table on Market opportunity by Source ($ billion)
- Exhibits66: Analysis of price sensitivity, lifecycle, customer purchase basket, adoption rates, and purchase criteria
- Exhibits67: Chart on Market share By Geographical Landscape 2023-2028 (%)
- Exhibits68: Data Table on Market share By Geographical Landscape 2023-2028 (%)
- Exhibits69: Chart on Geographic comparison
- Exhibits70: Data Table on Geographic comparison
- Exhibits71: Chart on North America - Market size and forecast 2023-2028 ($ billion)
- Exhibits72: Data Table on North America - Market size and forecast 2023-2028 ($ billion)
- Exhibits73: Chart on North America - Year-over-year growth 2023-2028 (%)
- Exhibits74: Data Table on North America - Year-over-year growth 2023-2028 (%)
- Exhibits75: Chart on Europe - Market size and forecast 2023-2028 ($ billion)
- Exhibits76: Data Table on Europe - Market size and forecast 2023-2028 ($ billion)
- Exhibits77: Chart on Europe - Year-over-year growth 2023-2028 (%)
- Exhibits78: Data Table on Europe - Year-over-year growth 2023-2028 (%)
- Exhibits79: Chart on APAC - Market size and forecast 2023-2028 ($ billion)
- Exhibits80: Data Table on APAC - Market size and forecast 2023-2028 ($ billion)
- Exhibits81: Chart on APAC - Year-over-year growth 2023-2028 (%)
- Exhibits82: Data Table on APAC - Year-over-year growth 2023-2028 (%)
- Exhibits83: Chart on South America - Market size and forecast 2023-2028 ($ billion)
- Exhibits84: Data Table on South America - Market size and forecast 2023-2028 ($ billion)
- Exhibits85: Chart on South America - Year-over-year growth 2023-2028 (%)
- Exhibits86: Data Table on South America - Year-over-year growth 2023-2028 (%)
- Exhibits87: Chart on Middle East and Africa - Market size and forecast 2023-2028 ($ billion)
- Exhibits88: Data Table on Middle East and Africa - Market size and forecast 2023-2028 ($ billion)
- Exhibits89: Chart on Middle East and Africa - Year-over-year growth 2023-2028 (%)
- Exhibits90: Data Table on Middle East and Africa - Year-over-year growth 2023-2028 (%)
- Exhibits91: Chart on US - Market size and forecast 2023-2028 ($ billion)
- Exhibits92: Data Table on US - Market size and forecast 2023-2028 ($ billion)
- Exhibits93: Chart on US - Year-over-year growth 2023-2028 (%)
- Exhibits94: Data Table on US - Year-over-year growth 2023-2028 (%)
- Exhibits95: Chart on China - Market size and forecast 2023-2028 ($ billion)
- Exhibits96: Data Table on China - Market size and forecast 2023-2028 ($ billion)
- Exhibits97: Chart on China - Year-over-year growth 2023-2028 (%)
- Exhibits98: Data Table on China - Year-over-year growth 2023-2028 (%)
- Exhibits99: Chart on Canada - Market size and forecast 2023-2028 ($ billion)
- Exhibits100: Data Table on Canada - Market size and forecast 2023-2028 ($ billion)
- Exhibits101: Chart on Canada - Year-over-year growth 2023-2028 (%)
- Exhibits102: Data Table on Canada - Year-over-year growth 2023-2028 (%)
- Exhibits103: Chart on Germany - Market size and forecast 2023-2028 ($ billion)
- Exhibits104: Data Table on Germany - Market size and forecast 2023-2028 ($ billion)
- Exhibits105: Chart on Germany - Year-over-year growth 2023-2028 (%)
- Exhibits106: Data Table on Germany - Year-over-year growth 2023-2028 (%)
- Exhibits107: Chart on UK - Market size and forecast 2023-2028 ($ billion)
- Exhibits108: Data Table on UK - Market size and forecast 2023-2028 ($ billion)
- Exhibits109: Chart on UK - Year-over-year growth 2023-2028 (%)
- Exhibits110: Data Table on UK - Year-over-year growth 2023-2028 (%)
- Exhibits111: Market opportunity By Geographical Landscape ($ billion)
- Exhibits112: Data Tables on Market opportunity By Geographical Landscape ($ billion)
- Exhibits113: Impact of drivers and challenges in 2023 and 2028
- Exhibits114: Overview on Criticality of inputs and Factors of differentiation
- Exhibits115: Overview on factors of disruption
- Exhibits116: Impact of key risks on business
- Exhibits117: Vendors covered
- Exhibits118: Matrix on vendor position and classification
- Exhibits119: Ajinomoto Co. Inc. - Overview
- Exhibits120: Ajinomoto Co. Inc. - Business segments
- Exhibits121: Ajinomoto Co. Inc. - Key offerings
- Exhibits122: Ajinomoto Co. Inc. - Segment focus
- Exhibits123: Archer Daniels Midland Co. - Overview
- Exhibits124: Archer Daniels Midland Co. - Business segments
- Exhibits125: Archer Daniels Midland Co. - Key news
- Exhibits126: Archer Daniels Midland Co. - Key offerings
- Exhibits127: Archer Daniels Midland Co. - Segment focus
- Exhibits128: Ashland Inc. - Overview
- Exhibits129: Ashland Inc. - Business segments
- Exhibits130: Ashland Inc. - Key news
- Exhibits131: Ashland Inc. - Key offerings
- Exhibits132: Ashland Inc. - Segment focus
- Exhibits133: Cargill Inc. - Overview
- Exhibits134: Cargill Inc. - Product / Service
- Exhibits135: Cargill Inc. - Key news
- Exhibits136: Cargill Inc. - Key offerings
- Exhibits137: CP Kelco US Inc. - Overview
- Exhibits138: CP Kelco US Inc. - Product / Service
- Exhibits139: CP Kelco US Inc. - Key offerings
- Exhibits140: Deosen Biochemical (Ordos) Ltd. - Overview
- Exhibits141: Deosen Biochemical (Ordos) Ltd. - Product / Service
- Exhibits142: Deosen Biochemical (Ordos) Ltd. - Key offerings
- Exhibits143: Estelle Chemicals Pvt. Ltd. - Overview
- Exhibits144: Estelle Chemicals Pvt. Ltd. - Product / Service
- Exhibits145: Estelle Chemicals Pvt. Ltd. - Key offerings
- Exhibits146: Fiberstar Inc. - Overview
- Exhibits147: Fiberstar Inc. - Product / Service
- Exhibits148: Fiberstar Inc. - Key offerings
- Exhibits149: Ingredion Inc. - Overview
- Exhibits150: Ingredion Inc. - Business segments
- Exhibits151: Ingredion Inc. - Key offerings
- Exhibits152: Ingredion Inc. - Segment focus
- Exhibits153: International Flavors and Fragrances Inc - Overview
- Exhibits154: International Flavors and Fragrances Inc - Business segments
- Exhibits155: International Flavors and Fragrances Inc - Key news
- Exhibits156: International Flavors and Fragrances Inc - Key offerings
- Exhibits157: International Flavors and Fragrances Inc - Segment focus
- Exhibits158: Kerry Group Plc - Overview
- Exhibits159: Kerry Group Plc - Business segments
- Exhibits160: Kerry Group Plc - Key offerings
- Exhibits161: Kerry Group Plc - Segment focus
- Exhibits162: Koninklijke DSM NV - Overview
- Exhibits163: Koninklijke DSM NV - Business segments
- Exhibits164: Koninklijke DSM NV - Key news
- Exhibits165: Koninklijke DSM NV - Key offerings
- Exhibits166: Koninklijke DSM NV - Segment focus
- Exhibits167: Riken Vitamin Co. Ltd. - Overview
- Exhibits168: Riken Vitamin Co. Ltd. - Key offerings
- Exhibits169: Royal Avebe - Overview
- Exhibits170: Royal Avebe - Product / Service
- Exhibits171: Royal Avebe - Key offerings
- Exhibits172: Tate and Lyle PLC - Overview
- Exhibits173: Tate and Lyle PLC - Business segments
- Exhibits174: Tate and Lyle PLC - Key offerings
- Exhibits175: Tate and Lyle PLC - Segment focus
- Exhibits176: Inclusions checklist
- Exhibits177: Exclusions checklist
- Exhibits178: Currency conversion rates for US$
- Exhibits179: Research methodology
- Exhibits180: Validation techniques employed for market sizing
- Exhibits181: Information sources
- Exhibits182: List of abbreviations
The food texture market is forecasted to grow by USD 4.15 bn during 2023-2028, accelerating at a CAGR of 4.57% during the forecast period. The report on the food texture market provides a holistic analysis, market size and forecast, trends, growth drivers, and challenges, as well as vendor analysis covering around 25 vendors.
The report offers an up-to-date analysis regarding the current market scenario, the latest trends and drivers, and the overall market environment. The market is driven by rising demand for food texture products that extend shelf-life of food products, increasing awareness of health and wellness among consumers, and rising demand for convenience food.
Technavio's food texture market is segmented as below:
| Market Scope | |
|---|---|
| Base Year | 2024 |
| End Year | 2028 |
| Series Year | 2024-2028 |
| Growth Momentum | Accelerate |
| YOY 2024 | 4.15% |
| CAGR | 4.57% |
| Incremental Value | $4.15bn |
By Product
- Cellulose derivatives
- GPG
- Starch
- Others
By Source
- Natural
- Synthetic
By Geographical Landscape
- North America
- Europe
- APAC
- South America
- Middle East and Africa
This study identifies the rising strategic alliances among market vendors as one of the prime reasons driving the food texture market growth during the next few years. Also, innovation in food processing technologies and rising consumer inclination for artisanal and aesthetically pleasing foods will lead to sizable demand in the market.
The report on the food texture market covers the following areas:
- Food texture market sizing
- Food texture market forecast
- Food texture market industry analysis
The robust vendor analysis is designed to help clients improve their market position, and in line with this, this report provides a detailed analysis of several leading food texture market vendors that include Ajinomoto Co. Inc., Archer Daniels Midland Co., Ashland Inc., CP Kelco US Inc., Deosen Biochemical (Ordos) Ltd., Estelle Chemicals Pvt. Ltd., Fiberstar Inc., Ingredion Inc., International Flavors and Fragrances Inc, JELU WERK J. Ehrler GmbH and Co. KG, Jungbunzlauer Suisse AG, Kerry Group Plc, Koninklijke DSM NV, Levapan S.A., Riken Vitamin Co. Ltd., Royal Avebe, SELECTAROME, Tate and Lyle PLC, Willy Benecke GmbH, and Cargill Inc.. Also, the food texture market analysis report includes information on upcoming trends and challenges that will influence market growth. This is to help companies strategize and leverage all forthcoming growth opportunities.
The study was conducted using an objective combination of primary and secondary information including inputs from key participants in the industry. The report contains a comprehensive market and vendor landscape in addition to an analysis of the key vendors.
The publisher presents a detailed picture of the market by the way of study, synthesis, and summation of data from multiple sources by an analysis of key parameters such as profit, pricing, competition, and promotions. It presents various market facets by identifying the key industry influencers. The data presented is comprehensive, reliable, and a result of extensive research - both primary and secondary. The market research reports provide a complete competitive landscape and an in-depth vendor selection methodology and analysis using qualitative and quantitative research to forecast the accurate market growth.
Table of Contents
1 Executive Summary
- 1.1 Market overview
2 Market Landscape
- 2.1 Market ecosystem
3 Market Sizing
- 3.1 Market definition
- 3.2 Market segment analysis
- 3.3 Market size 2023
- 3.4 Market outlook: Forecast for 2023-2028
4 Historic Market Size
- 4.1 Global food texture market 2018 - 2022
- 4.2 Product Segment Analysis 2018 - 2022
- 4.3 Source Segment Analysis 2018 - 2022
- 4.4 Geography Segment Analysis 2018 - 2022
- 4.5 Country Segment Analysis 2018 - 2022
5 Five Forces Analysis
- 5.1 Five forces summary
- 5.2 Bargaining power of buyers
- 5.3 Bargaining power of suppliers
- 5.4 Threat of new entrants
- 5.5 Threat of substitutes
- 5.6 Threat of rivalry
- 5.7 Market condition
6 Market Segmentation by Product
- 6.1 Market segments
- 6.2 Comparison by Product
- 6.3 Cellulose derivatives - Market size and forecast 2023-2028
- 6.4 GPG - Market size and forecast 2023-2028
- 6.5 Starch - Market size and forecast 2023-2028
- 6.6 Others - Market size and forecast 2023-2028
- 6.7 Market opportunity by Product
7 Market Segmentation by Source
- 7.1 Market segments
- 7.2 Comparison by Source
- 7.3 Natural - Market size and forecast 2023-2028
- 7.4 Synthetic - Market size and forecast 2023-2028
- 7.5 Market opportunity by Source
8 Customer Landscape
- 8.1 Customer landscape overview
9 Geographic Landscape
- 9.1 Geographic segmentation
- 9.2 Geographic comparison
- 9.3 North America - Market size and forecast 2023-2028
- 9.4 Europe - Market size and forecast 2023-2028
- 9.5 APAC - Market size and forecast 2023-2028
- 9.6 South America - Market size and forecast 2023-2028
- 9.7 Middle East and Africa - Market size and forecast 2023-2028
- 9.8 US - Market size and forecast 2023-2028
- 9.9 China - Market size and forecast 2023-2028
- 9.10 Canada - Market size and forecast 2023-2028
- 9.11 Germany - Market size and forecast 2023-2028
- 9.12 UK - Market size and forecast 2023-2028
- 9.13 Market opportunity By Geographical Landscape
10 Drivers, Challenges, and Trends
- 10.1 Market drivers
- 10.2 Market challenges
- 10.3 Impact of drivers and challenges
- 10.4 Market trends
11 Vendor Landscape
- 11.1 Overview
- 11.2 Vendor landscape
- 11.3 Landscape disruption
- 11.4 Industry risks
12 Vendor Analysis
- 12.1 Vendors covered
- 12.2 Market positioning of vendors
- 12.3 Ajinomoto Co. Inc.
- 12.4 Archer Daniels Midland Co.
- 12.5 Ashland Inc.
- 12.6 Cargill Inc.
- 12.7 CP Kelco US Inc.
- 12.8 Deosen Biochemical (Ordos) Ltd.
- 12.9 Estelle Chemicals Pvt. Ltd.
- 12.10 Fiberstar Inc.
- 12.11 Ingredion Inc.
- 12.12 International Flavors and Fragrances Inc
- 12.13 Kerry Group Plc
- 12.14 Koninklijke DSM NV
- 12.15 Riken Vitamin Co. Ltd.
- 12.16 Royal Avebe
- 12.17 Tate and Lyle PLC
13 Appendix
- 13.1 Scope of the report
- 13.2 Inclusions and exclusions checklist
- 13.3 Currency conversion rates for US$
- 13.4 Research methodology
- 13.5 List of abbreviations

