|
|
市場調査レポート
商品コード
1459554
エンタープライズ・モビリティ・サービスの世界市場 2024-2028Global Enterprise Mobility Services Market 2024-2028 |
||||||

|
|||||||
カスタマイズ可能
|
|||||||


| エンタープライズ・モビリティ・サービスの世界市場 2024-2028 |
|
出版日: 2024年03月21日
発行: TechNavio
ページ情報: 英文 179 Pages
納期: 即納可能
|

全表示
- 概要
- 図表
- 目次
エンタープライズ・モビリティ・サービス市場は2023-2028年に145億米ドル、予測期間中のCAGRは23.88%で成長すると予測されます。
当レポートでは、エンタープライズ・モビリティ・サービス市場の全体的な分析、市場規模・予測、動向、成長促進要因、課題、約25のベンダーを網羅したベンダー分析などを掲載しています。
現在の市場シナリオ、最新動向と促進要因、市場環境全体に関する最新分析を提供しています。市場は、企業におけるモバイルデバイスの使用の増加、リアルタイムデータアクセスのニーズの高まり、リモートワークモデルの採用の高まりによって牽引されています。
| 市場範囲 | |
|---|---|
| 基準年 | 2024 |
| 終了年 | 2028 |
| 予測期間 | 2024-2028 |
| 成長モメンタム | 加速 |
| 前年比2024年 | 22.9% |
| CAGR | 23.88% |
| 増分額 | 145億米ドル |
本調査では、今後数年間におけるエンタープライズ・モビリティ・サービス市場の成長を促進する主な要因の1つとして、企業における労働生産性と効率性に対する需要の高まりを挙げています。また、エンタープライズ・モビリティ・サービスにおけるAIやML技術の利用拡大や、クラウドベースのエンタープライズ・モビリティ・サービスの利用拡大も、市場の大きな需要につながるとしています。
目次
第1章 エグゼクティブサマリー
- 市場概要
第2章 市場情勢
- 市場エコシステム
第3章 市場規模の評価
- 市場の定義
- 市場セグメント分析
- 市場規模 2023
- 市場の見通し 2023-2028
第4章 市場規模実績
- エンタープライズ・モビリティ・サービスの世界市場 2018-2022
- 用途別セグメント分析 2018-2022
- エンドユーザーセグメント分析 2018-2022
- 地域別セグメント分析 2018-2022
- 国別セグメント分析 2018-2022
第5章 ファイブフォース分析
- ファイブフォースの要約
- 買い手の交渉力
- 供給企業の交渉力
- 新規参入業者の脅威
- 代替品の脅威
- 競争の脅威
- 市況
第6章 市場セグメンテーション:用途別
- 市場セグメント
- 比較:用途別
- 大企業:市場規模と予測 2023-2028
- 中小企業:市場規模と予測 2023-2028
- 市場機会:用途別
第7章 市場セグメンテーション:エンドユーザー別
- 市場セグメント
- 比較:エンドユーザー別
- 英国:市場規模と予測 2023-2028
- 小売業とeコマース:市場規模と予測 2023-2028
- ITと通信:市場規模と予測 2023-2028
- ヘルスケアとライフサイエンス:市場規模と予測 2023-2028
- 政府とその他:市場規模と予測 2023-2028
- 市場機会:エンドユーザー別
第8章 顧客情勢
- 顧客情勢の概要
第9章 地域別情勢
- 地域別セグメンテーション
- 地域別比較
- 北米:市場規模と予測 2023-2028
- 欧州:市場規模と予測 2023-2028
- アジア太平洋:市場規模と予測 2023-2028
- 南米:市場規模と予測 2023-2028
- 中東・アフリカ:市場規模と予測 2023-2028
- 米国:市場規模と予測 2023-2028
- 中国:市場規模と予測 2023-2028
- 英国:市場規模と予測 2023-2028
- ドイツ:市場規模と予測 2023-2028
- 日本:市場規模と予測 2023-2028
- 市場機会:地域別
第10章 促進要因、課題、および動向
- 市場促進要因
- 市場の課題
- 促進要因と課題の影響
- 市場動向
第11章 ベンダー情勢
- 概要
- ベンダー情勢
- 混乱の状況
- 業界のリスク
第12章 ベンダー分析
- 対象ベンダー
- ベンダーの市場ポジショニング
- BlackBerry Ltd.
- Cisco Systems Inc.
- Citrix Systems Inc.
- GoTo
- Infosys Ltd.
- International Business Machines Corp.
- Ivanti Software Inc.
- Matrix42 GmbH
- Microsoft Corp.
- Mitsogo Inc.
- SAP SE
- Sophos Ltd.
- SOTI Inc.
- Ventraq Corp.
- Zoho Corp. Pvt. Ltd.
第13章 付録
Exhibits:
- Exhibits1: Executive Summary - Chart on Market Overview
- Exhibits2: Executive Summary - Data Table on Market Overview
- Exhibits3: Executive Summary - Chart on Global Market Characteristics
- Exhibits4: Executive Summary - Chart on Market by Geography
- Exhibits5: Executive Summary - Chart on Market Segmentation by Application
- Exhibits6: Executive Summary - Chart on Market Segmentation by End-user
- Exhibits7: Executive Summary - Chart on Incremental Growth
- Exhibits8: Executive Summary - Data Table on Incremental Growth
- Exhibits9: Executive Summary - Chart on Vendor Market Positioning
- Exhibits10: Parent market
- Exhibits11: Market Characteristics
- Exhibits12: Offerings of vendors included in the market definition
- Exhibits13: Market segments
- Exhibits14: Chart on Global - Market size and forecast 2023-2028 ($ billion)
- Exhibits15: Data Table on Global - Market size and forecast 2023-2028 ($ billion)
- Exhibits16: Chart on Global Market: Year-over-year growth 2023-2028 (%)
- Exhibits17: Data Table on Global Market: Year-over-year growth 2023-2028 (%)
- Exhibits18: Historic Market Size - Data Table on global enterprise mobility services market 2018 - 2022 ($ billion)
- Exhibits19: Historic Market Size - Application Segment 2018 - 2022 ($ billion)
- Exhibits20: Historic Market Size - End-user Segment 2018 - 2022 ($ billion)
- Exhibits21: Historic Market Size - Geography Segment 2018 - 2022 ($ billion)
- Exhibits22: Historic Market Size - Country Segment 2018 - 2022 ($ billion)
- Exhibits23: Five forces analysis - Comparison between 2023 and 2028
- Exhibits24: Chart on Bargaining power of buyers - Impact of key factors 2023 and 2028
- Exhibits25: Bargaining power of suppliers - Impact of key factors in 2023 and 2028
- Exhibits26: Threat of new entrants - Impact of key factors in 2023 and 2028
- Exhibits27: Threat of substitutes - Impact of key factors in 2023 and 2028
- Exhibits28: Threat of rivalry - Impact of key factors in 2023 and 2028
- Exhibits29: Chart on Market condition - Five forces 2023 and 2028
- Exhibits30: Chart on Application - Market share 2023-2028 (%)
- Exhibits31: Data Table on Application - Market share 2023-2028 (%)
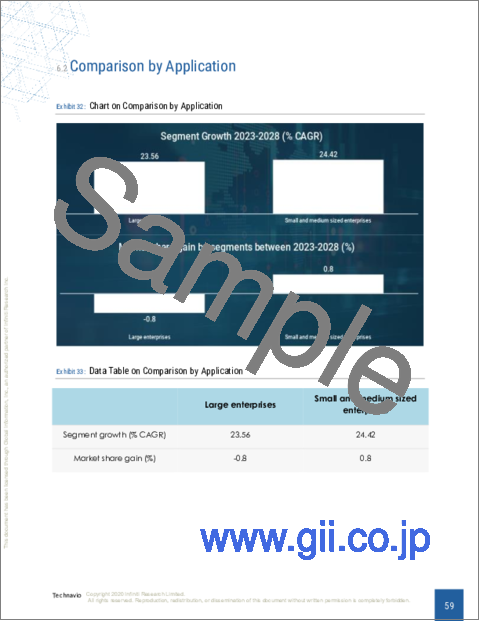
- Exhibits32: Chart on Comparison by Application
- Exhibits33: Data Table on Comparison by Application
- Exhibits34: Chart on Large enterprises - Market size and forecast 2023-2028 ($ billion)
- Exhibits35: Data Table on Large enterprises - Market size and forecast 2023-2028 ($ billion)
- Exhibits36: Chart on Large enterprises - Year-over-year growth 2023-2028 (%)
- Exhibits37: Data Table on Large enterprises - Year-over-year growth 2023-2028 (%)
- Exhibits38: Chart on Small and medium sized enterprises - Market size and forecast 2023-2028 ($ billion)
- Exhibits39: Data Table on Small and medium sized enterprises - Market size and forecast 2023-2028 ($ billion)
- Exhibits40: Chart on Small and medium sized enterprises - Year-over-year growth 2023-2028 (%)
- Exhibits41: Data Table on Small and medium sized enterprises - Year-over-year growth 2023-2028 (%)
- Exhibits42: Market opportunity by Application ($ billion)
- Exhibits43: Data Table on Market opportunity by Application ($ billion)
- Exhibits44: Chart on End-user - Market share 2023-2028 (%)
- Exhibits45: Data Table on End-user - Market share 2023-2028 (%)
- Exhibits46: Chart on Comparison by End-user
- Exhibits47: Data Table on Comparison by End-user
- Exhibits48: Chart on BFSI - Market size and forecast 2023-2028 ($ billion)
- Exhibits49: Data Table on BFSI - Market size and forecast 2023-2028 ($ billion)
- Exhibits50: Chart on BFSI - Year-over-year growth 2023-2028 (%)
- Exhibits51: Data Table on BFSI - Year-over-year growth 2023-2028 (%)
- Exhibits52: Chart on Retail and e-commerce - Market size and forecast 2023-2028 ($ billion)
- Exhibits53: Data Table on Retail and e-commerce - Market size and forecast 2023-2028 ($ billion)
- Exhibits54: Chart on Retail and e-commerce - Year-over-year growth 2023-2028 (%)
- Exhibits55: Data Table on Retail and e-commerce - Year-over-year growth 2023-2028 (%)
- Exhibits56: Chart on IT and telecom - Market size and forecast 2023-2028 ($ billion)
- Exhibits57: Data Table on IT and telecom - Market size and forecast 2023-2028 ($ billion)
- Exhibits58: Chart on IT and telecom - Year-over-year growth 2023-2028 (%)
- Exhibits59: Data Table on IT and telecom - Year-over-year growth 2023-2028 (%)
- Exhibits60: Chart on Healthcare and life sciences - Market size and forecast 2023-2028 ($ billion)
- Exhibits61: Data Table on Healthcare and life sciences - Market size and forecast 2023-2028 ($ billion)
- Exhibits62: Chart on Healthcare and life sciences - Year-over-year growth 2023-2028 (%)
- Exhibits63: Data Table on Healthcare and life sciences - Year-over-year growth 2023-2028 (%)
- Exhibits64: Chart on Government and others - Market size and forecast 2023-2028 ($ billion)
- Exhibits65: Data Table on Government and others - Market size and forecast 2023-2028 ($ billion)
- Exhibits66: Chart on Government and others - Year-over-year growth 2023-2028 (%)
- Exhibits67: Data Table on Government and others - Year-over-year growth 2023-2028 (%)
- Exhibits68: Market opportunity by End-user ($ billion)
- Exhibits69: Data Table on Market opportunity by End-user ($ billion)
- Exhibits70: Analysis of price sensitivity, lifecycle, customer purchase basket, adoption rates, and purchase criteria
- Exhibits71: Chart on Market share by geography 2023-2028 (%)
- Exhibits72: Data Table on Market share by geography 2023-2028 (%)
- Exhibits73: Chart on Geographic comparison
- Exhibits74: Data Table on Geographic comparison
- Exhibits75: Chart on North America - Market size and forecast 2023-2028 ($ billion)
- Exhibits76: Data Table on North America - Market size and forecast 2023-2028 ($ billion)
- Exhibits77: Chart on North America - Year-over-year growth 2023-2028 (%)
- Exhibits78: Data Table on North America - Year-over-year growth 2023-2028 (%)
- Exhibits79: Chart on Europe - Market size and forecast 2023-2028 ($ billion)
- Exhibits80: Data Table on Europe - Market size and forecast 2023-2028 ($ billion)
- Exhibits81: Chart on Europe - Year-over-year growth 2023-2028 (%)
- Exhibits82: Data Table on Europe - Year-over-year growth 2023-2028 (%)
- Exhibits83: Chart on APAC - Market size and forecast 2023-2028 ($ billion)
- Exhibits84: Data Table on APAC - Market size and forecast 2023-2028 ($ billion)
- Exhibits85: Chart on APAC - Year-over-year growth 2023-2028 (%)
- Exhibits86: Data Table on APAC - Year-over-year growth 2023-2028 (%)
- Exhibits87: Chart on South America - Market size and forecast 2023-2028 ($ billion)
- Exhibits88: Data Table on South America - Market size and forecast 2023-2028 ($ billion)
- Exhibits89: Chart on South America - Year-over-year growth 2023-2028 (%)
- Exhibits90: Data Table on South America - Year-over-year growth 2023-2028 (%)
- Exhibits91: Chart on Middle East and Africa - Market size and forecast 2023-2028 ($ billion)
- Exhibits92: Data Table on Middle East and Africa - Market size and forecast 2023-2028 ($ billion)
- Exhibits93: Chart on Middle East and Africa - Year-over-year growth 2023-2028 (%)
- Exhibits94: Data Table on Middle East and Africa - Year-over-year growth 2023-2028 (%)
- Exhibits95: Chart on US - Market size and forecast 2023-2028 ($ billion)
- Exhibits96: Data Table on US - Market size and forecast 2023-2028 ($ billion)
- Exhibits97: Chart on US - Year-over-year growth 2023-2028 (%)
- Exhibits98: Data Table on US - Year-over-year growth 2023-2028 (%)
- Exhibits99: Chart on China - Market size and forecast 2023-2028 ($ billion)
- Exhibits100: Data Table on China - Market size and forecast 2023-2028 ($ billion)
- Exhibits101: Chart on China - Year-over-year growth 2023-2028 (%)
- Exhibits102: Data Table on China - Year-over-year growth 2023-2028 (%)
- Exhibits103: Chart on UK - Market size and forecast 2023-2028 ($ billion)
- Exhibits104: Data Table on UK - Market size and forecast 2023-2028 ($ billion)
- Exhibits105: Chart on UK - Year-over-year growth 2023-2028 (%)
- Exhibits106: Data Table on UK - Year-over-year growth 2023-2028 (%)
- Exhibits107: Chart on Germany - Market size and forecast 2023-2028 ($ billion)
- Exhibits108: Data Table on Germany - Market size and forecast 2023-2028 ($ billion)
- Exhibits109: Chart on Germany - Year-over-year growth 2023-2028 (%)
- Exhibits110: Data Table on Germany - Year-over-year growth 2023-2028 (%)
- Exhibits111: Chart on Japan - Market size and forecast 2023-2028 ($ billion)
- Exhibits112: Data Table on Japan - Market size and forecast 2023-2028 ($ billion)
- Exhibits113: Chart on Japan - Year-over-year growth 2023-2028 (%)
- Exhibits114: Data Table on Japan - Year-over-year growth 2023-2028 (%)
- Exhibits115: Market opportunity by geography ($ billion)
- Exhibits116: Data Tables on Market opportunity by geography ($ billion)
- Exhibits117: Impact of drivers and challenges in 2023 and 2028
- Exhibits118: Overview on Criticality of inputs and Factors of differentiation
- Exhibits119: Overview on factors of disruption
- Exhibits120: Impact of key risks on business
- Exhibits121: Vendors covered
- Exhibits122: Matrix on vendor position and classification
- Exhibits123: BlackBerry Ltd. - Overview
- Exhibits124: BlackBerry Ltd. - Business segments
- Exhibits125: BlackBerry Ltd. - Key news
- Exhibits126: BlackBerry Ltd. - Key offerings
- Exhibits127: BlackBerry Ltd. - Segment focus
- Exhibits128: Cisco Systems Inc. - Overview
- Exhibits129: Cisco Systems Inc. - Business segments
- Exhibits130: Cisco Systems Inc. - Key news
- Exhibits131: Cisco Systems Inc. - Key offerings
- Exhibits132: Cisco Systems Inc. - Segment focus
- Exhibits133: Citrix Systems Inc. - Overview
- Exhibits134: Citrix Systems Inc. - Product / Service
- Exhibits135: Citrix Systems Inc. - Key offerings
- Exhibits136: GoTo - Overview
- Exhibits137: GoTo - Product / Service
- Exhibits138: GoTo - Key offerings
- Exhibits139: Infosys Ltd. - Overview
- Exhibits140: Infosys Ltd. - Business segments
- Exhibits141: Infosys Ltd. - Key news
- Exhibits142: Infosys Ltd. - Key offerings
- Exhibits143: Infosys Ltd. - Segment focus
- Exhibits144: International Business Machines Corp. - Overview
- Exhibits145: International Business Machines Corp. - Business segments
- Exhibits146: International Business Machines Corp. - Key news
- Exhibits147: International Business Machines Corp. - Key offerings
- Exhibits148: International Business Machines Corp. - Segment focus
- Exhibits149: Ivanti Software Inc. - Overview
- Exhibits150: Ivanti Software Inc. - Product / Service
- Exhibits151: Ivanti Software Inc. - Key offerings
- Exhibits152: Matrix42 GmbH - Overview
- Exhibits153: Matrix42 GmbH - Product / Service
- Exhibits154: Matrix42 GmbH - Key offerings
- Exhibits155: Microsoft Corp. - Overview
- Exhibits156: Microsoft Corp. - Business segments
- Exhibits157: Microsoft Corp. - Key news
- Exhibits158: Microsoft Corp. - Key offerings
- Exhibits159: Microsoft Corp. - Segment focus
- Exhibits160: Mitsogo Inc. - Overview
- Exhibits161: Mitsogo Inc. - Product / Service
- Exhibits162: Mitsogo Inc. - Key offerings
- Exhibits163: SAP SE - Overview
- Exhibits164: SAP SE - Business segments
- Exhibits165: SAP SE - Key news
- Exhibits166: SAP SE - Key offerings
- Exhibits167: SAP SE - Segment focus
- Exhibits168: Sophos Ltd. - Overview
- Exhibits169: Sophos Ltd. - Product / Service
- Exhibits170: Sophos Ltd. - Key offerings
- Exhibits171: SOTI Inc. - Overview
- Exhibits172: SOTI Inc. - Product / Service
- Exhibits173: SOTI Inc. - Key offerings
- Exhibits174: Ventraq Corp. - Overview
- Exhibits175: Ventraq Corp. - Product / Service
- Exhibits176: Ventraq Corp. - Key offerings
- Exhibits177: Zoho Corp. Pvt. Ltd. - Overview
- Exhibits178: Zoho Corp. Pvt. Ltd. - Product / Service
- Exhibits179: Zoho Corp. Pvt. Ltd. - Key offerings
- Exhibits180: Inclusions checklist
- Exhibits181: Exclusions checklist
- Exhibits182: Currency conversion rates for US$
- Exhibits183: Research methodology
- Exhibits184: Validation techniques employed for market sizing
- Exhibits185: Information sources
- Exhibits186: List of abbreviations
The enterprise mobility services market is forecasted to grow by USD 14.50 bn during 2023-2028, accelerating at a CAGR of 23.88% during the forecast period. The report on the enterprise mobility services market provides a holistic analysis, market size and forecast, trends, growth drivers, and challenges, as well as vendor analysis covering around 25 vendors.
The report offers an up-to-date analysis regarding the current market scenario, the latest trends and drivers, and the overall market environment. The market is driven by the increasing use of mobile devices in enterprises, the rising need for real-time data access, and the rising adoption of remote working models.
Technavio's enterprise mobility services market is segmented as below:
| Market Scope | |
|---|---|
| Base Year | 2024 |
| End Year | 2028 |
| Series Year | 2024-2028 |
| Growth Momentum | Accelerate |
| YOY 2024 | 22.9% |
| CAGR | 23.88% |
| Incremental Value | $14.50bn |
By Application
- Large enterprises
- Small and medium sized enterprises
By End-user
- BFSI
- Retail and e-commerce
- IT and telecom
- Healthcare and life sciences
- Government and others
By Geography
- North America
- Europe
- APAC
- South America
- Middle East and Africa
This study identifies the rising demand for workforce productivity and efficiency among enterprises as one of the prime reasons driving the enterprise mobility services market growth during the next few years. Also, the growing use of AI and ML technologies in enterprise mobility services and the growing use of cloud-based enterprise mobility services will lead to sizable demand in the market.
The report on the enterprise mobility services market covers the following areas:
- Enterprise mobility services market sizing
- Enterprise mobility services market forecast
- Enterprise mobility services market industry analysis
The robust vendor analysis is designed to help clients improve their market position, and in line with this, this report provides a detailed analysis of several leading enterprise mobility services market vendors that include 42Gears Mobility Systems Pvt. Ltd., AppTec GmbH, Cisco Systems Inc., Citrix Systems Inc., Codeproof Technologies Inc., GoTo, Infosys Ltd., International Business Machines Corp., Ivanti Software Inc., JAMF HOLDING CORP., Matrix42 GmbH, Microsoft Corp., Mitsogo Inc., Quest Software Inc., SAP SE, Social Mobile, Sophos Ltd., SOTI Inc., Ventraq Corp., Zoho Corp. Pvt. Ltd., and BlackBerry Ltd. Also, the enterprise mobility services market analysis report includes information on upcoming trends and challenges that will influence market growth. This is to help companies strategize and leverage all forthcoming growth opportunities.
The study was conducted using an objective combination of primary and secondary information including inputs from key participants in the industry. The report contains a comprehensive market and vendor landscape in addition to an analysis of the key vendors.
The publisher presents a detailed picture of the market by way of study, synthesis, and summation of data from multiple sources through an analysis of key parameters such as profit, pricing, competition, and promotions. It presents various market facets by identifying the key industry influencers. The data presented is comprehensive, reliable, and a result of extensive research - both primary and secondary. The market research reports provide a complete competitive landscape and an in-depth vendor selection methodology and analysis using qualitative and quantitative research to forecast accurate market growth.
Table of Contents
1 Executive Summary
- 1.1 Market overview
2 Market Landscape
- 2.1 Market ecosystem
3 Market Sizing
- 3.1 Market definition
- 3.2 Market segment analysis
- 3.3 Market size 2023
- 3.4 Market outlook: Forecast for 2023-2028
4 Historic Market Size
- 4.1 Global enterprise mobility services market 2018 - 2022
- 4.2 Application Segment Analysis 2018 - 2022
- 4.3 End-user Segment Analysis 2018 - 2022
- 4.4 Geography Segment Analysis 2018 - 2022
- 4.5 Country Segment Analysis 2018 - 2022
5 Five Forces Analysis
- 5.1 Five forces summary
- 5.2 Bargaining power of buyers
- 5.3 Bargaining power of suppliers
- 5.4 Threat of new entrants
- 5.5 Threat of substitutes
- 5.6 Threat of rivalry
- 5.7 Market condition
6 Market Segmentation by Application
- 6.1 Market segments
- 6.2 Comparison by Application
- 6.3 Large enterprises - Market size and forecast 2023-2028
- 6.4 Small and medium sized enterprises - Market size and forecast 2023-2028
- 6.5 Market opportunity by Application
7 Market Segmentation by End-user
- 7.1 Market segments
- 7.2 Comparison by End-user
- 7.3 BFSI - Market size and forecast 2023-2028
- 7.4 Retail and e-commerce - Market size and forecast 2023-2028
- 7.5 IT and telecom - Market size and forecast 2023-2028
- 7.6 Healthcare and life sciences - Market size and forecast 2023-2028
- 7.7 Government and others - Market size and forecast 2023-2028
- 7.8 Market opportunity by End-user
8 Customer Landscape
- 8.1 Customer landscape overview
9 Geographic Landscape
- 9.1 Geographic segmentation
- 9.2 Geographic comparison
- 9.3 North America - Market size and forecast 2023-2028
- 9.4 Europe - Market size and forecast 2023-2028
- 9.5 APAC - Market size and forecast 2023-2028
- 9.6 South America - Market size and forecast 2023-2028
- 9.7 Middle East and Africa - Market size and forecast 2023-2028
- 9.8 US - Market size and forecast 2023-2028
- 9.9 China - Market size and forecast 2023-2028
- 9.10 UK - Market size and forecast 2023-2028
- 9.11 Germany - Market size and forecast 2023-2028
- 9.12 Japan - Market size and forecast 2023-2028
- 9.13 Market opportunity by geography
10 Drivers, Challenges, and Trends
- 10.1 Market drivers
- 10.2 Market challenges
- 10.3 Impact of drivers and challenges
- 10.4 Market trends
11 Vendor Landscape
- 11.1 Overview
- 11.2 Vendor landscape
- 11.3 Landscape disruption
- 11.4 Industry risks
12 Vendor Analysis
- 12.1 Vendors covered
- 12.2 Market positioning of vendors
- 12.3 BlackBerry Ltd.
- 12.4 Cisco Systems Inc.
- 12.5 Citrix Systems Inc.
- 12.6 GoTo
- 12.7 Infosys Ltd.
- 12.8 International Business Machines Corp.
- 12.9 Ivanti Software Inc.
- 12.10 Matrix42 GmbH
- 12.11 Microsoft Corp.
- 12.12 Mitsogo Inc.
- 12.13 SAP SE
- 12.14 Sophos Ltd.
- 12.15 SOTI Inc.
- 12.16 Ventraq Corp.
- 12.17 Zoho Corp. Pvt. Ltd.
13 Appendix
- 13.1 Scope of the report
- 13.2 Inclusions and exclusions checklist
- 13.3 Currency conversion rates for US$
- 13.4 Research methodology
- 13.5 List of abbreviations

