|
|
市場調査レポート
商品コード
1544333
軍事衛星のペイロードとサブシステムの世界市場、2024~2028年Global Military Satellite Payloads and Subsystems Market 2024-2028 |
||||||
|
|||||||
カスタマイズ可能
|
|||||||


| 軍事衛星のペイロードとサブシステムの世界市場、2024~2028年 |
|
出版日: 2024年07月19日
発行: TechNavio
ページ情報: 英文 184 Pages
納期: 即納可能
|

全表示
- 概要
- 図表
- 目次
軍事衛星のペイロードとサブシステム市場は2023~2028年に31億6,870万米ドル、予測期間中のCAGRは8.09%で成長すると予測されます。
当レポートでは、軍事衛星のペイロードとサブシステム市場の全体的な分析、市場規模・予測、動向、成長促進要因、課題、約25のベンダーを網羅したベンダー分析などを掲載しています。
現在の市場シナリオ、最新動向と促進要因、市場環境全体に関する最新分析を提供しています。膨張式衛星通信アンテナの出現、海上における安全保障上の脅威の増大、防衛通信の安全保障を強化するための高度な軍事通信システムの調達増加などが市場を牽引しています。
| 市場範囲 | |
|---|---|
| 基準年 | 2024年 |
| 終了年 | 2028年 |
| 予測期間 | 2024~2028年 |
| 成長モメンタム | 加速 |
| 前年比[2024年] | 7.32% |
| CAGR | 8.09% |
| 増分額 | 31億6,870万米ドル |
本調査では、今後数年間の軍事衛星のペイロードとサブシステム市場成長を促進する主要理由の1つとして、大型衛星の保守・支援における超小型衛星の利用を挙げています。また、軽量パワーアンプの開拓と地球観測用衛星通信でのaiの使用は、市場の大きな需要につながります。
目次
第1章 エグゼクティブサマリー
- 市場概要
第2章 市場情勢
- 市場エコシステム
- 市場の特徴
- バリューチェーン分析
第3章 市場規模の評価
- 市場の定義
- 市場セグメント分析
- 市場規模 2023年
- 市場の展望 2023~2028年
第4章 市場規模実績
- 軍事衛星のペイロードとサブシステムの世界市場 2018~2022年
- タイプ別セグメント分析 2018~2022年
- 用途別セグメント分析 2018~2022年
- 地域別セグメント分析 2018~2022年
- 国別セグメント分析 2018~2022年
第5章 ファイブフォース分析
- ファイブフォースの要約
- 買い手の交渉力
- 供給企業の交渉力
- 新規参入業者の脅威
- 代替品の脅威
- 競争の脅威
- 市況
第6章 市場セグメンテーション:タイプ別
- 市場セグメンテーション
- 比較:タイプ別
- 光学センサーとその他のセンサーペイロード:市場規模と予測 2023~2028年
- 航空電子機器とサブシステム:市場規模と予測 2023~2028年
- データリンクと通信システム:市場規模と予測 2023~2028年
- 市場機会:タイプ別
第7章 市場セグメンテーション:用途別
- 市場セグメンテーション
- 比較:用途別
- 通信:市場規模と予測 2023~2028年
- ナビゲーション:市場規模と予測 2023~2028年
- 偵察:市場規模と予測 2023~2028年
- 市場機会:用途別
第8章 顧客情勢
- 顧客情勢概要
第9章 地域別情勢
- 地域別セグメンテーション
- 比較:地域別
- 北米:市場規模と予測 2023~2028年
- 欧州:市場規模と予測 2023~2028年
- アジア太平洋:市場規模と予測 2023~2028年
- 中東・アフリカ:市場規模と予測 2023~2028年
- 南米:市場規模と予測 2023~2028年
- 米国:市場規模と予測 2023~2028年
- 中国:市場規模と予測 2023~2028年
- ロシア:市場規模と予測 2023~2028年
- ドイツ:市場規模と予測 2023~2028年
- 英国:市場規模と予測 2023~2028年
- 市場機会:地域情勢別
第10章 促進要因・課題・機会・抑制要因
- 市場促進要因
- 市場課題
- 促進要因と課題の影響
- 市場の機会・抑制要因
第11章 競合情勢
- 概要
- 競合情勢
- 混乱の状況
- 業界のリスク
第12章 競合分析
- 企業プロファイル
- 企業の市場ポジショニング
- BAE Systems Plc
- Ball Corp.
- Eutelsat S.A.
- General Dynamics Corp.
- Honeywell International Inc.
- Intelsat US LLC
- Israel Aerospace Industries Ltd.
- L3Harris Technologies Inc.
- Lockheed Martin Corp.
- MDA Corp.
- Northrop Grumman Corp.
- RTX Corp.
- Thales Group
- The Boeing Co.
- Viasat Inc.
第13章 付録
Exhibits:
- Exhibits1: Executive Summary - Chart on Market Overview
- Exhibits2: Executive Summary - Data Table on Market Overview
- Exhibits3: Executive Summary - Chart on Global Market Characteristics
- Exhibits4: Executive Summary - Chart on Market By Geographical Landscape
- Exhibits5: Executive Summary - Chart on Market Segmentation by Type
- Exhibits6: Executive Summary - Chart on Market Segmentation by Application
- Exhibits7: Executive Summary - Chart on Incremental Growth
- Exhibits8: Executive Summary - Data Table on Incremental Growth
- Exhibits9: Executive Summary - Chart on Company Market Positioning
- Exhibits10: Parent Market
- Exhibits11: Data Table on - Parent Market
- Exhibits12: Market characteristics analysis
- Exhibits13: Value Chain Analysis
- Exhibits14: Offerings of companies included in the market definition
- Exhibits15: Market segments
- Exhibits16: Chart on Global - Market size and forecast 2023-2028 ($ million)
- Exhibits17: Data Table on Global - Market size and forecast 2023-2028 ($ million)
- Exhibits18: Chart on Global Market: Year-over-year growth 2023-2028 (%)
- Exhibits19: Data Table on Global Market: Year-over-year growth 2023-2028 (%)
- Exhibits20: Historic Market Size - Data Table on Global Military Satellite Payloads And Subsystems Market 2018 - 2022 ($ million)
- Exhibits21: Historic Market Size - Type Segment 2018 - 2022 ($ million)
- Exhibits22: Historic Market Size - Application Segment 2018 - 2022 ($ million)
- Exhibits23: Historic Market Size - Geography Segment 2018 - 2022 ($ million)
- Exhibits24: Historic Market Size - Country Segment 2018 - 2022 ($ million)
- Exhibits25: Five forces analysis - Comparison between 2023 and 2028
- Exhibits26: Bargaining power of buyers - Impact of key factors 2023 and 2028
- Exhibits27: Bargaining power of suppliers - Impact of key factors in 2023 and 2028
- Exhibits28: Threat of new entrants - Impact of key factors in 2023 and 2028
- Exhibits29: Threat of substitutes - Impact of key factors in 2023 and 2028
- Exhibits30: Threat of rivalry - Impact of key factors in 2023 and 2028
- Exhibits31: Chart on Market condition - Five forces 2023 and 2028
- Exhibits32: Chart on Type - Market share 2023-2028 (%)
- Exhibits33: Data Table on Type - Market share 2023-2028 (%)
- Exhibits34: Chart on Comparison by Type
- Exhibits35: Data Table on Comparison by Type
- Exhibits36: Chart on Optical sensors and other sensors payloads - Market size and forecast 2023-2028 ($ million)
- Exhibits37: Data Table on Optical sensors and other sensors payloads - Market size and forecast 2023-2028 ($ million)
- Exhibits38: Chart on Optical sensors and other sensors payloads - Year-over-year growth 2023-2028 (%)
- Exhibits39: Data Table on Optical sensors and other sensors payloads - Year-over-year growth 2023-2028 (%)
- Exhibits40: Chart on Avionics and subsystems - Market size and forecast 2023-2028 ($ million)
- Exhibits41: Data Table on Avionics and subsystems - Market size and forecast 2023-2028 ($ million)
- Exhibits42: Chart on Avionics and subsystems - Year-over-year growth 2023-2028 (%)
- Exhibits43: Data Table on Avionics and subsystems - Year-over-year growth 2023-2028 (%)
- Exhibits44: Chart on Data link and communication systems - Market size and forecast 2023-2028 ($ million)
- Exhibits45: Data Table on Data link and communication systems - Market size and forecast 2023-2028 ($ million)
- Exhibits46: Chart on Data link and communication systems - Year-over-year growth 2023-2028 (%)
- Exhibits47: Data Table on Data link and communication systems - Year-over-year growth 2023-2028 (%)
- Exhibits48: Market opportunity by Type ($ million)
- Exhibits49: Data Table on Market opportunity by Type ($ million)
- Exhibits50: Chart on Application - Market share 2023-2028 (%)
- Exhibits51: Data Table on Application - Market share 2023-2028 (%)
- Exhibits52: Chart on Comparison by Application
- Exhibits53: Data Table on Comparison by Application
- Exhibits54: Chart on Communication - Market size and forecast 2023-2028 ($ million)
- Exhibits55: Data Table on Communication - Market size and forecast 2023-2028 ($ million)
- Exhibits56: Chart on Communication - Year-over-year growth 2023-2028 (%)
- Exhibits57: Data Table on Communication - Year-over-year growth 2023-2028 (%)
- Exhibits58: Chart on Navigation - Market size and forecast 2023-2028 ($ million)
- Exhibits59: Data Table on Navigation - Market size and forecast 2023-2028 ($ million)
- Exhibits60: Chart on Navigation - Year-over-year growth 2023-2028 (%)
- Exhibits61: Data Table on Navigation - Year-over-year growth 2023-2028 (%)
- Exhibits62: Chart on Reconnaissance - Market size and forecast 2023-2028 ($ million)
- Exhibits63: Data Table on Reconnaissance - Market size and forecast 2023-2028 ($ million)
- Exhibits64: Chart on Reconnaissance - Year-over-year growth 2023-2028 (%)
- Exhibits65: Data Table on Reconnaissance - Year-over-year growth 2023-2028 (%)
- Exhibits66: Market opportunity by Application ($ million)
- Exhibits67: Data Table on Market opportunity by Application ($ million)
- Exhibits68: Analysis of price sensitivity, lifecycle, customer purchase basket, adoption rates, and purchase criteria
- Exhibits69: Chart on Market share By Geographical Landscape 2023-2028 (%)
- Exhibits70: Data Table on Market share By Geographical Landscape 2023-2028 (%)
- Exhibits71: Chart on Geographic comparison
- Exhibits72: Data Table on Geographic comparison
- Exhibits73: Chart on North America - Market size and forecast 2023-2028 ($ million)
- Exhibits74: Data Table on North America - Market size and forecast 2023-2028 ($ million)
- Exhibits75: Chart on North America - Year-over-year growth 2023-2028 (%)
- Exhibits76: Data Table on North America - Year-over-year growth 2023-2028 (%)
- Exhibits77: Chart on Europe - Market size and forecast 2023-2028 ($ million)
- Exhibits78: Data Table on Europe - Market size and forecast 2023-2028 ($ million)
- Exhibits79: Chart on Europe - Year-over-year growth 2023-2028 (%)
- Exhibits80: Data Table on Europe - Year-over-year growth 2023-2028 (%)
- Exhibits81: Chart on APAC - Market size and forecast 2023-2028 ($ million)
- Exhibits82: Data Table on APAC - Market size and forecast 2023-2028 ($ million)
- Exhibits83: Chart on APAC - Year-over-year growth 2023-2028 (%)
- Exhibits84: Data Table on APAC - Year-over-year growth 2023-2028 (%)
- Exhibits85: Chart on Middle East and Africa - Market size and forecast 2023-2028 ($ million)
- Exhibits86: Data Table on Middle East and Africa - Market size and forecast 2023-2028 ($ million)
- Exhibits87: Chart on Middle East and Africa - Year-over-year growth 2023-2028 (%)
- Exhibits88: Data Table on Middle East and Africa - Year-over-year growth 2023-2028 (%)
- Exhibits89: Chart on South America - Market size and forecast 2023-2028 ($ million)
- Exhibits90: Data Table on South America - Market size and forecast 2023-2028 ($ million)
- Exhibits91: Chart on South America - Year-over-year growth 2023-2028 (%)
- Exhibits92: Data Table on South America - Year-over-year growth 2023-2028 (%)
- Exhibits93: Chart on US - Market size and forecast 2023-2028 ($ million)
- Exhibits94: Data Table on US - Market size and forecast 2023-2028 ($ million)
- Exhibits95: Chart on US - Year-over-year growth 2023-2028 (%)
- Exhibits96: Data Table on US - Year-over-year growth 2023-2028 (%)
- Exhibits97: Chart on China - Market size and forecast 2023-2028 ($ million)
- Exhibits98: Data Table on China - Market size and forecast 2023-2028 ($ million)
- Exhibits99: Chart on China - Year-over-year growth 2023-2028 (%)
- Exhibits100: Data Table on China - Year-over-year growth 2023-2028 (%)
- Exhibits101: Chart on Russia - Market size and forecast 2023-2028 ($ million)
- Exhibits102: Data Table on Russia - Market size and forecast 2023-2028 ($ million)
- Exhibits103: Chart on Russia - Year-over-year growth 2023-2028 (%)
- Exhibits104: Data Table on Russia - Year-over-year growth 2023-2028 (%)
- Exhibits105: Chart on Germany - Market size and forecast 2023-2028 ($ million)
- Exhibits106: Data Table on Germany - Market size and forecast 2023-2028 ($ million)
- Exhibits107: Chart on Germany - Year-over-year growth 2023-2028 (%)
- Exhibits108: Data Table on Germany - Year-over-year growth 2023-2028 (%)
- Exhibits109: Chart on UK - Market size and forecast 2023-2028 ($ million)
- Exhibits110: Data Table on UK - Market size and forecast 2023-2028 ($ million)
- Exhibits111: Chart on UK - Year-over-year growth 2023-2028 (%)
- Exhibits112: Data Table on UK - Year-over-year growth 2023-2028 (%)
- Exhibits113: Market opportunity By Geographical Landscape ($ million)
- Exhibits114: Data Tables on Market opportunity By Geographical Landscape ($ million)
- Exhibits115: Impact of drivers and challenges in 2023 and 2028
- Exhibits116: Overview on criticality of inputs and factors of differentiation
- Exhibits117: Overview on factors of disruption
- Exhibits118: Impact of key risks on business
- Exhibits119: Companies covered
- Exhibits120: Matrix on companies position and classification
- Exhibits121: BAE Systems Plc - Overview
- Exhibits122: BAE Systems Plc - Business segments
- Exhibits123: BAE Systems Plc - Key news
- Exhibits124: BAE Systems Plc - Key offerings
- Exhibits125: BAE Systems Plc - Segment focus
- Exhibits126: Ball Corp. - Overview
- Exhibits127: Ball Corp. - Business segments
- Exhibits128: Ball Corp. - Key news
- Exhibits129: Ball Corp. - Key offerings
- Exhibits130: Ball Corp. - Segment focus
- Exhibits131: Eutelsat S.A. - Overview
- Exhibits132: Eutelsat S.A. - Product / Service
- Exhibits133: Eutelsat S.A. - Key news
- Exhibits134: Eutelsat S.A. - Key offerings
- Exhibits135: General Dynamics Corp. - Overview
- Exhibits136: General Dynamics Corp. - Business segments
- Exhibits137: General Dynamics Corp. - Key news
- Exhibits138: General Dynamics Corp. - Key offerings
- Exhibits139: General Dynamics Corp. - Segment focus
- Exhibits140: Honeywell International Inc. - Overview
- Exhibits141: Honeywell International Inc. - Business segments
- Exhibits142: Honeywell International Inc. - Key news
- Exhibits143: Honeywell International Inc. - Key offerings
- Exhibits144: Honeywell International Inc. - Segment focus
- Exhibits145: Intelsat US LLC - Overview
- Exhibits146: Intelsat US LLC - Product / Service
- Exhibits147: Intelsat US LLC - Key offerings
- Exhibits148: Israel Aerospace Industries Ltd. - Overview
- Exhibits149: Israel Aerospace Industries Ltd. - Product / Service
- Exhibits150: Israel Aerospace Industries Ltd. - Key news
- Exhibits151: Israel Aerospace Industries Ltd. - Key offerings
- Exhibits152: L3Harris Technologies Inc. - Overview
- Exhibits153: L3Harris Technologies Inc. - Business segments
- Exhibits154: L3Harris Technologies Inc. - Key news
- Exhibits155: L3Harris Technologies Inc. - Key offerings
- Exhibits156: L3Harris Technologies Inc. - Segment focus
- Exhibits157: Lockheed Martin Corp. - Overview
- Exhibits158: Lockheed Martin Corp. - Business segments
- Exhibits159: Lockheed Martin Corp. - Key news
- Exhibits160: Lockheed Martin Corp. - Key offerings
- Exhibits161: Lockheed Martin Corp. - Segment focus
- Exhibits162: MDA Corp. - Overview
- Exhibits163: MDA Corp. - Product / Service
- Exhibits164: MDA Corp. - Key offerings
- Exhibits165: Northrop Grumman Corp. - Overview
- Exhibits166: Northrop Grumman Corp. - Business segments
- Exhibits167: Northrop Grumman Corp. - Key news
- Exhibits168: Northrop Grumman Corp. - Key offerings
- Exhibits169: Northrop Grumman Corp. - Segment focus
- Exhibits170: RTX Corp. - Overview
- Exhibits171: RTX Corp. - Business segments
- Exhibits172: RTX Corp. - Key news
- Exhibits173: RTX Corp. - Key offerings
- Exhibits174: RTX Corp. - Segment focus
- Exhibits175: Thales Group - Overview
- Exhibits176: Thales Group - Business segments
- Exhibits177: Thales Group - Key news
- Exhibits178: Thales Group - Key offerings
- Exhibits179: Thales Group - Segment focus
- Exhibits180: The Boeing Co. - Overview
- Exhibits181: The Boeing Co. - Business segments
- Exhibits182: The Boeing Co. - Key news
- Exhibits183: The Boeing Co. - Key offerings
- Exhibits184: The Boeing Co. - Segment focus
- Exhibits185: Viasat Inc. - Overview
- Exhibits186: Viasat Inc. - Business segments
- Exhibits187: Viasat Inc. - Key news
- Exhibits188: Viasat Inc. - Key offerings
- Exhibits189: Viasat Inc. - Segment focus
- Exhibits190: Inclusions checklist
- Exhibits191: Exclusions checklist
- Exhibits192: Currency conversion rates for US$
- Exhibits193: Research methodology
- Exhibits194: Information sources
- Exhibits195: Data validation
- Exhibits196: Validation techniques employed for market sizing
- Exhibits197: Data synthesis
- Exhibits198: 360 degree market analysis
- Exhibits199: List of abbreviations
The military satellite payloads and subsystems market is forecasted to grow by USD 3168.7 mn during 2023-2028, accelerating at a CAGR of 8.09% during the forecast period. The report on the military satellite payloads and subsystems market provides a holistic analysis, market size and forecast, trends, growth drivers, and challenges, as well as vendor analysis covering around 25 vendors.
The report offers an up-to-date analysis regarding the current market scenario, the latest trends and drivers, and the overall market environment. The market is driven by emergence of inflatable satcom antennas, increased seaborne security threats, and increasing procurement of advanced military communication systems to strengthen defense communication security.
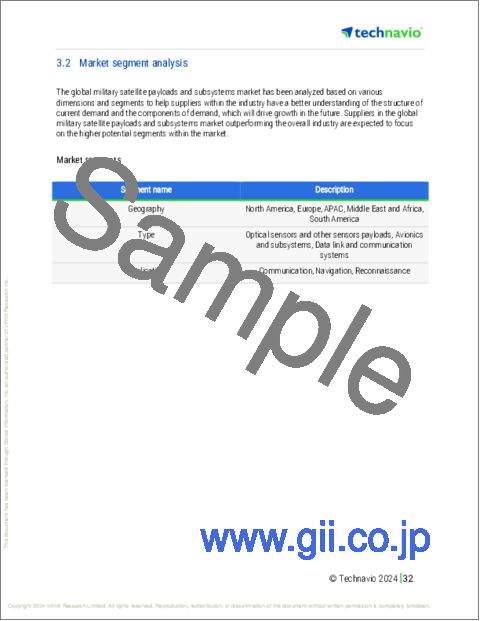
Technavio's military satellite payloads and subsystems market is segmented as below:
| Market Scope | |
|---|---|
| Base Year | 2024 |
| End Year | 2028 |
| Series Year | 2024-2028 |
| Growth Momentum | Accelerate |
| YOY 2024 | 7.32% |
| CAGR | 8.09% |
| Incremental Value | $3168.7 mn |
By Type
- Optical sensors and other sensors payloads
- Avionics and subsystems
- Data link and communication systems
By Application
- Communication
- Navigation
- Reconnaissance
By Geographical Landscape
- North America
- Europe
- APAC
- Middle East and Africa
- South America
This study identifies the use of microsatellites in maintenance and assistance of bigger satellites as one of the prime reasons driving the military satellite payloads and subsystems market growth during the next few years. Also, development of lightweight power amplifiers and use of ai in satellite communication for earth-based observation will lead to sizable demand in the market.
The report on the military satellite payloads and subsystems market covers the following areas:
- Military satellite payloads and subsystems market sizing
- Military satellite payloads and subsystems market forecast
- Military satellite payloads and subsystems market industry analysis
The robust vendor analysis is designed to help clients improve their market position, and in line with this, this report provides a detailed analysis of several leading military satellite payloads and subsystems market vendors that include Airbus SE, BAE Systems Plc, Ball Corp., Eutelsat S.A., General Dynamics Corp., GomSpace Group AB, Honeywell International Inc., Intelsat US LLC, Israel Aerospace Industries Ltd., L3Harris Technologies Inc., Lockheed Martin Corp., MDA Corp., Mitsubishi Electric Corp., Northrop Grumman Corp., RTX Corp., Singapore Technologies Engineering Ltd., Space Exploration Technologies Corp., Thales Group, The Boeing Co., and Viasat Inc.. Also, the military satellite payloads and subsystems market analysis report includes information on upcoming trends and challenges that will influence market growth. This is to help companies strategize and leverage all forthcoming growth opportunities.
The study was conducted using an objective combination of primary and secondary information including inputs from key participants in the industry. The report contains a comprehensive market and vendor landscape in addition to an analysis of the key vendors.
The publisher presents a detailed picture of the market by the way of study, synthesis, and summation of data from multiple sources by an analysis of key parameters such as profit, pricing, competition, and promotions. It presents various market facets by identifying the key industry influencers. The data presented is comprehensive, reliable, and a result of extensive research - both primary and secondary. The market research reports provide a complete competitive landscape and an in-depth vendor selection methodology and analysis using qualitative and quantitative research to forecast the accurate market growth.
Table of Contents
1 Executive Summary
- 1.1 Market overview
- Executive Summary - Chart on Market Overview
- Executive Summary - Data Table on Market Overview
- Executive Summary - Chart on Global Market Characteristics
- Executive Summary - Chart on Market By Geographical Landscape
- Executive Summary - Chart on Market Segmentation by Type
- Executive Summary - Chart on Market Segmentation by Application
- Executive Summary - Chart on Incremental Growth
- Executive Summary - Data Table on Incremental Growth
- Executive Summary - Chart on Company Market Positioning
2 Market Landscape
- 2.1 Market ecosystem
- Parent Market
- Data Table on - Parent Market
- 2.2 Market characteristics
- Market characteristics analysis
- 2.3 Value chain analysis
- Value Chain Analysis
3 Market Sizing
- 3.1 Market definition
- Offerings of companies included in the market definition
- 3.2 Market segment analysis
- Market segments
- 3.3 Market size 2023
- 3.4 Market outlook: Forecast for 2023-2028
- Chart on Global - Market size and forecast 2023-2028 ($ million)
- Data Table on Global - Market size and forecast 2023-2028 ($ million)
- Chart on Global Market: Year-over-year growth 2023-2028 (%)
- Data Table on Global Market: Year-over-year growth 2023-2028 (%)
4 Historic Market Size
- 4.1 Global Military Satellite Payloads And Subsystems Market 2018 - 2022
- Historic Market Size - Data Table on Global Military Satellite Payloads And Subsystems Market 2018 - 2022 ($ million)
- 4.2 Type segment analysis 2018 - 2022
- Historic Market Size - Type Segment 2018 - 2022 ($ million)
- 4.3 Application segment analysis 2018 - 2022
- Historic Market Size - Application Segment 2018 - 2022 ($ million)
- 4.4 Geography segment analysis 2018 - 2022
- Historic Market Size - Geography Segment 2018 - 2022 ($ million)
- 4.5 Country segment analysis 2018 - 2022
- Historic Market Size - Country Segment 2018 - 2022 ($ million)
5 Five Forces Analysis
- 5.1 Five forces summary
- Five forces analysis - Comparison between 2023 and 2028
- 5.2 Bargaining power of buyers
- Bargaining power of buyers - Impact of key factors 2023 and 2028
- 5.3 Bargaining power of suppliers
- Bargaining power of suppliers - Impact of key factors in 2023 and 2028
- 5.4 Threat of new entrants
- Threat of new entrants - Impact of key factors in 2023 and 2028
- 5.5 Threat of substitutes
- Threat of substitutes - Impact of key factors in 2023 and 2028
- 5.6 Threat of rivalry
- Threat of rivalry - Impact of key factors in 2023 and 2028
- 5.7 Market condition
- Chart on Market condition - Five forces 2023 and 2028
6 Market Segmentation by Type
- 6.1 Market segments
- Chart on Type - Market share 2023-2028 (%)
- Data Table on Type - Market share 2023-2028 (%)
- 6.2 Comparison by Type
- Chart on Comparison by Type
- Data Table on Comparison by Type
- 6.3 Optical sensors and other sensors payloads - Market size and forecast 2023-2028
- Chart on Optical sensors and other sensors payloads - Market size and forecast 2023-2028 ($ million)
- Data Table on Optical sensors and other sensors payloads - Market size and forecast 2023-2028 ($ million)
- Chart on Optical sensors and other sensors payloads - Year-over-year growth 2023-2028 (%)
- Data Table on Optical sensors and other sensors payloads - Year-over-year growth 2023-2028 (%)
- 6.4 Avionics and subsystems - Market size and forecast 2023-2028
- Chart on Avionics and subsystems - Market size and forecast 2023-2028 ($ million)
- Data Table on Avionics and subsystems - Market size and forecast 2023-2028 ($ million)
- Chart on Avionics and subsystems - Year-over-year growth 2023-2028 (%)
- Data Table on Avionics and subsystems - Year-over-year growth 2023-2028 (%)
- 6.5 Data link and communication systems - Market size and forecast 2023-2028
- Chart on Data link and communication systems - Market size and forecast 2023-2028 ($ million)
- Data Table on Data link and communication systems - Market size and forecast 2023-2028 ($ million)
- Chart on Data link and communication systems - Year-over-year growth 2023-2028 (%)
- Data Table on Data link and communication systems - Year-over-year growth 2023-2028 (%)
- 6.6 Market opportunity by Type
- Market opportunity by Type ($ million)
- Data Table on Market opportunity by Type ($ million)
7 Market Segmentation by Application
- 7.1 Market segments
- Chart on Application - Market share 2023-2028 (%)
- Data Table on Application - Market share 2023-2028 (%)
- 7.2 Comparison by Application
- Chart on Comparison by Application
- Data Table on Comparison by Application
- 7.3 Communication - Market size and forecast 2023-2028
- Chart on Communication - Market size and forecast 2023-2028 ($ million)
- Data Table on Communication - Market size and forecast 2023-2028 ($ million)
- Chart on Communication - Year-over-year growth 2023-2028 (%)
- Data Table on Communication - Year-over-year growth 2023-2028 (%)
- 7.4 Navigation - Market size and forecast 2023-2028
- Chart on Navigation - Market size and forecast 2023-2028 ($ million)
- Data Table on Navigation - Market size and forecast 2023-2028 ($ million)
- Chart on Navigation - Year-over-year growth 2023-2028 (%)
- Data Table on Navigation - Year-over-year growth 2023-2028 (%)
- 7.5 Reconnaissance - Market size and forecast 2023-2028
- Chart on Reconnaissance - Market size and forecast 2023-2028 ($ million)
- Data Table on Reconnaissance - Market size and forecast 2023-2028 ($ million)
- Chart on Reconnaissance - Year-over-year growth 2023-2028 (%)
- Data Table on Reconnaissance - Year-over-year growth 2023-2028 (%)
- 7.6 Market opportunity by Application
- Market opportunity by Application ($ million)
- Data Table on Market opportunity by Application ($ million)
8 Customer Landscape
- 8.1 Customer landscape overview
- Analysis of price sensitivity, lifecycle, customer purchase basket, adoption rates, and purchase criteria
9 Geographic Landscape
- 9.1 Geographic segmentation
- Chart on Market share By Geographical Landscape 2023-2028 (%)
- Data Table on Market share By Geographical Landscape 2023-2028 (%)
- 9.2 Geographic comparison
- Chart on Geographic comparison
- Data Table on Geographic comparison
- 9.3 North America - Market size and forecast 2023-2028
- Chart on North America - Market size and forecast 2023-2028 ($ million)
- Data Table on North America - Market size and forecast 2023-2028 ($ million)
- Chart on North America - Year-over-year growth 2023-2028 (%)
- Data Table on North America - Year-over-year growth 2023-2028 (%)
- 9.4 Europe - Market size and forecast 2023-2028
- Chart on Europe - Market size and forecast 2023-2028 ($ million)
- Data Table on Europe - Market size and forecast 2023-2028 ($ million)
- Chart on Europe - Year-over-year growth 2023-2028 (%)
- Data Table on Europe - Year-over-year growth 2023-2028 (%)
- 9.5 APAC - Market size and forecast 2023-2028
- Chart on APAC - Market size and forecast 2023-2028 ($ million)
- Data Table on APAC - Market size and forecast 2023-2028 ($ million)
- Chart on APAC - Year-over-year growth 2023-2028 (%)
- Data Table on APAC - Year-over-year growth 2023-2028 (%)
- 9.6 Middle East and Africa - Market size and forecast 2023-2028
- Chart on Middle East and Africa - Market size and forecast 2023-2028 ($ million)
- Data Table on Middle East and Africa - Market size and forecast 2023-2028 ($ million)
- Chart on Middle East and Africa - Year-over-year growth 2023-2028 (%)
- Data Table on Middle East and Africa - Year-over-year growth 2023-2028 (%)
- 9.7 South America - Market size and forecast 2023-2028
- Chart on South America - Market size and forecast 2023-2028 ($ million)
- Data Table on South America - Market size and forecast 2023-2028 ($ million)
- Chart on South America - Year-over-year growth 2023-2028 (%)
- Data Table on South America - Year-over-year growth 2023-2028 (%)
- 9.8 US - Market size and forecast 2023-2028
- Chart on US - Market size and forecast 2023-2028 ($ million)
- Data Table on US - Market size and forecast 2023-2028 ($ million)
- Chart on US - Year-over-year growth 2023-2028 (%)
- Data Table on US - Year-over-year growth 2023-2028 (%)
- 9.9 China - Market size and forecast 2023-2028
- Chart on China - Market size and forecast 2023-2028 ($ million)
- Data Table on China - Market size and forecast 2023-2028 ($ million)
- Chart on China - Year-over-year growth 2023-2028 (%)
- Data Table on China - Year-over-year growth 2023-2028 (%)
- 9.10 Russia - Market size and forecast 2023-2028
- Chart on Russia - Market size and forecast 2023-2028 ($ million)
- Data Table on Russia - Market size and forecast 2023-2028 ($ million)
- Chart on Russia - Year-over-year growth 2023-2028 (%)
- Data Table on Russia - Year-over-year growth 2023-2028 (%)
- 9.11 Germany - Market size and forecast 2023-2028
- Chart on Germany - Market size and forecast 2023-2028 ($ million)
- Data Table on Germany - Market size and forecast 2023-2028 ($ million)
- Chart on Germany - Year-over-year growth 2023-2028 (%)
- Data Table on Germany - Year-over-year growth 2023-2028 (%)
- 9.12 UK - Market size and forecast 2023-2028
- Chart on UK - Market size and forecast 2023-2028 ($ million)
- Data Table on UK - Market size and forecast 2023-2028 ($ million)
- Chart on UK - Year-over-year growth 2023-2028 (%)
- Data Table on UK - Year-over-year growth 2023-2028 (%)
- 9.13 Market opportunity By Geographical Landscape
- Market opportunity By Geographical Landscape ($ million)
- Data Tables on Market opportunity By Geographical Landscape ($ million)
10 Drivers, Challenges, and Opportunity/Restraints
- 10.1 Market drivers
- 10.2 Market challenges
- 10.3 Impact of drivers and challenges
- Impact of drivers and challenges in 2023 and 2028
- 10.4 Market opportunities/restraints
11 Competitive Landscape
- 11.1 Overview
- 11.2 Competitive Landscape
- Overview on criticality of inputs and factors of differentiation
- 11.3 Landscape disruption
- Overview on factors of disruption
- 11.4 Industry risks
- Impact of key risks on business
12 Competitive Analysis
- 12.1 Companies profiled
- Companies covered
- 12.2 Market positioning of companies
- Matrix on companies position and classification
- 12.3 BAE Systems Plc
- BAE Systems Plc - Overview
- BAE Systems Plc - Business segments
- BAE Systems Plc - Key news
- BAE Systems Plc - Key offerings
- BAE Systems Plc - Segment focus
- 12.4 Ball Corp.
- Ball Corp. - Overview
- Ball Corp. - Business segments
- Ball Corp. - Key news
- Ball Corp. - Key offerings
- Ball Corp. - Segment focus
- 12.5 Eutelsat S.A.
- Eutelsat S.A. - Overview
- Eutelsat S.A. - Product / Service
- Eutelsat S.A. - Key news
- Eutelsat S.A. - Key offerings
- 12.6 General Dynamics Corp.
- General Dynamics Corp. - Overview
- General Dynamics Corp. - Business segments
- General Dynamics Corp. - Key news
- General Dynamics Corp. - Key offerings
- General Dynamics Corp. - Segment focus
- 12.7 Honeywell International Inc.
- Honeywell International Inc. - Overview
- Honeywell International Inc. - Business segments
- Honeywell International Inc. - Key news
- Honeywell International Inc. - Key offerings
- Honeywell International Inc. - Segment focus
- 12.8 Intelsat US LLC
- Intelsat US LLC - Overview
- Intelsat US LLC - Product / Service
- Intelsat US LLC - Key offerings
- 12.9 Israel Aerospace Industries Ltd.
- Israel Aerospace Industries Ltd. - Overview
- Israel Aerospace Industries Ltd. - Product / Service
- Israel Aerospace Industries Ltd. - Key news
- Israel Aerospace Industries Ltd. - Key offerings
- 12.10 L3Harris Technologies Inc.
- L3Harris Technologies Inc. - Overview
- L3Harris Technologies Inc. - Business segments
- L3Harris Technologies Inc. - Key news
- L3Harris Technologies Inc. - Key offerings
- L3Harris Technologies Inc. - Segment focus
- 12.11 Lockheed Martin Corp.
- Lockheed Martin Corp. - Overview
- Lockheed Martin Corp. - Business segments
- Lockheed Martin Corp. - Key news
- Lockheed Martin Corp. - Key offerings
- Lockheed Martin Corp. - Segment focus
- 12.12 MDA Corp.
- MDA Corp. - Overview
- MDA Corp. - Product / Service
- MDA Corp. - Key offerings
- 12.13 Northrop Grumman Corp.
- Northrop Grumman Corp. - Overview
- Northrop Grumman Corp. - Business segments
- Northrop Grumman Corp. - Key news
- Northrop Grumman Corp. - Key offerings
- Northrop Grumman Corp. - Segment focus
- 12.14 RTX Corp.
- RTX Corp. - Overview
- RTX Corp. - Business segments
- RTX Corp. - Key news
- RTX Corp. - Key offerings
- RTX Corp. - Segment focus
- 12.15 Thales Group
- Thales Group - Overview
- Thales Group - Business segments
- Thales Group - Key news
- Thales Group - Key offerings
- Thales Group - Segment focus
- 12.16 The Boeing Co.
- The Boeing Co. - Overview
- The Boeing Co. - Business segments
- The Boeing Co. - Key news
- The Boeing Co. - Key offerings
- The Boeing Co. - Segment focus
- 12.17 Viasat Inc.
- Viasat Inc. - Overview
- Viasat Inc. - Business segments
- Viasat Inc. - Key news
- Viasat Inc. - Key offerings
- Viasat Inc. - Segment focus
13 Appendix
- 13.1 Scope of the report
- 13.2 Inclusions and exclusions checklist
- Inclusions checklist
- Exclusions checklist
- 13.3 Currency conversion rates for US$
- Currency conversion rates for US$
- 13.4 Research methodology
- Research methodology
- 13.5 Data procurement
- Information sources
- 13.6 Data validation
- Data validation
- 13.7 Validation techniques employed for market sizing
- Validation techniques employed for market sizing
- 13.8 Data synthesis
- Data synthesis
- 13.9 360 degree market analysis
- 360 degree market analysis
- 13.10 List of abbreviations
- List of abbreviations

