|
|
市場調査レポート
商品コード
1645661
コンビニエンスストアの世界市場 2025~2029年Global Convenience Stores Market 2025-2029 |
||||||
|
|||||||
カスタマイズ可能
|
|||||||

| コンビニエンスストアの世界市場 2025~2029年 |
|
出版日: 2025年01月22日
発行: TechNavio
ページ情報: 英文 197 Pages
納期: 即納可能
|

全表示
- 概要
- 図表
- 目次
コンビニエンスストア市場は2024~2029年に1兆369億米ドル、予測期間中のCAGRは7.1%で成長すると予測されます。
当レポートでは、コンビニエンスストア市場の全体的な分析、市場規模・予測、動向、成長促進要因、課題、約25のベンダーを網羅したベンダー分析などを掲載しています。
現在の市場シナリオ、最新動向と促進要因、市場環境全体に関する最新分析を提供しています。市場は、便利な食品への需要の高まり、急速な都市化と消費支出の増加、バンドル価格やボリュームディスカウント、季節セールなどのプロモーションの高まりによって牽引されています。
| 市場範囲 | |
|---|---|
| 基準年 | 2025年 |
| 終了年 | 2029年 |
| 予測期間 | 2025~2029年 |
| 成長モメンタム | 加速 |
| 前年比[2025年] | 6.5% |
| CAGR | 7.1% |
| 増分額 | 1兆369億米ドル |
本調査では、今後数年間のコンビニエンスストア市場の成長を牽引する主要要因の一つとして、プライベートブランドに対する需要の増加を挙げています。また、百貨店をサポートするスキャンアンドゴーペイシステムやオムニチャネル機能の出現は、市場の大きな需要につながります。
目次
第1章 エグゼクティブサマリー
- 市場概要
第2章 Technavio分析
- 価格・ライフサイクル・顧客購入バスケット・採用率・購入基準の分析
- インプットの重要性と差別化の要因
- 混乱の要因
- 促進要因と課題の影響
第3章 市場情勢
- 市場エコシステム
- 市場の特徴
- バリューチェーン分析
第4章 市場規模
- 市場の定義
- 市場セグメント分析
- 市場規模 2024年
- 市場の展望 2024~2029年
第5章 市場規模実績
- コンビニエンスストアの世界市場 2019~2023年
- 所有者セグメント分析 2019~2023年
- タイプ別セグメント分析 2019~2023年
- 地域別セグメント分析 2019~2023年
- 国別セグメント分析 2019~2023年
第6章 定性分析
- AIの影響-コンビニエンスストアの世界市場
第7章 ファイブフォース分析
- ファイブフォースの要約
- 買い手の交渉力
- 供給企業の交渉力
- 新規参入業者の脅威
- 代替品の脅威
- 競争の脅威
- 市況
第8章 市場セグメンテーション:所有者別
- 市場セグメント
- 比較:所有者別
- 独立小売業者:市場規模と予測 2024~2029年
- 小売チェーン:市場規模と予測 2024~2029年
- 市場機会:所有者別
第9章 市場セグメンテーション:タイプ別
- 市場セグメント
- 比較:タイプ別
- 伝統的コンビニエンスストア:市場規模と予測 2024~2029年
- ミニコンビニ:市場規模と予測 2024~2029年
- ハイパーコンビニ:市場規模と予測 2024~2029年
- コンビニエンスストアの拡大:市場規模と予測 2024~2029年
- その他:市場規模と予測 2024~2029年
- 市場機会:タイプ別
第10章 顧客情勢
- 顧客情勢概要
第11章 地域別情勢
- 地域別セグメンテーション
- 比較:地域別
- 北米:市場規模と予測 2024~2029年
- アジア太平洋:市場規模と予測 2024~2029年
- 欧州:市場規模と予測 2024~2029年
- 中東・アフリカ:市場規模と予測 2024~2029年
- 南米:市場規模と予測 2024~2029年
- 米国:市場規模と予測 2024~2029年
- 中国:市場規模と予測 2024~2029年
- インド:市場規模と予測 2024~2029年
- 日本:市場規模と予測 2024~2029年
- 韓国:市場規模と予測 2024~2029年
- カナダ:市場規模と予測 2024~2029年
- 英国:市場規模と予測 2024~2029年
- ドイツ:市場規模と予測 2024~2029年
- フランス:市場規模と予測 2024~2029年
- イタリア:市場規模と予測 2024~2029年
- 地域情勢による市場機会
第12章 促進要因・課題・機会・抑制要因
- 市場促進要因
- 市場課題
- 促進要因と課題の影響
- 市場機会・抑制要因
第13章 競合情勢
- 概要
- 競合情勢
- 混乱の状況
- 産業のリスク
第14章 競合分析
- 企業プロファイル
- 企業ランキング指数
- 企業の市場ポジショニング
- Alimentation Couche Tard Inc.
- Amazon.com Inc.
- BP Plc
- Caseys General Stores Inc.
- EG Group
- ITOCHU Corp.
- Krause Group
- Kwik Trip
- Magnit
- Mitsubishi Corp.
- Parkland Fuel Corp.
- PT Indomarco Prismatama
- Royal Farms
- Seven and i Holdings Co. Ltd.
- Walmart Inc.
第15章 付録
Exhibits:
- Exhibits1: Executive Summary - Chart on Market Overview
- Exhibits2: Executive Summary - Data Table on Market Overview
- Exhibits3: Executive Summary - Chart on Global Market Characteristics
- Exhibits4: Executive Summary - Chart on Market By Geographical Landscape
- Exhibits5: Executive Summary - Chart on Market Segmentation by Ownership
- Exhibits6: Executive Summary - Chart on Market Segmentation by Type
- Exhibits7: Executive Summary - Chart on Incremental Growth
- Exhibits8: Executive Summary - Data Table on Incremental Growth
- Exhibits9: Executive Summary - Chart on Company Market Positioning
- Exhibits10: Analysis of price sensitivity, lifecycle, customer purchase basket, adoption rates, and purchase criteria
- Exhibits11: Overview on criticality of inputs and factors of differentiation
- Exhibits12: Overview on factors of disruption
- Exhibits13: Impact of drivers and challenges in 2024 and 2029
- Exhibits14: Parent Market
- Exhibits15: Data Table on - Parent Market
- Exhibits16: Market characteristics analysis
- Exhibits17: Value chain analysis
- Exhibits18: Offerings of companies included in the market definition
- Exhibits19: Market segments
- Exhibits20: Chart on Global - Market size and forecast 2024-2029 ($ billion)
- Exhibits21: Data Table on Global - Market size and forecast 2024-2029 ($ billion)
- Exhibits22: Chart on Global Market: Year-over-year growth 2024-2029 (%)
- Exhibits23: Data Table on Global Market: Year-over-year growth 2024-2029 (%)
- Exhibits24: Historic Market Size - Data Table on Global Convenience Stores Market 2019 - 2023 ($ billion)
- Exhibits25: Historic Market Size - Ownership Segment 2019 - 2023 ($ billion)
- Exhibits26: Historic Market Size - Type Segment 2019 - 2023 ($ billion)
- Exhibits27: Historic Market Size - Geography Segment 2019 - 2023 ($ billion)
- Exhibits28: Historic Market Size - Country Segment 2019 - 2023 ($ billion)
- Exhibits29: Five forces analysis - Comparison between 2024 and 2029
- Exhibits30: Bargaining power of buyers - Impact of key factors 2024 and 2029
- Exhibits31: Bargaining power of suppliers - Impact of key factors in 2024 and 2029
- Exhibits32: Threat of new entrants - Impact of key factors in 2024 and 2029
- Exhibits33: Threat of substitutes - Impact of key factors in 2024 and 2029
- Exhibits34: Threat of rivalry - Impact of key factors in 2024 and 2029
- Exhibits35: Chart on Market condition - Five forces 2024 and 2029
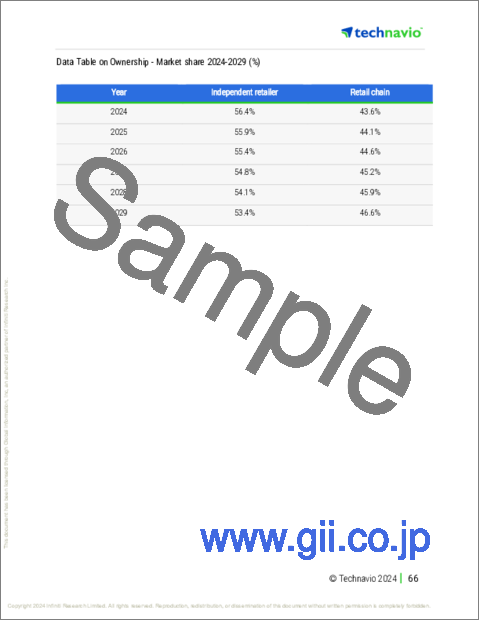
- Exhibits36: Chart on Ownership - Market share 2024-2029 (%)
- Exhibits37: Data Table on Ownership - Market share 2024-2029 (%)
- Exhibits38: Chart on Comparison by Ownership
- Exhibits39: Data Table on Comparison by Ownership
- Exhibits40: Chart on Independent retailer - Market size and forecast 2024-2029 ($ billion)
- Exhibits41: Data Table on Independent retailer - Market size and forecast 2024-2029 ($ billion)
- Exhibits42: Chart on Independent retailer - Year-over-year growth 2024-2029 (%)
- Exhibits43: Data Table on Independent retailer - Year-over-year growth 2024-2029 (%)
- Exhibits44: Chart on Retail chain - Market size and forecast 2024-2029 ($ billion)
- Exhibits45: Data Table on Retail chain - Market size and forecast 2024-2029 ($ billion)
- Exhibits46: Chart on Retail chain - Year-over-year growth 2024-2029 (%)
- Exhibits47: Data Table on Retail chain - Year-over-year growth 2024-2029 (%)
- Exhibits48: Market opportunity by Ownership ($ billion)
- Exhibits49: Data Table on Market opportunity by Ownership ($ billion)
- Exhibits50: Chart on Type - Market share 2024-2029 (%)
- Exhibits51: Data Table on Type - Market share 2024-2029 (%)
- Exhibits52: Chart on Comparison by Type
- Exhibits53: Data Table on Comparison by Type
- Exhibits54: Chart on Traditional convenience store - Market size and forecast 2024-2029 ($ billion)
- Exhibits55: Data Table on Traditional convenience store - Market size and forecast 2024-2029 ($ billion)
- Exhibits56: Chart on Traditional convenience store - Year-over-year growth 2024-2029 (%)
- Exhibits57: Data Table on Traditional convenience store - Year-over-year growth 2024-2029 (%)
- Exhibits58: Chart on Mini convenience store - Market size and forecast 2024-2029 ($ billion)
- Exhibits59: Data Table on Mini convenience store - Market size and forecast 2024-2029 ($ billion)
- Exhibits60: Chart on Mini convenience store - Year-over-year growth 2024-2029 (%)
- Exhibits61: Data Table on Mini convenience store - Year-over-year growth 2024-2029 (%)
- Exhibits62: Chart on Hyper convenience store - Market size and forecast 2024-2029 ($ billion)
- Exhibits63: Data Table on Hyper convenience store - Market size and forecast 2024-2029 ($ billion)
- Exhibits64: Chart on Hyper convenience store - Year-over-year growth 2024-2029 (%)
- Exhibits65: Data Table on Hyper convenience store - Year-over-year growth 2024-2029 (%)
- Exhibits66: Chart on Expanded convenience store - Market size and forecast 2024-2029 ($ billion)
- Exhibits67: Data Table on Expanded convenience store - Market size and forecast 2024-2029 ($ billion)
- Exhibits68: Chart on Expanded convenience store - Year-over-year growth 2024-2029 (%)
- Exhibits69: Data Table on Expanded convenience store - Year-over-year growth 2024-2029 (%)
- Exhibits70: Chart on Others - Market size and forecast 2024-2029 ($ billion)
- Exhibits71: Data Table on Others - Market size and forecast 2024-2029 ($ billion)
- Exhibits72: Chart on Others - Year-over-year growth 2024-2029 (%)
- Exhibits73: Data Table on Others - Year-over-year growth 2024-2029 (%)
- Exhibits74: Market opportunity by Type ($ billion)
- Exhibits75: Data Table on Market opportunity by Type ($ billion)
- Exhibits76: Analysis of price sensitivity, lifecycle, customer purchase basket, adoption rates, and purchase criteria
- Exhibits77: Chart on Market share By Geographical Landscape 2024-2029 (%)
- Exhibits78: Data Table on Market share By Geographical Landscape 2024-2029 (%)
- Exhibits79: Chart on Geographic comparison
- Exhibits80: Data Table on Geographic comparison
- Exhibits81: Chart on North America - Market size and forecast 2024-2029 ($ billion)
- Exhibits82: Data Table on North America - Market size and forecast 2024-2029 ($ billion)
- Exhibits83: Chart on North America - Year-over-year growth 2024-2029 (%)
- Exhibits84: Data Table on North America - Year-over-year growth 2024-2029 (%)
- Exhibits85: Chart on APAC - Market size and forecast 2024-2029 ($ billion)
- Exhibits86: Data Table on APAC - Market size and forecast 2024-2029 ($ billion)
- Exhibits87: Chart on APAC - Year-over-year growth 2024-2029 (%)
- Exhibits88: Data Table on APAC - Year-over-year growth 2024-2029 (%)
- Exhibits89: Chart on Europe - Market size and forecast 2024-2029 ($ billion)
- Exhibits90: Data Table on Europe - Market size and forecast 2024-2029 ($ billion)
- Exhibits91: Chart on Europe - Year-over-year growth 2024-2029 (%)
- Exhibits92: Data Table on Europe - Year-over-year growth 2024-2029 (%)
- Exhibits93: Chart on Middle East and Africa - Market size and forecast 2024-2029 ($ billion)
- Exhibits94: Data Table on Middle East and Africa - Market size and forecast 2024-2029 ($ billion)
- Exhibits95: Chart on Middle East and Africa - Year-over-year growth 2024-2029 (%)
- Exhibits96: Data Table on Middle East and Africa - Year-over-year growth 2024-2029 (%)
- Exhibits97: Chart on South America - Market size and forecast 2024-2029 ($ billion)
- Exhibits98: Data Table on South America - Market size and forecast 2024-2029 ($ billion)
- Exhibits99: Chart on South America - Year-over-year growth 2024-2029 (%)
- Exhibits100: Data Table on South America - Year-over-year growth 2024-2029 (%)
- Exhibits101: Chart on US - Market size and forecast 2024-2029 ($ billion)
- Exhibits102: Data Table on US - Market size and forecast 2024-2029 ($ billion)
- Exhibits103: Chart on US - Year-over-year growth 2024-2029 (%)
- Exhibits104: Data Table on US - Year-over-year growth 2024-2029 (%)
- Exhibits105: Chart on China - Market size and forecast 2024-2029 ($ billion)
- Exhibits106: Data Table on China - Market size and forecast 2024-2029 ($ billion)
- Exhibits107: Chart on China - Year-over-year growth 2024-2029 (%)
- Exhibits108: Data Table on China - Year-over-year growth 2024-2029 (%)
- Exhibits109: Chart on India - Market size and forecast 2024-2029 ($ billion)
- Exhibits110: Data Table on India - Market size and forecast 2024-2029 ($ billion)
- Exhibits111: Chart on India - Year-over-year growth 2024-2029 (%)
- Exhibits112: Data Table on India - Year-over-year growth 2024-2029 (%)
- Exhibits113: Chart on Japan - Market size and forecast 2024-2029 ($ billion)
- Exhibits114: Data Table on Japan - Market size and forecast 2024-2029 ($ billion)
- Exhibits115: Chart on Japan - Year-over-year growth 2024-2029 (%)
- Exhibits116: Data Table on Japan - Year-over-year growth 2024-2029 (%)
- Exhibits117: Chart on South Korea - Market size and forecast 2024-2029 ($ billion)
- Exhibits118: Data Table on South Korea - Market size and forecast 2024-2029 ($ billion)
- Exhibits119: Chart on South Korea - Year-over-year growth 2024-2029 (%)
- Exhibits120: Data Table on South Korea - Year-over-year growth 2024-2029 (%)
- Exhibits121: Chart on Canada - Market size and forecast 2024-2029 ($ billion)
- Exhibits122: Data Table on Canada - Market size and forecast 2024-2029 ($ billion)
- Exhibits123: Chart on Canada - Year-over-year growth 2024-2029 (%)
- Exhibits124: Data Table on Canada - Year-over-year growth 2024-2029 (%)
- Exhibits125: Chart on UK - Market size and forecast 2024-2029 ($ billion)
- Exhibits126: Data Table on UK - Market size and forecast 2024-2029 ($ billion)
- Exhibits127: Chart on UK - Year-over-year growth 2024-2029 (%)
- Exhibits128: Data Table on UK - Year-over-year growth 2024-2029 (%)
- Exhibits129: Chart on Germany - Market size and forecast 2024-2029 ($ billion)
- Exhibits130: Data Table on Germany - Market size and forecast 2024-2029 ($ billion)
- Exhibits131: Chart on Germany - Year-over-year growth 2024-2029 (%)
- Exhibits132: Data Table on Germany - Year-over-year growth 2024-2029 (%)
- Exhibits133: Chart on France - Market size and forecast 2024-2029 ($ billion)
- Exhibits134: Data Table on France - Market size and forecast 2024-2029 ($ billion)
- Exhibits135: Chart on France - Year-over-year growth 2024-2029 (%)
- Exhibits136: Data Table on France - Year-over-year growth 2024-2029 (%)
- Exhibits137: Chart on Italy - Market size and forecast 2024-2029 ($ billion)
- Exhibits138: Data Table on Italy - Market size and forecast 2024-2029 ($ billion)
- Exhibits139: Chart on Italy - Year-over-year growth 2024-2029 (%)
- Exhibits140: Data Table on Italy - Year-over-year growth 2024-2029 (%)
- Exhibits141: Market opportunity By Geographical Landscape ($ billion)
- Exhibits142: Data Tables on Market opportunity By Geographical Landscape ($ billion)
- Exhibits143: Impact of drivers and challenges in 2024 and 2029
- Exhibits144: Overview on criticality of inputs and factors of differentiation
- Exhibits145: Overview on factors of disruption
- Exhibits146: Impact of key risks on business
- Exhibits147: Companies covered
- Exhibits148: Company ranking index
- Exhibits149: Matrix on companies position and classification
- Exhibits150: Alimentation Couche Tard Inc. - Overview
- Exhibits151: Alimentation Couche Tard Inc. - Product / Service
- Exhibits152: Alimentation Couche Tard Inc. - Key offerings
- Exhibits153: SWOT
- Exhibits154: Amazon.com Inc. - Overview
- Exhibits155: Amazon.com Inc. - Business segments
- Exhibits156: Amazon.com Inc. - Key news
- Exhibits157: Amazon.com Inc. - Key offerings
- Exhibits158: Amazon.com Inc. - Segment focus
- Exhibits159: SWOT
- Exhibits160: BP Plc - Overview
- Exhibits161: BP Plc - Business segments
- Exhibits162: BP Plc - Key news
- Exhibits163: BP Plc - Key offerings
- Exhibits164: BP Plc - Segment focus
- Exhibits165: SWOT
- Exhibits166: Caseys General Stores Inc. - Overview
- Exhibits167: Caseys General Stores Inc. - Product / Service
- Exhibits168: Caseys General Stores Inc. - Key offerings
- Exhibits169: SWOT
- Exhibits170: EG Group - Overview
- Exhibits171: EG Group - Product / Service
- Exhibits172: EG Group - Key offerings
- Exhibits173: SWOT
- Exhibits174: ITOCHU Corp. - Overview
- Exhibits175: ITOCHU Corp. - Business segments
- Exhibits176: ITOCHU Corp. - Key offerings
- Exhibits177: ITOCHU Corp. - Segment focus
- Exhibits178: SWOT
- Exhibits179: Krause Group - Overview
- Exhibits180: Krause Group - Product / Service
- Exhibits181: Krause Group - Key offerings
- Exhibits182: SWOT
- Exhibits183: Kwik Trip - Overview
- Exhibits184: Kwik Trip - Product / Service
- Exhibits185: Kwik Trip - Key offerings
- Exhibits186: SWOT
- Exhibits187: Magnit - Overview
- Exhibits188: Magnit - Product / Service
- Exhibits189: Magnit - Key offerings
- Exhibits190: SWOT
- Exhibits191: Mitsubishi Corp. - Overview
- Exhibits192: Mitsubishi Corp. - Business segments
- Exhibits193: Mitsubishi Corp. - Key news
- Exhibits194: Mitsubishi Corp. - Key offerings
- Exhibits195: Mitsubishi Corp. - Segment focus
- Exhibits196: SWOT
- Exhibits197: Parkland Fuel Corp. - Overview
- Exhibits198: Parkland Fuel Corp. - Product / Service
- Exhibits199: Parkland Fuel Corp. - Key offerings
- Exhibits200: SWOT
- Exhibits201: PT Indomarco Prismatama - Overview
- Exhibits202: PT Indomarco Prismatama - Product / Service
- Exhibits203: PT Indomarco Prismatama - Key offerings
- Exhibits204: SWOT
- Exhibits205: Royal Farms - Overview
- Exhibits206: Royal Farms - Product / Service
- Exhibits207: Royal Farms - Key offerings
- Exhibits208: SWOT
- Exhibits209: Seven and i Holdings Co. Ltd. - Overview
- Exhibits210: Seven and i Holdings Co. Ltd. - Product / Service
- Exhibits211: Seven and i Holdings Co. Ltd. - Key offerings
- Exhibits212: SWOT
- Exhibits213: Walmart Inc. - Overview
- Exhibits214: Walmart Inc. - Business segments
- Exhibits215: Walmart Inc. - Key news
- Exhibits216: Walmart Inc. - Key offerings
- Exhibits217: Walmart Inc. - Segment focus
- Exhibits218: SWOT
- Exhibits219: Inclusions checklist
- Exhibits220: Exclusions checklist
- Exhibits221: Currency conversion rates for US$
- Exhibits222: Research methodology
- Exhibits223: Information sources
- Exhibits224: Data validation
- Exhibits225: Validation techniques employed for market sizing
- Exhibits226: Data synthesis
- Exhibits227: 360 degree market analysis
- Exhibits228: List of abbreviations
The convenience stores market is forecasted to grow by $ 1036.9 bn during 2024-2029, accelerating at a CAGR of 7.1% during the forecast period. The report on the convenience stores market provides a holistic analysis, market size and forecast, trends, growth drivers, and challenges, as well as vendor analysis covering around 25 vendors.
The report offers an up-to-date analysis regarding the current market scenario, the latest trends and drivers, and the overall market environment. The market is driven by growing demand for convenient food products, rapid urbanization and rising consumer spending, and rising promotions including bundled prices volume discounts and seasonal sales.
| Market Scope | |
|---|---|
| Base Year | 2025 |
| End Year | 2029 |
| Series Year | 2025-2029 |
| Growth Momentum | Accelerate |
| YOY 2025 | 6.5% |
| CAGR | 7.1% |
| Incremental Value | $1036.9 bn |
Technavio's convenience stores market is segmented as below:
By Ownership
- Independent retailer
- Retail chain
By Type
- Traditional convenience store
- Mini convenience store
- Hyper convenience store
- Expanded convenience store
- Others
By Geographical Landscape
- North America
- APAC
- Europe
- Middle East and Africa
- South America
This study identifies the increase in demand for private-label brands as one of the prime reasons driving the convenience stores market growth during the next few years. Also, emergence of scan-and-go pay system and omnichannel capabilities to support department stores will lead to sizable demand in the market.
The report on the convenience stores market covers the following areas:
- Convenience Stores Market sizing
- Convenience Stores Market forecast
- Convenience Stores Market industry analysis
The robust vendor analysis is designed to help clients improve their market position, and in line with this, this report provides a detailed analysis of several leading convenience stores market vendors that include Alimentation Couche Tard Inc., Amazon.com Inc., BP Plc, Caseys General Stores Inc., EG Group, ITOCHU Corp., Krause Group, Kwik Trip, Magnit, Mitsubishi Corp., Parkland Fuel Corp., PT Indomarco Prismatama, PT Sumber Alfaria Trijaya Tbk, Retail Group N.V., Royal Farms, Seven and i Holdings Co. Ltd., and Walmart Inc.. Also, the convenience stores market analysis report includes information on upcoming trends and challenges that will influence market growth. This is to help companies strategize and leverage all forthcoming growth opportunities.
The study was conducted using an objective combination of primary and secondary information including inputs from key participants in the industry. The report contains a comprehensive market and vendor landscape in addition to an analysis of the key vendors.
The publisher presents a detailed picture of the market by the way of study, synthesis, and summation of data from multiple sources by an analysis of key parameters such as profit, pricing, competition, and promotions. It presents various market facets by identifying the key industry influencers. The data presented is comprehensive, reliable, and a result of extensive primary and secondary research. The market research reports provide a complete competitive landscape and an in-depth vendor selection methodology and analysis using qualitative and quantitative research to forecast accurate market growth.
Table of Contents
1 Executive Summary
- 1.1 Market overview
- Executive Summary - Chart on Market Overview
- Executive Summary - Data Table on Market Overview
- Executive Summary - Chart on Global Market Characteristics
- Executive Summary - Chart on Market By Geographical Landscape
- Executive Summary - Chart on Market Segmentation by Ownership
- Executive Summary - Chart on Market Segmentation by Type
- Executive Summary - Chart on Incremental Growth
- Executive Summary - Data Table on Incremental Growth
- Executive Summary - Chart on Company Market Positioning
2 Technavio Analysis
- 2.1 Analysis of price sensitivity, lifecycle, customer purchase basket, adoption rates, and purchase criteria
- Analysis of price sensitivity, lifecycle, customer purchase basket, adoption rates, and purchase criteria
- 2.2 Criticality of inputs and Factors of differentiation
- Overview on criticality of inputs and factors of differentiation
- 2.3 Factors of disruption
- Overview on factors of disruption
- 2.4 Impact of drivers and challenges
- Impact of drivers and challenges in 2024 and 2029
3 Market Landscape
- 3.1 Market ecosystem
- Parent Market
- Data Table on - Parent Market
- 3.2 Market characteristics
- Market characteristics analysis
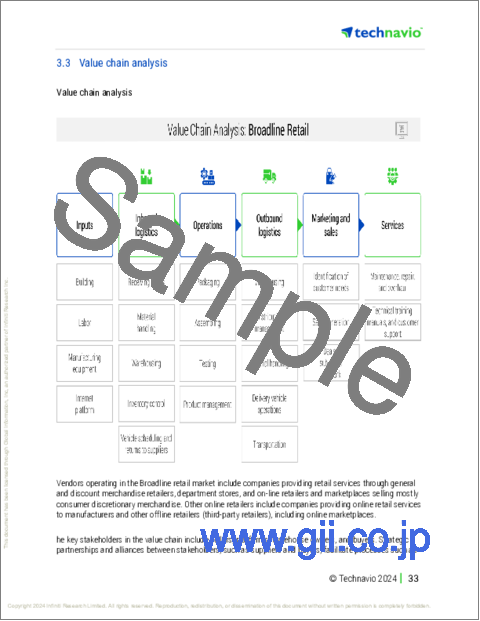
- 3.3 Value chain analysis
- Value chain analysis
4 Market Sizing
- 4.1 Market definition
- Offerings of companies included in the market definition
- 4.2 Market segment analysis
- Market segments
- 4.3 Market size 2024
- 4.4 Market outlook: Forecast for 2024-2029
- Chart on Global - Market size and forecast 2024-2029 ($ billion)
- Data Table on Global - Market size and forecast 2024-2029 ($ billion)
- Chart on Global Market: Year-over-year growth 2024-2029 (%)
- Data Table on Global Market: Year-over-year growth 2024-2029 (%)
5 Historic Market Size
- 5.1 Global Convenience Stores Market 2019 - 2023
- Historic Market Size - Data Table on Global Convenience Stores Market 2019 - 2023 ($ billion)
- 5.2 Ownership segment analysis 2019 - 2023
- Historic Market Size - Ownership Segment 2019 - 2023 ($ billion)
- 5.3 Type segment analysis 2019 - 2023
- Historic Market Size - Type Segment 2019 - 2023 ($ billion)
- 5.4 Geography segment analysis 2019 - 2023
- Historic Market Size - Geography Segment 2019 - 2023 ($ billion)
- 5.5 Country segment analysis 2019 - 2023
- Historic Market Size - Country Segment 2019 - 2023 ($ billion)
6 Qualitative Analysis
- 6.1 Impact of AI on Global Convenience Stores Market
7 Five Forces Analysis
- 7.1 Five forces summary
- Five forces analysis - Comparison between 2024 and 2029
- 7.2 Bargaining power of buyers
- Bargaining power of buyers - Impact of key factors 2024 and 2029
- 7.3 Bargaining power of suppliers
- Bargaining power of suppliers - Impact of key factors in 2024 and 2029
- 7.4 Threat of new entrants
- Threat of new entrants - Impact of key factors in 2024 and 2029
- 7.5 Threat of substitutes
- Threat of substitutes - Impact of key factors in 2024 and 2029
- 7.6 Threat of rivalry
- Threat of rivalry - Impact of key factors in 2024 and 2029
- 7.7 Market condition
- Chart on Market condition - Five forces 2024 and 2029
8 Market Segmentation by Ownership
- 8.1 Market segments
- Chart on Ownership - Market share 2024-2029 (%)
- Data Table on Ownership - Market share 2024-2029 (%)
- 8.2 Comparison by Ownership
- Chart on Comparison by Ownership
- Data Table on Comparison by Ownership
- 8.3 Independent retailer - Market size and forecast 2024-2029
- Chart on Independent retailer - Market size and forecast 2024-2029 ($ billion)
- Data Table on Independent retailer - Market size and forecast 2024-2029 ($ billion)
- Chart on Independent retailer - Year-over-year growth 2024-2029 (%)
- Data Table on Independent retailer - Year-over-year growth 2024-2029 (%)
- 8.4 Retail chain - Market size and forecast 2024-2029
- Chart on Retail chain - Market size and forecast 2024-2029 ($ billion)
- Data Table on Retail chain - Market size and forecast 2024-2029 ($ billion)
- Chart on Retail chain - Year-over-year growth 2024-2029 (%)
- Data Table on Retail chain - Year-over-year growth 2024-2029 (%)
- 8.5 Market opportunity by Ownership
- Market opportunity by Ownership ($ billion)
- Data Table on Market opportunity by Ownership ($ billion)
9 Market Segmentation by Type
- 9.1 Market segments
- Chart on Type - Market share 2024-2029 (%)
- Data Table on Type - Market share 2024-2029 (%)
- 9.2 Comparison by Type
- Chart on Comparison by Type
- Data Table on Comparison by Type
- 9.3 Traditional convenience store - Market size and forecast 2024-2029
- Chart on Traditional convenience store - Market size and forecast 2024-2029 ($ billion)
- Data Table on Traditional convenience store - Market size and forecast 2024-2029 ($ billion)
- Chart on Traditional convenience store - Year-over-year growth 2024-2029 (%)
- Data Table on Traditional convenience store - Year-over-year growth 2024-2029 (%)
- 9.4 Mini convenience store - Market size and forecast 2024-2029
- Chart on Mini convenience store - Market size and forecast 2024-2029 ($ billion)
- Data Table on Mini convenience store - Market size and forecast 2024-2029 ($ billion)
- Chart on Mini convenience store - Year-over-year growth 2024-2029 (%)
- Data Table on Mini convenience store - Year-over-year growth 2024-2029 (%)
- 9.5 Hyper convenience store - Market size and forecast 2024-2029
- Chart on Hyper convenience store - Market size and forecast 2024-2029 ($ billion)
- Data Table on Hyper convenience store - Market size and forecast 2024-2029 ($ billion)
- Chart on Hyper convenience store - Year-over-year growth 2024-2029 (%)
- Data Table on Hyper convenience store - Year-over-year growth 2024-2029 (%)
- 9.6 Expanded convenience store - Market size and forecast 2024-2029
- Chart on Expanded convenience store - Market size and forecast 2024-2029 ($ billion)
- Data Table on Expanded convenience store - Market size and forecast 2024-2029 ($ billion)
- Chart on Expanded convenience store - Year-over-year growth 2024-2029 (%)
- Data Table on Expanded convenience store - Year-over-year growth 2024-2029 (%)
- 9.7 Others - Market size and forecast 2024-2029
- Chart on Others - Market size and forecast 2024-2029 ($ billion)
- Data Table on Others - Market size and forecast 2024-2029 ($ billion)
- Chart on Others - Year-over-year growth 2024-2029 (%)
- Data Table on Others - Year-over-year growth 2024-2029 (%)
- 9.8 Market opportunity by Type
- Market opportunity by Type ($ billion)
- Data Table on Market opportunity by Type ($ billion)
10 Customer Landscape
- 10.1 Customer landscape overview
- Analysis of price sensitivity, lifecycle, customer purchase basket, adoption rates, and purchase criteria
11 Geographic Landscape
- 11.1 Geographic segmentation
- Chart on Market share By Geographical Landscape 2024-2029 (%)
- Data Table on Market share By Geographical Landscape 2024-2029 (%)
- 11.2 Geographic comparison
- Chart on Geographic comparison
- Data Table on Geographic comparison
- 11.3 North America - Market size and forecast 2024-2029
- Chart on North America - Market size and forecast 2024-2029 ($ billion)
- Data Table on North America - Market size and forecast 2024-2029 ($ billion)
- Chart on North America - Year-over-year growth 2024-2029 (%)
- Data Table on North America - Year-over-year growth 2024-2029 (%)
- 11.4 APAC - Market size and forecast 2024-2029
- Chart on APAC - Market size and forecast 2024-2029 ($ billion)
- Data Table on APAC - Market size and forecast 2024-2029 ($ billion)
- Chart on APAC - Year-over-year growth 2024-2029 (%)
- Data Table on APAC - Year-over-year growth 2024-2029 (%)
- 11.5 Europe - Market size and forecast 2024-2029
- Chart on Europe - Market size and forecast 2024-2029 ($ billion)
- Data Table on Europe - Market size and forecast 2024-2029 ($ billion)
- Chart on Europe - Year-over-year growth 2024-2029 (%)
- Data Table on Europe - Year-over-year growth 2024-2029 (%)
- 11.6 Middle East and Africa - Market size and forecast 2024-2029
- Chart on Middle East and Africa - Market size and forecast 2024-2029 ($ billion)
- Data Table on Middle East and Africa - Market size and forecast 2024-2029 ($ billion)
- Chart on Middle East and Africa - Year-over-year growth 2024-2029 (%)
- Data Table on Middle East and Africa - Year-over-year growth 2024-2029 (%)
- 11.7 South America - Market size and forecast 2024-2029
- Chart on South America - Market size and forecast 2024-2029 ($ billion)
- Data Table on South America - Market size and forecast 2024-2029 ($ billion)
- Chart on South America - Year-over-year growth 2024-2029 (%)
- Data Table on South America - Year-over-year growth 2024-2029 (%)
- 11.8 US - Market size and forecast 2024-2029
- Chart on US - Market size and forecast 2024-2029 ($ billion)
- Data Table on US - Market size and forecast 2024-2029 ($ billion)
- Chart on US - Year-over-year growth 2024-2029 (%)
- Data Table on US - Year-over-year growth 2024-2029 (%)
- 11.9 China - Market size and forecast 2024-2029
- Chart on China - Market size and forecast 2024-2029 ($ billion)
- Data Table on China - Market size and forecast 2024-2029 ($ billion)
- Chart on China - Year-over-year growth 2024-2029 (%)
- Data Table on China - Year-over-year growth 2024-2029 (%)
- 11.10 India - Market size and forecast 2024-2029
- Chart on India - Market size and forecast 2024-2029 ($ billion)
- Data Table on India - Market size and forecast 2024-2029 ($ billion)
- Chart on India - Year-over-year growth 2024-2029 (%)
- Data Table on India - Year-over-year growth 2024-2029 (%)
- 11.11 Japan - Market size and forecast 2024-2029
- Chart on Japan - Market size and forecast 2024-2029 ($ billion)
- Data Table on Japan - Market size and forecast 2024-2029 ($ billion)
- Chart on Japan - Year-over-year growth 2024-2029 (%)
- Data Table on Japan - Year-over-year growth 2024-2029 (%)
- 11.12 South Korea - Market size and forecast 2024-2029
- Chart on South Korea - Market size and forecast 2024-2029 ($ billion)
- Data Table on South Korea - Market size and forecast 2024-2029 ($ billion)
- Chart on South Korea - Year-over-year growth 2024-2029 (%)
- Data Table on South Korea - Year-over-year growth 2024-2029 (%)
- 11.13 Canada - Market size and forecast 2024-2029
- Chart on Canada - Market size and forecast 2024-2029 ($ billion)
- Data Table on Canada - Market size and forecast 2024-2029 ($ billion)
- Chart on Canada - Year-over-year growth 2024-2029 (%)
- Data Table on Canada - Year-over-year growth 2024-2029 (%)
- 11.14 UK - Market size and forecast 2024-2029
- Chart on UK - Market size and forecast 2024-2029 ($ billion)
- Data Table on UK - Market size and forecast 2024-2029 ($ billion)
- Chart on UK - Year-over-year growth 2024-2029 (%)
- Data Table on UK - Year-over-year growth 2024-2029 (%)
- 11.15 Germany - Market size and forecast 2024-2029
- Chart on Germany - Market size and forecast 2024-2029 ($ billion)
- Data Table on Germany - Market size and forecast 2024-2029 ($ billion)
- Chart on Germany - Year-over-year growth 2024-2029 (%)
- Data Table on Germany - Year-over-year growth 2024-2029 (%)
- 11.16 France - Market size and forecast 2024-2029
- Chart on France - Market size and forecast 2024-2029 ($ billion)
- Data Table on France - Market size and forecast 2024-2029 ($ billion)
- Chart on France - Year-over-year growth 2024-2029 (%)
- Data Table on France - Year-over-year growth 2024-2029 (%)
- 11.17 Italy - Market size and forecast 2024-2029
- Chart on Italy - Market size and forecast 2024-2029 ($ billion)
- Data Table on Italy - Market size and forecast 2024-2029 ($ billion)
- Chart on Italy - Year-over-year growth 2024-2029 (%)
- Data Table on Italy - Year-over-year growth 2024-2029 (%)
- 11.18 Market opportunity By Geographical Landscape
- Market opportunity By Geographical Landscape ($ billion)
- Data Tables on Market opportunity By Geographical Landscape ($ billion)
12 Drivers, Challenges, and Opportunity/Restraints
- 12.1 Market drivers
- 12.2 Market challenges
- 12.3 Impact of drivers and challenges
- Impact of drivers and challenges in 2024 and 2029
- 12.4 Market opportunities/restraints
13 Competitive Landscape
- 13.1 Overview
- 13.2 Competitive Landscape
- Overview on criticality of inputs and factors of differentiation
- 13.3 Landscape disruption
- Overview on factors of disruption
- 13.4 Industry risks
- Impact of key risks on business
14 Competitive Analysis
- 14.1 Companies profiled
- Companies covered
- 14.2 Company ranking index
- Company ranking index
- 14.3 Market positioning of companies
- Matrix on companies position and classification
- 14.4 Alimentation Couche Tard Inc.
- Alimentation Couche Tard Inc. - Overview
- Alimentation Couche Tard Inc. - Product / Service
- Alimentation Couche Tard Inc. - Key offerings
- SWOT
- 14.5 Amazon.com Inc.
- Amazon.com Inc. - Overview
- Amazon.com Inc. - Business segments
- Amazon.com Inc. - Key news
- Amazon.com Inc. - Key offerings
- Amazon.com Inc. - Segment focus
- SWOT
- 14.6 BP Plc
- BP Plc - Overview
- BP Plc - Business segments
- BP Plc - Key news
- BP Plc - Key offerings
- BP Plc - Segment focus
- SWOT
- 14.7 Caseys General Stores Inc.
- Caseys General Stores Inc. - Overview
- Caseys General Stores Inc. - Product / Service
- Caseys General Stores Inc. - Key offerings
- SWOT
- 14.8 EG Group
- EG Group - Overview
- EG Group - Product / Service
- EG Group - Key offerings
- SWOT
- 14.9 ITOCHU Corp.
- ITOCHU Corp. - Overview
- ITOCHU Corp. - Business segments
- ITOCHU Corp. - Key offerings
- ITOCHU Corp. - Segment focus
- SWOT
- 14.10 Krause Group
- Krause Group - Overview
- Krause Group - Product / Service
- Krause Group - Key offerings
- SWOT
- 14.11 Kwik Trip
- Kwik Trip - Overview
- Kwik Trip - Product / Service
- Kwik Trip - Key offerings
- SWOT
- 14.12 Magnit
- Magnit - Overview
- Magnit - Product / Service
- Magnit - Key offerings
- SWOT
- 14.13 Mitsubishi Corp.
- Mitsubishi Corp. - Overview
- Mitsubishi Corp. - Business segments
- Mitsubishi Corp. - Key news
- Mitsubishi Corp. - Key offerings
- Mitsubishi Corp. - Segment focus
- SWOT
- 14.14 Parkland Fuel Corp.
- Parkland Fuel Corp. - Overview
- Parkland Fuel Corp. - Product / Service
- Parkland Fuel Corp. - Key offerings
- SWOT
- 14.15 PT Indomarco Prismatama
- PT Indomarco Prismatama - Overview
- PT Indomarco Prismatama - Product / Service
- PT Indomarco Prismatama - Key offerings
- SWOT
- 14.16 Royal Farms
- Royal Farms - Overview
- Royal Farms - Product / Service
- Royal Farms - Key offerings
- SWOT
- 14.17 Seven and i Holdings Co. Ltd.
- Seven and i Holdings Co. Ltd. - Overview
- Seven and i Holdings Co. Ltd. - Product / Service
- Seven and i Holdings Co. Ltd. - Key offerings
- SWOT
- 14.18 Walmart Inc.
- Walmart Inc. - Overview
- Walmart Inc. - Business segments
- Walmart Inc. - Key news
- Walmart Inc. - Key offerings
- Walmart Inc. - Segment focus
- SWOT
15 Appendix
- 15.1 Scope of the report
- 15.2 Inclusions and exclusions checklist
- Inclusions checklist
- Exclusions checklist
- 15.3 Currency conversion rates for US$
- Currency conversion rates for US$
- 15.4 Research methodology
- Research methodology
- 15.5 Data procurement
- Information sources
- 15.6 Data validation
- Data validation
- 15.7 Validation techniques employed for market sizing
- Validation techniques employed for market sizing
- 15.8 Data synthesis
- Data synthesis
- 15.9 360 degree market analysis
- 360 degree market analysis
- 15.10 List of abbreviations
- List of abbreviations

