|
|
市場調査レポート
商品コード
1524998
小売業における拡張現実の世界市場 2024-2028Global augmented reality in retail market 2024-2028 |
||||||
|
|||||||
カスタマイズ可能
|
|||||||

| 小売業における拡張現実の世界市場 2024-2028 |
|
出版日: 2024年06月11日
発行: TechNavio
ページ情報: 英文 147 Pages
納期: 即納可能
|

全表示
- 概要
- 図表
- 目次
小売業における拡張現実市場は2023-2028年に195億1,290万米ドル、予測期間中のCAGRは57.74%で成長すると予測されます。
当レポートでは、小売業における拡張現実市場の全体的な分析、市場規模・予測、動向、成長促進要因、課題、約25のベンダーを網羅したベンダー分析などを掲載しています。
現在の市場シナリオ、最新動向と促進要因、市場環境全体に関する最新分析を提供しています。市場を牽引しているのは、広告効果を高めるためのAR技術の活用、業務の効率化、顧客対応業務の容易化などです。
| 市場範囲 | |
|---|---|
| 基準年 | 2024 |
| 終了年 | 2028 |
| 予測期間 | 2024-2028 |
| 成長モメンタム | 加速 |
| 前年比2024年 | 43.16% |
| CAGR | 57.74% |
| 増分額 | 195億1,290万米ドル |
本調査では、今後数年間の小売業における拡張現実市場成長を牽引する主な要因の1つとして、スマートフォンやタブレット端末の普及が小売業界におけるARの成長を促進することを挙げています。また、新興企業数の増加や新興経済諸国における市場浸透の高まりは、同市場における大きな需要につながります。
目次
第1章 エグゼクティブサマリー
- 市場概要
第2章 市場情勢
- 市場エコシステム
- 市場の特徴
- バリューチェーン分析
第3章 市場規模の評価
- 市場の定義
- 市場セグメント分析
- 市場規模 2023
- 市場の見通し 2023-2028
第4章 市場規模実績
- 世界小売業における拡張現実市場 2018-2022
- タイプ別セグメント分析 2018-2022
- 地域別セグメント分析 2018-2022
- 国別セグメント分析 2018-2022
第5章 ファイブフォース分析
- ファイブフォースの要約
- 買い手の交渉力
- 供給企業の交渉力
- 新規参入業者の脅威
- 代替品の脅威
- 競争の脅威
- 市況
第6章 市場セグメンテーション:タイプ別
- 市場セグメンテーション
- 比較:タイプ別
- 衣服:市場規模と予測 2023-2028
- 家具照明と装飾:市場規模と予測 2023-2028
- 履物:市場規模と予測 2023-2028
- 食料品:市場規模と予測 2023-2028
- その他:市場規模と予測 2023-2028
- 市場機会:タイプ別
第7章 顧客情勢
- 顧客情勢の概要
第8章 地域別情勢
- 地域別セグメンテーション
- 地域別比較
- 北米:市場規模と予測 2023-2028
- 欧州:市場規模と予測 2023-2028
- アジア太平洋:市場規模と予測 2023-2028
- 南米:市場規模と予測 2023-2028
- 中東・アフリカ:市場規模と予測 2023-2028
- 米国:市場規模と予測 2023-2028
- 中国:市場規模と予測 2023-2028
- ドイツ:市場規模と予測 2023-2028
- 英国:市場規模と予測 2023-2028
- カナダ:市場規模と予測 2023-2028
- 市場機会:地域情勢別
第9章 促進要因・課題・機会・抑制要因
- 市場促進要因
- 市場の課題
- 促進要因と課題の影響
- 市場の機会・抑制要因
第10章 競合情勢
- 概要
- 競合情勢
- 混乱の状況
- 業界のリスク
第11章 競合分析
- 企業プロファイル
- 企業の市場ポジショニング
- Alphabet Inc.
- Apple Inc.
- HP Inc.
- HTC Corp.
- Magic Leap Inc.
- Microsoft Corp.
- Samsung Electronics Co. Ltd.
- Sony Group Corp.
- Toshiba Corp.
- VR Vision Inc.
第12章 付録
Exhibits:
- Exhibits1: Executive Summary - Chart on Market Overview
- Exhibits2: Executive Summary - Data Table on Market Overview
- Exhibits3: Executive Summary - Chart on Global Market Characteristics
- Exhibits4: Executive Summary - Chart on Market By Geographical Landscape
- Exhibits5: Executive Summary - Chart on Market Segmentation by Type
- Exhibits6: Executive Summary - Chart on Incremental Growth
- Exhibits7: Executive Summary - Data Table on Incremental Growth
- Exhibits8: Executive Summary - Chart on Company Market Positioning
- Exhibits9: Parent Market
- Exhibits10: Data Table on - Parent Market
- Exhibits11: Market characteristics analysis
- Exhibits12: Value Chain Analysis
- Exhibits13: Offerings of companies included in the market definition
- Exhibits14: Market segments
- Exhibits15: Chart on Global - Market size and forecast 2023-2028 ($ million)
- Exhibits16: Data Table on Global - Market size and forecast 2023-2028 ($ million)
- Exhibits17: Chart on Global Market: Year-over-year growth 2023-2028 (%)
- Exhibits18: Data Table on Global Market: Year-over-year growth 2023-2028 (%)
- Exhibits19: Historic Market Size - Data Table on Global Augmented Reality In Retail Market 2018 - 2022 ($ million)
- Exhibits20: Historic Market Size - Type Segment 2018 - 2022 ($ million)
- Exhibits21: Historic Market Size - Geography Segment 2018 - 2022 ($ million)
- Exhibits22: Historic Market Size - Country Segment 2018 - 2022 ($ million)
- Exhibits23: Five forces analysis - Comparison between 2023 and 2028
- Exhibits24: Bargaining power of buyers - Impact of key factors 2023 and 2028
- Exhibits25: Bargaining power of suppliers - Impact of key factors in 2023 and 2028
- Exhibits26: Threat of new entrants - Impact of key factors in 2023 and 2028
- Exhibits27: Threat of substitutes - Impact of key factors in 2023 and 2028
- Exhibits28: Threat of rivalry - Impact of key factors in 2023 and 2028
- Exhibits29: Chart on Market condition - Five forces 2023 and 2028
- Exhibits30: Chart on Type - Market share 2023-2028 (%)
- Exhibits31: Data Table on Type - Market share 2023-2028 (%)
- Exhibits32: Chart on Comparison by Type
- Exhibits33: Data Table on Comparison by Type
- Exhibits34: Chart on Apparel - Market size and forecast 2023-2028 ($ million)
- Exhibits35: Data Table on Apparel - Market size and forecast 2023-2028 ($ million)
- Exhibits36: Chart on Apparel - Year-over-year growth 2023-2028 (%)
- Exhibits37: Data Table on Apparel - Year-over-year growth 2023-2028 (%)
- Exhibits38: Chart on Furniture lighting and decor - Market size and forecast 2023-2028 ($ million)
- Exhibits39: Data Table on Furniture lighting and decor - Market size and forecast 2023-2028 ($ million)
- Exhibits40: Chart on Furniture lighting and decor - Year-over-year growth 2023-2028 (%)
- Exhibits41: Data Table on Furniture lighting and decor - Year-over-year growth 2023-2028 (%)
- Exhibits42: Chart on Footwear - Market size and forecast 2023-2028 ($ million)
- Exhibits43: Data Table on Footwear - Market size and forecast 2023-2028 ($ million)
- Exhibits44: Chart on Footwear - Year-over-year growth 2023-2028 (%)
- Exhibits45: Data Table on Footwear - Year-over-year growth 2023-2028 (%)
- Exhibits46: Chart on Grocery - Market size and forecast 2023-2028 ($ million)
- Exhibits47: Data Table on Grocery - Market size and forecast 2023-2028 ($ million)
- Exhibits48: Chart on Grocery - Year-over-year growth 2023-2028 (%)
- Exhibits49: Data Table on Grocery - Year-over-year growth 2023-2028 (%)
- Exhibits50: Chart on Others - Market size and forecast 2023-2028 ($ million)
- Exhibits51: Data Table on Others - Market size and forecast 2023-2028 ($ million)
- Exhibits52: Chart on Others - Year-over-year growth 2023-2028 (%)
- Exhibits53: Data Table on Others - Year-over-year growth 2023-2028 (%)
- Exhibits54: Market opportunity by Type ($ million)
- Exhibits55: Data Table on Market opportunity by Type ($ million)
- Exhibits56: Analysis of price sensitivity, lifecycle, customer purchase basket, adoption rates, and purchase criteria
- Exhibits57: Chart on Market share By Geographical Landscape 2023-2028 (%)
- Exhibits58: Data Table on Market share By Geographical Landscape 2023-2028 (%)
- Exhibits59: Chart on Geographic comparison
- Exhibits60: Data Table on Geographic comparison
- Exhibits61: Chart on North America - Market size and forecast 2023-2028 ($ million)
- Exhibits62: Data Table on North America - Market size and forecast 2023-2028 ($ million)
- Exhibits63: Chart on North America - Year-over-year growth 2023-2028 (%)
- Exhibits64: Data Table on North America - Year-over-year growth 2023-2028 (%)
- Exhibits65: Chart on Europe - Market size and forecast 2023-2028 ($ million)
- Exhibits66: Data Table on Europe - Market size and forecast 2023-2028 ($ million)
- Exhibits67: Chart on Europe - Year-over-year growth 2023-2028 (%)
- Exhibits68: Data Table on Europe - Year-over-year growth 2023-2028 (%)
- Exhibits69: Chart on APAC - Market size and forecast 2023-2028 ($ million)
- Exhibits70: Data Table on APAC - Market size and forecast 2023-2028 ($ million)
- Exhibits71: Chart on APAC - Year-over-year growth 2023-2028 (%)
- Exhibits72: Data Table on APAC - Year-over-year growth 2023-2028 (%)
- Exhibits73: Chart on South America - Market size and forecast 2023-2028 ($ million)
- Exhibits74: Data Table on South America - Market size and forecast 2023-2028 ($ million)
- Exhibits75: Chart on South America - Year-over-year growth 2023-2028 (%)
- Exhibits76: Data Table on South America - Year-over-year growth 2023-2028 (%)
- Exhibits77: Chart on Middle East and Africa - Market size and forecast 2023-2028 ($ million)
- Exhibits78: Data Table on Middle East and Africa - Market size and forecast 2023-2028 ($ million)
- Exhibits79: Chart on Middle East and Africa - Year-over-year growth 2023-2028 (%)
- Exhibits80: Data Table on Middle East and Africa - Year-over-year growth 2023-2028 (%)
- Exhibits81: Chart on US - Market size and forecast 2023-2028 ($ million)
- Exhibits82: Data Table on US - Market size and forecast 2023-2028 ($ million)
- Exhibits83: Chart on US - Year-over-year growth 2023-2028 (%)
- Exhibits84: Data Table on US - Year-over-year growth 2023-2028 (%)
- Exhibits85: Chart on China - Market size and forecast 2023-2028 ($ million)
- Exhibits86: Data Table on China - Market size and forecast 2023-2028 ($ million)
- Exhibits87: Chart on China - Year-over-year growth 2023-2028 (%)
- Exhibits88: Data Table on China - Year-over-year growth 2023-2028 (%)
- Exhibits89: Chart on Germany - Market size and forecast 2023-2028 ($ million)
- Exhibits90: Data Table on Germany - Market size and forecast 2023-2028 ($ million)
- Exhibits91: Chart on Germany - Year-over-year growth 2023-2028 (%)
- Exhibits92: Data Table on Germany - Year-over-year growth 2023-2028 (%)
- Exhibits93: Chart on UK - Market size and forecast 2023-2028 ($ million)
- Exhibits94: Data Table on UK - Market size and forecast 2023-2028 ($ million)
- Exhibits95: Chart on UK - Year-over-year growth 2023-2028 (%)
- Exhibits96: Data Table on UK - Year-over-year growth 2023-2028 (%)
- Exhibits97: Chart on Canada - Market size and forecast 2023-2028 ($ million)
- Exhibits98: Data Table on Canada - Market size and forecast 2023-2028 ($ million)
- Exhibits99: Chart on Canada - Year-over-year growth 2023-2028 (%)
- Exhibits100: Data Table on Canada - Year-over-year growth 2023-2028 (%)
- Exhibits101: Market opportunity By Geographical Landscape ($ million)
- Exhibits102: Data Tables on Market opportunity By Geographical Landscape ($ million)
- Exhibits103: Impact of drivers and challenges in 2023 and 2028
- Exhibits104: Overview on criticality of inputs and factors of differentiation
- Exhibits105: Overview on factors of disruption
- Exhibits106: Impact of key risks on business
- Exhibits107: Companies covered
- Exhibits108: Matrix on companies position and classification
- Exhibits109: Alphabet Inc. - Overview
- Exhibits110: Alphabet Inc. - Business segments
- Exhibits111: Alphabet Inc. - Key offerings
- Exhibits112: Alphabet Inc. - Segment focus
- Exhibits113: Apple Inc. - Overview
- Exhibits114: Apple Inc. - Business segments
- Exhibits115: Apple Inc. - Key news
- Exhibits116: Apple Inc. - Key offerings
- Exhibits117: Apple Inc. - Segment focus
- Exhibits118: HP Inc. - Overview
- Exhibits119: HP Inc. - Business segments
- Exhibits120: HP Inc. - Key news
- Exhibits121: HP Inc. - Key offerings
- Exhibits122: HP Inc. - Segment focus
- Exhibits123: HTC Corp. - Overview
- Exhibits124: HTC Corp. - Product / Service
- Exhibits125: HTC Corp. - Key offerings
- Exhibits126: Magic Leap Inc. - Overview
- Exhibits127: Magic Leap Inc. - Product / Service
- Exhibits128: Magic Leap Inc. - Key offerings
- Exhibits129: Microsoft Corp. - Overview
- Exhibits130: Microsoft Corp. - Business segments
- Exhibits131: Microsoft Corp. - Key news
- Exhibits132: Microsoft Corp. - Key offerings
- Exhibits133: Microsoft Corp. - Segment focus
- Exhibits134: Samsung Electronics Co. Ltd. - Overview
- Exhibits135: Samsung Electronics Co. Ltd. - Business segments
- Exhibits136: Samsung Electronics Co. Ltd. - Key news
- Exhibits137: Samsung Electronics Co. Ltd. - Key offerings
- Exhibits138: Samsung Electronics Co. Ltd. - Segment focus
- Exhibits139: Sony Group Corp. - Overview
- Exhibits140: Sony Group Corp. - Business segments
- Exhibits141: Sony Group Corp. - Key news
- Exhibits142: Sony Group Corp. - Key offerings
- Exhibits143: Sony Group Corp. - Segment focus
- Exhibits144: Toshiba Corp. - Overview
- Exhibits145: Toshiba Corp. - Business segments
- Exhibits146: Toshiba Corp. - Key news
- Exhibits147: Toshiba Corp. - Key offerings
- Exhibits148: Toshiba Corp. - Segment focus
- Exhibits149: VR Vision Inc. - Overview
- Exhibits150: VR Vision Inc. - Product / Service
- Exhibits151: VR Vision Inc. - Key offerings
- Exhibits152: Inclusions checklist
- Exhibits153: Exclusions checklist
- Exhibits154: Currency conversion rates for US$
- Exhibits155: Research methodology
- Exhibits156: Information sources
- Exhibits157: Data validation
- Exhibits158: Validation techniques employed for market sizing
- Exhibits159: Data synthesis
- Exhibits160: 360 degree market analysis
- Exhibits161: List of abbreviations
The augmented reality in retail market is forecasted to grow by USD 19512.9 mn during 2023-2028, accelerating at a CAGR of 57.74% during the forecast period. The report on the augmented reality in retail market provides a holistic analysis, market size and forecast, trends, growth drivers, and challenges, as well as vendor analysis covering around 25 vendors.
The report offers an up-to-date analysis regarding the current market scenario, the latest trends and drivers, and the overall market environment. The market is driven by use of ar technology to make advertising more effective, increased efficiency of operations, and ease in handling customer-front operations.
Technavio's augmented reality in retail market is segmented as below:
| Market Scope | |
|---|---|
| Base Year | 2024 |
| End Year | 2028 |
| Series Year | 2024-2028 |
| Growth Momentum | Accelerate |
| YOY 2024 | 43.16% |
| CAGR | 57.74% |
| Incremental Value | $19512.9mn |
By Type
- Apparel
- Furniture lighting and decor
- Footwear
- Grocery
- Others
By Geographical Landscape
- North America
- Europe
- APAC
- South America
- Middle East and Africa
This study identifies the growing smartphones and tablets will fuel growth of ar in retail industry as one of the prime reasons driving the augmented reality in retail market growth during the next few years. Also, growing number of new start-ups and rising market penetration in developing economies will lead to sizable demand in the market.
The report on the augmented reality in retail market covers the following areas:
- Augmented reality in retail market sizing
- Augmented reality in retail market forecast
- Augmented reality in retail market industry analysis
The robust vendor analysis is designed to help clients improve their market position, and in line with this, this report provides a detailed analysis of several leading augmented reality in retail market vendors that include Alphabet Inc., Apple Inc., Elbit Systems Ltd., HP Inc., HTC Corp., Kopin Corp., Lenovo Group Ltd., Lumus Ltd., Magic Leap Inc., Microsoft Corp., NexTech AR Solutions Corp., PTC Inc., Qualcomm Inc., Samsung Electronics Co. Ltd., Sony Group Corp., Toshiba Corp., Upskill, VR Vision Inc., Vuzix Corp., and Zugara Inc.. Also, the augmented reality in retail market analysis report includes information on upcoming trends and challenges that will influence market growth. This is to help companies strategize and leverage all forthcoming growth opportunities.
The study was conducted using an objective combination of primary and secondary information including inputs from key participants in the industry. The report contains a comprehensive market and vendor landscape in addition to an analysis of the key vendors.
The publisher presents a detailed picture of the market by the way of study, synthesis, and summation of data from multiple sources by an analysis of key parameters such as profit, pricing, competition, and promotions. It presents various market facets by identifying the key industry influencers. The data presented is comprehensive, reliable, and a result of extensive research - both primary and secondary. The market research reports provide a complete competitive landscape and an in-depth vendor selection methodology and analysis using qualitative and quantitative research to forecast the accurate market growth.
Table of Contents
1 Executive Summary
- 1.1 Market overview
- Executive Summary - Chart on Market Overview
- Executive Summary - Data Table on Market Overview
- Executive Summary - Chart on Global Market Characteristics
- Executive Summary - Chart on Market By Geographical Landscape
- Executive Summary - Chart on Market Segmentation by Type
- Executive Summary - Chart on Incremental Growth
- Executive Summary - Data Table on Incremental Growth
- Executive Summary - Chart on Company Market Positioning
2 Market Landscape
- 2.1 Market ecosystem
- Parent Market
- Data Table on - Parent Market
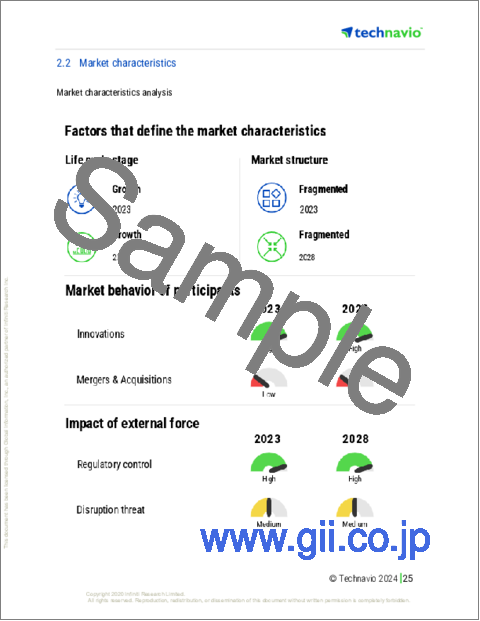
- 2.2 Market characteristics
- Market characteristics analysis
- 2.3 Value chain analysis
- Value Chain Analysis
3 Market Sizing
- 3.1 Market definition
- Offerings of companies included in the market definition
- 3.2 Market segment analysis
- Market segments
- 3.3 Market size 2023
- 3.4 Market outlook: Forecast for 2023-2028
- Chart on Global - Market size and forecast 2023-2028 ($ million)
- Data Table on Global - Market size and forecast 2023-2028 ($ million)
- Chart on Global Market: Year-over-year growth 2023-2028 (%)
- Data Table on Global Market: Year-over-year growth 2023-2028 (%)
4 Historic Market Size
- 4.1 Global Augmented Reality In Retail Market 2018 - 2022
- Historic Market Size - Data Table on Global Augmented Reality In Retail Market 2018 - 2022 ($ million)
- 4.2 Type segment analysis 2018 - 2022
- Historic Market Size - Type Segment 2018 - 2022 ($ million)
- 4.3 Geography segment analysis 2018 - 2022
- Historic Market Size - Geography Segment 2018 - 2022 ($ million)
- 4.4 Country segment analysis 2018 - 2022
- Historic Market Size - Country Segment 2018 - 2022 ($ million)
5 Five Forces Analysis
- 5.1 Five forces summary
- Five forces analysis - Comparison between 2023 and 2028
- 5.2 Bargaining power of buyers
- Bargaining power of buyers - Impact of key factors 2023 and 2028
- 5.3 Bargaining power of suppliers
- Bargaining power of suppliers - Impact of key factors in 2023 and 2028
- 5.4 Threat of new entrants
- Threat of new entrants - Impact of key factors in 2023 and 2028
- 5.5 Threat of substitutes
- Threat of substitutes - Impact of key factors in 2023 and 2028
- 5.6 Threat of rivalry
- Threat of rivalry - Impact of key factors in 2023 and 2028
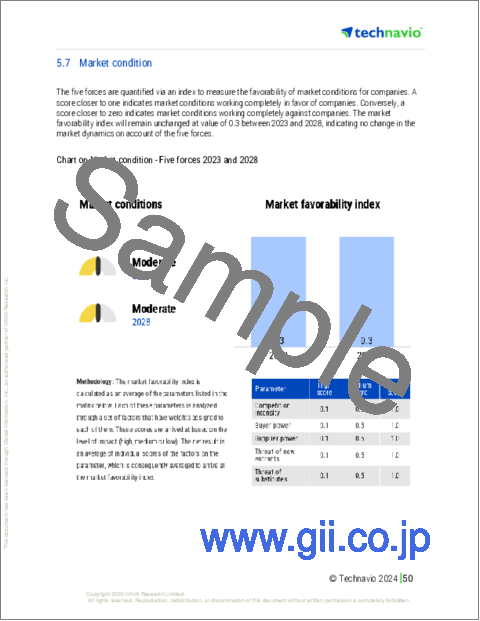
- 5.7 Market condition
- Chart on Market condition - Five forces 2023 and 2028
6 Market Segmentation by Type
- 6.1 Market segments
- Chart on Type - Market share 2023-2028 (%)
- Data Table on Type - Market share 2023-2028 (%)
- 6.2 Comparison by Type
- Chart on Comparison by Type
- Data Table on Comparison by Type
- 6.3 Apparel - Market size and forecast 2023-2028
- Chart on Apparel - Market size and forecast 2023-2028 ($ million)
- Data Table on Apparel - Market size and forecast 2023-2028 ($ million)
- Chart on Apparel - Year-over-year growth 2023-2028 (%)
- Data Table on Apparel - Year-over-year growth 2023-2028 (%)
- 6.4 Furniture lighting and decor - Market size and forecast 2023-2028
- Chart on Furniture lighting and decor - Market size and forecast 2023-2028 ($ million)
- Data Table on Furniture lighting and decor - Market size and forecast 2023-2028 ($ million)
- Chart on Furniture lighting and decor - Year-over-year growth 2023-2028 (%)
- Data Table on Furniture lighting and decor - Year-over-year growth 2023-2028 (%)
- 6.5 Footwear - Market size and forecast 2023-2028
- Chart on Footwear - Market size and forecast 2023-2028 ($ million)
- Data Table on Footwear - Market size and forecast 2023-2028 ($ million)
- Chart on Footwear - Year-over-year growth 2023-2028 (%)
- Data Table on Footwear - Year-over-year growth 2023-2028 (%)
- 6.6 Grocery - Market size and forecast 2023-2028
- Chart on Grocery - Market size and forecast 2023-2028 ($ million)
- Data Table on Grocery - Market size and forecast 2023-2028 ($ million)
- Chart on Grocery - Year-over-year growth 2023-2028 (%)
- Data Table on Grocery - Year-over-year growth 2023-2028 (%)
- 6.7 Others - Market size and forecast 2023-2028
- Chart on Others - Market size and forecast 2023-2028 ($ million)
- Data Table on Others - Market size and forecast 2023-2028 ($ million)
- Chart on Others - Year-over-year growth 2023-2028 (%)
- Data Table on Others - Year-over-year growth 2023-2028 (%)
- 6.8 Market opportunity by Type
- Market opportunity by Type ($ million)
- Data Table on Market opportunity by Type ($ million)
7 Customer Landscape
- 7.1 Customer landscape overview
- Analysis of price sensitivity, lifecycle, customer purchase basket, adoption rates, and purchase criteria
8 Geographic Landscape
- 8.1 Geographic segmentation
- Chart on Market share By Geographical Landscape 2023-2028 (%)
- Data Table on Market share By Geographical Landscape 2023-2028 (%)
- 8.2 Geographic comparison
- Chart on Geographic comparison
- Data Table on Geographic comparison
- 8.3 North America - Market size and forecast 2023-2028
- Chart on North America - Market size and forecast 2023-2028 ($ million)
- Data Table on North America - Market size and forecast 2023-2028 ($ million)
- Chart on North America - Year-over-year growth 2023-2028 (%)
- Data Table on North America - Year-over-year growth 2023-2028 (%)
- 8.4 Europe - Market size and forecast 2023-2028
- Chart on Europe - Market size and forecast 2023-2028 ($ million)
- Data Table on Europe - Market size and forecast 2023-2028 ($ million)
- Chart on Europe - Year-over-year growth 2023-2028 (%)
- Data Table on Europe - Year-over-year growth 2023-2028 (%)
- 8.5 APAC - Market size and forecast 2023-2028
- Chart on APAC - Market size and forecast 2023-2028 ($ million)
- Data Table on APAC - Market size and forecast 2023-2028 ($ million)
- Chart on APAC - Year-over-year growth 2023-2028 (%)
- Data Table on APAC - Year-over-year growth 2023-2028 (%)
- 8.6 South America - Market size and forecast 2023-2028
- Chart on South America - Market size and forecast 2023-2028 ($ million)
- Data Table on South America - Market size and forecast 2023-2028 ($ million)
- Chart on South America - Year-over-year growth 2023-2028 (%)
- Data Table on South America - Year-over-year growth 2023-2028 (%)
- 8.7 Middle East and Africa - Market size and forecast 2023-2028
- Chart on Middle East and Africa - Market size and forecast 2023-2028 ($ million)
- Data Table on Middle East and Africa - Market size and forecast 2023-2028 ($ million)
- Chart on Middle East and Africa - Year-over-year growth 2023-2028 (%)
- Data Table on Middle East and Africa - Year-over-year growth 2023-2028 (%)
- 8.8 US - Market size and forecast 2023-2028
- Chart on US - Market size and forecast 2023-2028 ($ million)
- Data Table on US - Market size and forecast 2023-2028 ($ million)
- Chart on US - Year-over-year growth 2023-2028 (%)
- Data Table on US - Year-over-year growth 2023-2028 (%)
- 8.9 China - Market size and forecast 2023-2028
- Chart on China - Market size and forecast 2023-2028 ($ million)
- Data Table on China - Market size and forecast 2023-2028 ($ million)
- Chart on China - Year-over-year growth 2023-2028 (%)
- Data Table on China - Year-over-year growth 2023-2028 (%)
- 8.10 Germany - Market size and forecast 2023-2028
- Chart on Germany - Market size and forecast 2023-2028 ($ million)
- Data Table on Germany - Market size and forecast 2023-2028 ($ million)
- Chart on Germany - Year-over-year growth 2023-2028 (%)
- Data Table on Germany - Year-over-year growth 2023-2028 (%)
- 8.11 UK - Market size and forecast 2023-2028
- Chart on UK - Market size and forecast 2023-2028 ($ million)
- Data Table on UK - Market size and forecast 2023-2028 ($ million)
- Chart on UK - Year-over-year growth 2023-2028 (%)
- Data Table on UK - Year-over-year growth 2023-2028 (%)
- 8.12 Canada - Market size and forecast 2023-2028
- Chart on Canada - Market size and forecast 2023-2028 ($ million)
- Data Table on Canada - Market size and forecast 2023-2028 ($ million)
- Chart on Canada - Year-over-year growth 2023-2028 (%)
- Data Table on Canada - Year-over-year growth 2023-2028 (%)
- 8.13 Market opportunity By Geographical Landscape
- Market opportunity By Geographical Landscape ($ million)
- Data Tables on Market opportunity By Geographical Landscape ($ million)
9 Drivers, Challenges, and Opportunity/Restraints
- 9.1 Market drivers
- 9.2 Market challenges
- 9.3 Impact of drivers and challenges
- Impact of drivers and challenges in 2023 and 2028
- 9.4 Market opportunities/restraints
10 Competitive Landscape
- 10.1 Overview
- 10.2 Competitive Landscape
- Overview on criticality of inputs and factors of differentiation
- 10.3 Landscape disruption
- Overview on factors of disruption
- 10.4 Industry risks
- Impact of key risks on business
11 Competitive Analysis
- 11.1 Companies profiled
- Companies covered
- 11.2 Market positioning of companies
- Matrix on companies position and classification
- 11.3 Alphabet Inc.
- Alphabet Inc. - Overview
- Alphabet Inc. - Business segments
- Alphabet Inc. - Key offerings
- Alphabet Inc. - Segment focus
- 11.4 Apple Inc.
- Apple Inc. - Overview
- Apple Inc. - Business segments
- Apple Inc. - Key news
- Apple Inc. - Key offerings
- Apple Inc. - Segment focus
- 11.5 HP Inc.
- HP Inc. - Overview
- HP Inc. - Business segments
- HP Inc. - Key news
- HP Inc. - Key offerings
- HP Inc. - Segment focus
- 11.6 HTC Corp.
- HTC Corp. - Overview
- HTC Corp. - Product / Service
- HTC Corp. - Key offerings
- 11.7 Magic Leap Inc.
- Magic Leap Inc. - Overview
- Magic Leap Inc. - Product / Service
- Magic Leap Inc. - Key offerings
- 11.8 Microsoft Corp.
- Microsoft Corp. - Overview
- Microsoft Corp. - Business segments
- Microsoft Corp. - Key news
- Microsoft Corp. - Key offerings
- Microsoft Corp. - Segment focus
- 11.9 Samsung Electronics Co. Ltd.
- Samsung Electronics Co. Ltd. - Overview
- Samsung Electronics Co. Ltd. - Business segments
- Samsung Electronics Co. Ltd. - Key news
- Samsung Electronics Co. Ltd. - Key offerings
- Samsung Electronics Co. Ltd. - Segment focus
- 11.10 Sony Group Corp.
- Sony Group Corp. - Overview
- Sony Group Corp. - Business segments
- Sony Group Corp. - Key news
- Sony Group Corp. - Key offerings
- Sony Group Corp. - Segment focus
- 11.11 Toshiba Corp.
- Toshiba Corp. - Overview
- Toshiba Corp. - Business segments
- Toshiba Corp. - Key news
- Toshiba Corp. - Key offerings
- Toshiba Corp. - Segment focus
- 11.12 VR Vision Inc.
- VR Vision Inc. - Overview
- VR Vision Inc. - Product / Service
- VR Vision Inc. - Key offerings
12 Appendix
- 12.1 Scope of the report
- 12.2 Inclusions and exclusions checklist
- Inclusions checklist
- Exclusions checklist
- 12.3 Currency conversion rates for US$
- Currency conversion rates for US$
- 12.4 Research methodology
- Research methodology
- 12.5 Data procurement
- Information sources
- 12.6 Data validation
- Data validation
- 12.7 Validation techniques employed for market sizing
- Validation techniques employed for market sizing
- 12.8 Data synthesis
- Data synthesis
- 12.9 360 degree market analysis
- 360 degree market analysis
- 12.10 List of abbreviations
- List of abbreviations
- 3D
- AR
- CAGR
- Compound annual growth rate
- CRM
- Customer relationship management
- ERP
- Enterprise resource planning
- FMC
- Fixed-mobile convergence
- GDP
- IT
- RTC
- SMS
- SMEs
- VR

