|
|
市場調査レポート
商品コード
1915290
世界の米粉市場2026-2030年Global Rice Flour Market 2026-2030 |
||||||
|
|||||||
カスタマイズ可能
|
|||||||

| 世界の米粉市場2026-2030年 |
|
出版日: 2026年01月19日
発行: TechNavio
ページ情報: 英文 293 Pages
納期: 即納可能
|

概要
世界の米粉市場は、2025年から2030年の間に3億6,140万米ドルの成長が見込まれ、予測期間中のCAGRは4.1%と予測されています。
本報告書では、世界の米粉市場に関する包括的な分析、市場規模と予測、動向、成長要因、課題に加え、約25社のベンダー分析を提供しております。
本レポートは、現在の市場状況、最新の動向と促進要因、市場環境全般に関する最新の分析を提供します。市場は、グルテンフリーおよびクリーンラベルソリューションへの需要増加、ベーカリーおよび機能性食品産業の拡大、製粉・加工技術革新によって牽引されています。
本調査は、業界の主要関係者からの情報を含む、一次情報と二次情報の客観的な組み合わせを用いて実施されました。本レポートには、主要企業の分析に加え、包括的な市場規模データ、地域別分析を伴うセグメント、ベンダー情勢が含まれています。レポートには過去データと予測データが掲載されています。
| 市場範囲 | |
|---|---|
| 基準年 | 2026年 |
| 終了年 | 2030年 |
| 予測期間 | 2026-2030 |
| 成長モメンタム | 加速 |
| 前年比2026年 | 3.9% |
| CAGR | 4.1% |
| 増分額 | 3億6,140万米ドル |
本調査では、今後数年間における世界の米粉市場成長を牽引する主要要因の一つとして、全粒粉および玄米粉の品種に対する嗜好の高まりを挙げております。また、消費者信頼のための有機認証への重視や、食感改良のための先進的な押出成形法の採用拡大が、市場における相当な需要につながると見込まれます。
目次
第1章 エグゼクティブサマリー
第2章 Technavio分析
- 価格・ライフサイクル・顧客購入バスケット・採用率・購入基準の分析
- インプットの重要性と差別化の要因
- 混乱の要因
- 促進要因と課題の影響
第3章 市場情勢
- 市場エコシステム
- 市場の特徴
- バリューチェーン分析
第4章 市場規模
- 市場の定義
- 市場セグメント分析
- 市場規模 2025
- 市場の見通し 2025-2030
第5章 市場規模実績
- 世界の米粉市場 2020-2024
- 用途別セグメント分析 2020-2024
- タイプセグメント分析 2020-2024
- 原料セグメント分析 2020-2024
- 地域別セグメント分析 2020-2024
- 国別セグメント分析 2020-2024
第6章 定性分析
- AIの影響:世界の米粉市場
第7章 ファイブフォース分析
- ファイブフォースの要約
- 買い手の交渉力
- 供給企業の交渉力
- 新規参入業者の脅威
- 代替品の脅威
- 競争の脅威
- 市況
第8章 市場セグメンテーション:用途別
- 比較:用途別
- ベーカリーおよび菓子類
- 朝食食品
- ベビーフード
- その他
- 市場機会:用途別
第9章 市場セグメンテーション:タイプ別
- 比較:タイプ別
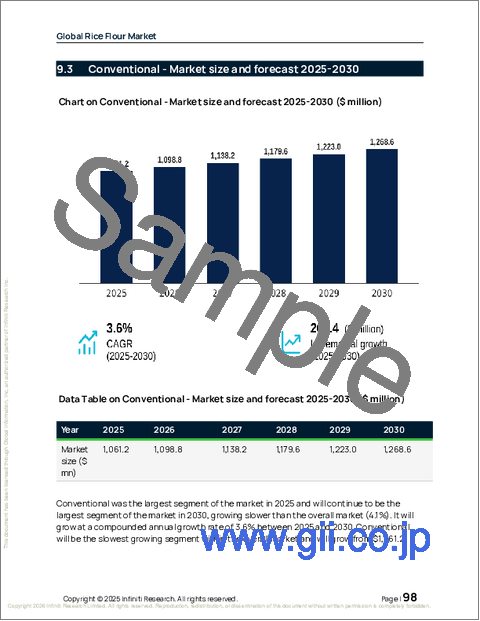
- 従来型
- 有機
- 市場機会:タイプ別
第10章 市場セグメンテーション:ソース別
- 比較:ソース別
- 白米
- 玄米
- 市場機会:ソース別
第11章 顧客情勢
第12章 地域別情勢
- 地域別セグメンテーション
- 地域別比較
- アジア太平洋
- 中国
- インド
- タイ
- ベトナム
- 日本
- インドネシア
- 欧州
- ドイツ
- 英国
- フランス
- イタリア
- スペイン
- オランダ
- 北米
- 米国
- カナダ
- メキシコ
- 南米
- ブラジル
- アルゼンチン
- チリ
- 中東・アフリカ
- トルコ
- 南アフリカ
- サウジアラビア
- エジプト
- アラブ首長国連邦
- 市場機会:地域別
第13章 促進要因・課題・機会
- 市場促進要因
- 市場の課題
- 促進要因と課題の影響
- 市場機会
第14章 競合情勢
- 概要
- 競合情勢
- 混乱の状況
- 業界のリスク
第15章 競合分析
- 企業プロファイル
- 企業ランキング指標
- 企業の市場ポジショニング
- ABF Ingredients
- Archer Daniels Midland Co.
- Ardent Mills LLC
- Aryan International
- Bhagwati Exports
- Bobs Red Mill Natural Foods
- Burapa Prosper Co. Ltd.
- Caremoli SpA
- Ebro foods SA
- General Mills Inc.
- Ingredion Inc.
- Koda Farms Inc.
- Kroner Starke GmbH
- Lieng Tong Rice Vermicilli
- Shipton Mill Ltd.
