|
|
市場調査レポート
商品コード
1515985
半導体組立・検査サービス(SATS)の世界市場 2024-2028Global Semiconductor assembly and testing services (SATS) market 2024-2028 |
||||||
|
|||||||
カスタマイズ可能
|
|||||||


| 半導体組立・検査サービス(SATS)の世界市場 2024-2028 |
|
出版日: 2024年06月12日
発行: TechNavio
ページ情報: 英文 184 Pages
納期: 即納可能
|

全表示
- 概要
- 図表
- 目次
半導体組立・検査サービス(SATS)市場は2023-2028年に193億1,040万米ドル、予測期間中のCAGRは6.59%で成長すると予測されます。
当レポートでは、半導体組立・検査サービス(SATS)市場の全体的な分析、市場規模・予測、動向、成長促進要因、課題、約25のベンダーを網羅したベンダー分析などを掲載しています。
現在の市場シナリオ、最新動向と促進要因、市場環境全体に関する最新分析を提供しています。市場は、IoTデバイスの販売台数の増加、自動車への電子部品の搭載の増加、クラウドコンピューティングデータセンターの採用の増加によって牽引されています。
| 市場範囲 | |
|---|---|
| 基準年 | 2024 |
| 終了年 | 2028 |
| 予測期間 | 2024-2028 |
| 成長モメンタム | 加速 |
| 前年比2024年 | 6.18% |
| CAGR | 6.59% |
| 増分額 | 193億1,040万米ドル |
本調査では、今後数年間の半導体組立・検査サービス(SATS)市場成長を牽引する主要因の1つとして、人工衛星の進歩を挙げています。また、戦略的パートナーシップや買収の増加、ヘルスケアにおけるインターネット対応モバイルデバイスの使用の増加も、市場の大きな需要につながります。
目次
第1章 エグゼクティブサマリー
- 市場概要
第2章 市場情勢
- 市場エコシステム
- 市場の特徴
- バリューチェーン分析
第3章 市場規模の評価
- 市場の定義
- 市場セグメント分析
- 市場規模 2023
- 市場の見通し 2023-2028
第4章 市場規模実績
- 世界半導体組立・検査サービス(SATS)市場 2018-2022
- 用途別セグメント分析 2018-2022
- サービスタイプ別セグメント分析 2018-2022
- 地域別セグメント分析 2018-2022
- 国別セグメント分析 2018-2022
第5章 ファイブフォース分析
- ファイブフォースの要約
- 買い手の交渉力
- 供給企業の交渉力
- 新規参入業者の脅威
- 代替品の脅威
- 競争の脅威
- 市況
第6章 市場セグメンテーション:用途別
- 市場セグメンテーション
- 比較:用途別
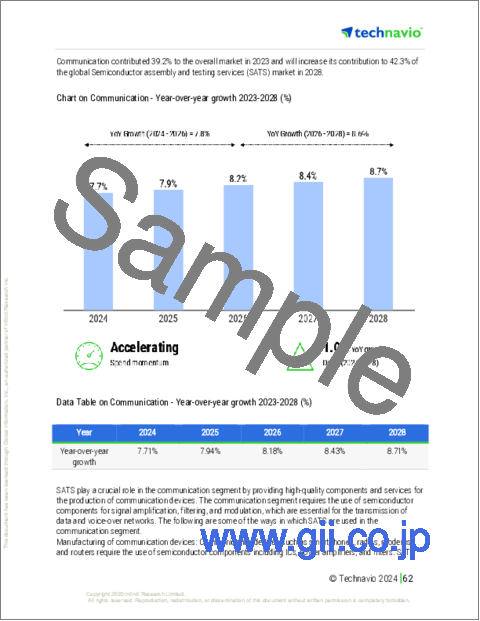
- 通信:市場規模と予測 2023-2028
- コンピューティングとネットワーク:市場規模と予測 2023-2028
- 産業:市場規模と予測 2023-2028
- 家電:市場規模と予測 2023-2028
- 自動車用電子機器:市場規模と予測 2023-2028
- 市場機会:用途別
第7章 市場セグメンテーション:サービスタイプ別
- 市場セグメンテーション
- 比較:サービスタイプ別
- 組立サービス:市場規模と予測 2023-2028
- 検査サービス:市場規模と予測 2023-2028
- 市場機会:サービスタイプ別
第8章 顧客情勢
- 顧客情勢の概要
第9章 地域別情勢
- 地域別セグメンテーション
- 地域別比較
- アジア太平洋:市場規模と予測 2023-2028
- 北米:市場規模と予測 2023-2028
- 欧州:市場規模と予測 2023-2028
- 南米:市場規模と予測 2023-2028
- 中東・アフリカ:市場規模と予測 2023-2028
- 韓国:市場規模と予測 2023-2028
- 台湾:市場規模と予測 2023-2028
- 中国:市場規模と予測 2023-2028
- 米国:市場規模と予測 2023-2028
- 日本:市場規模と予測 2023-2028
- 市場機会:地域情勢別
第10章 促進要因・課題・機会・抑制要因
- 市場促進要因
- 市場の課題
- 促進要因と課題の影響
- 市場の機会・抑制要因
第11章 競合情勢
- 概要
- 競合情勢
- 混乱の状況
- 業界のリスク
第12章 競合分析
- 企業プロファイル
- 企業の市場ポジショニング
- Amkor Technology Inc.
- Aptasic SA
- ASE Technology Holding Co. Ltd.
- ChipMOS TECHNOLOGIES INC.
- Flexitallic Group
- Formosa Advanced Technologies Co. Ltd.
- GlobalFoundaries Inc.
- Jiangsu Changdian Technology Co. Ltd.
- King Yuan Electronics Co. Ltd.
- Koninklijke Philips N.V.
- Powertech Technology Inc.
- Teledyne Technologies Inc.
- Tianshui Huatian Technology Co. Ltd.
- UTAC Holdings Ltd.
- Walton Advanced Engineering Inc.
第13章 付録
Exhibits:
- Exhibits1: Executive Summary - Chart on Market Overview
- Exhibits2: Executive Summary - Data Table on Market Overview
- Exhibits3: Executive Summary - Chart on Global Market Characteristics
- Exhibits4: Executive Summary - Chart on Market By Geographical Landscape
- Exhibits5: Executive Summary - Chart on Market Segmentation by Application
- Exhibits6: Executive Summary - Chart on Market Segmentation by Service Type
- Exhibits7: Executive Summary - Chart on Incremental Growth
- Exhibits8: Executive Summary - Data Table on Incremental Growth
- Exhibits9: Executive Summary - Chart on Company Market Positioning
- Exhibits10: Parent Market
- Exhibits11: Data Table on - Parent Market
- Exhibits12: Market characteristics analysis
- Exhibits13: Value Chain Analysis
- Exhibits14: Offerings of companies included in the market definition
- Exhibits15: Market segments
- Exhibits16: Chart on Global - Market size and forecast 2023-2028 ($ million)
- Exhibits17: Data Table on Global - Market size and forecast 2023-2028 ($ million)
- Exhibits18: Chart on Global Market: Year-over-year growth 2023-2028 (%)
- Exhibits19: Data Table on Global Market: Year-over-year growth 2023-2028 (%)
- Exhibits20: Historic Market Size - Data Table on Global Semiconductor Assembly And Testing Services (SATS) Market 2018 - 2022 ($ million)
- Exhibits21: Historic Market Size - Application Segment 2018 - 2022 ($ million)
- Exhibits22: Historic Market Size - Service Type Segment 2018 - 2022 ($ million)
- Exhibits23: Historic Market Size - Geography Segment 2018 - 2022 ($ million)
- Exhibits24: Historic Market Size - Country Segment 2018 - 2022 ($ million)
- Exhibits25: Five forces analysis - Comparison between 2023 and 2028
- Exhibits26: Bargaining power of buyers - Impact of key factors 2023 and 2028
- Exhibits27: Bargaining power of suppliers - Impact of key factors in 2023 and 2028
- Exhibits28: Threat of new entrants - Impact of key factors in 2023 and 2028
- Exhibits29: Threat of substitutes - Impact of key factors in 2023 and 2028
- Exhibits30: Threat of rivalry - Impact of key factors in 2023 and 2028
- Exhibits31: Chart on Market condition - Five forces 2023 and 2028
- Exhibits32: Chart on Application - Market share 2023-2028 (%)
- Exhibits33: Data Table on Application - Market share 2023-2028 (%)
- Exhibits34: Chart on Comparison by Application
- Exhibits35: Data Table on Comparison by Application
- Exhibits36: Chart on Communication - Market size and forecast 2023-2028 ($ million)
- Exhibits37: Data Table on Communication - Market size and forecast 2023-2028 ($ million)
- Exhibits38: Chart on Communication - Year-over-year growth 2023-2028 (%)
- Exhibits39: Data Table on Communication - Year-over-year growth 2023-2028 (%)
- Exhibits40: Chart on Computing and networking - Market size and forecast 2023-2028 ($ million)
- Exhibits41: Data Table on Computing and networking - Market size and forecast 2023-2028 ($ million)
- Exhibits42: Chart on Computing and networking - Year-over-year growth 2023-2028 (%)
- Exhibits43: Data Table on Computing and networking - Year-over-year growth 2023-2028 (%)
- Exhibits44: Chart on Industrial - Market size and forecast 2023-2028 ($ million)
- Exhibits45: Data Table on Industrial - Market size and forecast 2023-2028 ($ million)
- Exhibits46: Chart on Industrial - Year-over-year growth 2023-2028 (%)
- Exhibits47: Data Table on Industrial - Year-over-year growth 2023-2028 (%)
- Exhibits48: Chart on Consumer electronics - Market size and forecast 2023-2028 ($ million)
- Exhibits49: Data Table on Consumer electronics - Market size and forecast 2023-2028 ($ million)
- Exhibits50: Chart on Consumer electronics - Year-over-year growth 2023-2028 (%)
- Exhibits51: Data Table on Consumer electronics - Year-over-year growth 2023-2028 (%)
- Exhibits52: Chart on Automotive electronics - Market size and forecast 2023-2028 ($ million)
- Exhibits53: Data Table on Automotive electronics - Market size and forecast 2023-2028 ($ million)
- Exhibits54: Chart on Automotive electronics - Year-over-year growth 2023-2028 (%)
- Exhibits55: Data Table on Automotive electronics - Year-over-year growth 2023-2028 (%)
- Exhibits56: Market opportunity by Application ($ million)
- Exhibits57: Data Table on Market opportunity by Application ($ million)
- Exhibits58: Chart on Service Type - Market share 2023-2028 (%)
- Exhibits59: Data Table on Service Type - Market share 2023-2028 (%)
- Exhibits60: Chart on Comparison by Service Type
- Exhibits61: Data Table on Comparison by Service Type
- Exhibits62: Chart on Assembly services - Market size and forecast 2023-2028 ($ million)
- Exhibits63: Data Table on Assembly services - Market size and forecast 2023-2028 ($ million)
- Exhibits64: Chart on Assembly services - Year-over-year growth 2023-2028 (%)
- Exhibits65: Data Table on Assembly services - Year-over-year growth 2023-2028 (%)
- Exhibits66: Chart on Testing services - Market size and forecast 2023-2028 ($ million)
- Exhibits67: Data Table on Testing services - Market size and forecast 2023-2028 ($ million)
- Exhibits68: Chart on Testing services - Year-over-year growth 2023-2028 (%)
- Exhibits69: Data Table on Testing services - Year-over-year growth 2023-2028 (%)
- Exhibits70: Market opportunity by Service Type ($ million)
- Exhibits71: Data Table on Market opportunity by Service Type ($ million)
- Exhibits72: Analysis of price sensitivity, lifecycle, customer purchase basket, adoption rates, and purchase criteria
- Exhibits73: Chart on Market share By Geographical Landscape 2023-2028 (%)
- Exhibits74: Data Table on Market share By Geographical Landscape 2023-2028 (%)
- Exhibits75: Chart on Geographic comparison
- Exhibits76: Data Table on Geographic comparison
- Exhibits77: Chart on APAC - Market size and forecast 2023-2028 ($ million)
- Exhibits78: Data Table on APAC - Market size and forecast 2023-2028 ($ million)
- Exhibits79: Chart on APAC - Year-over-year growth 2023-2028 (%)
- Exhibits80: Data Table on APAC - Year-over-year growth 2023-2028 (%)
- Exhibits81: Chart on North America - Market size and forecast 2023-2028 ($ million)
- Exhibits82: Data Table on North America - Market size and forecast 2023-2028 ($ million)
- Exhibits83: Chart on North America - Year-over-year growth 2023-2028 (%)
- Exhibits84: Data Table on North America - Year-over-year growth 2023-2028 (%)
- Exhibits85: Chart on Europe - Market size and forecast 2023-2028 ($ million)
- Exhibits86: Data Table on Europe - Market size and forecast 2023-2028 ($ million)
- Exhibits87: Chart on Europe - Year-over-year growth 2023-2028 (%)
- Exhibits88: Data Table on Europe - Year-over-year growth 2023-2028 (%)
- Exhibits89: Chart on South America - Market size and forecast 2023-2028 ($ million)
- Exhibits90: Data Table on South America - Market size and forecast 2023-2028 ($ million)
- Exhibits91: Chart on South America - Year-over-year growth 2023-2028 (%)
- Exhibits92: Data Table on South America - Year-over-year growth 2023-2028 (%)
- Exhibits93: Chart on Middle East and Africa - Market size and forecast 2023-2028 ($ million)
- Exhibits94: Data Table on Middle East and Africa - Market size and forecast 2023-2028 ($ million)
- Exhibits95: Chart on Middle East and Africa - Year-over-year growth 2023-2028 (%)
- Exhibits96: Data Table on Middle East and Africa - Year-over-year growth 2023-2028 (%)
- Exhibits97: Chart on South Korea - Market size and forecast 2023-2028 ($ million)
- Exhibits98: Data Table on South Korea - Market size and forecast 2023-2028 ($ million)
- Exhibits99: Chart on South Korea - Year-over-year growth 2023-2028 (%)
- Exhibits100: Data Table on South Korea - Year-over-year growth 2023-2028 (%)
- Exhibits101: Chart on Taiwan - Market size and forecast 2023-2028 ($ million)
- Exhibits102: Data Table on Taiwan - Market size and forecast 2023-2028 ($ million)
- Exhibits103: Chart on Taiwan - Year-over-year growth 2023-2028 (%)
- Exhibits104: Data Table on Taiwan - Year-over-year growth 2023-2028 (%)
- Exhibits105: Chart on China - Market size and forecast 2023-2028 ($ million)
- Exhibits106: Data Table on China - Market size and forecast 2023-2028 ($ million)
- Exhibits107: Chart on China - Year-over-year growth 2023-2028 (%)
- Exhibits108: Data Table on China - Year-over-year growth 2023-2028 (%)
- Exhibits109: Chart on US - Market size and forecast 2023-2028 ($ million)
- Exhibits110: Data Table on US - Market size and forecast 2023-2028 ($ million)
- Exhibits111: Chart on US - Year-over-year growth 2023-2028 (%)
- Exhibits112: Data Table on US - Year-over-year growth 2023-2028 (%)
- Exhibits113: Chart on Japan - Market size and forecast 2023-2028 ($ million)
- Exhibits114: Data Table on Japan - Market size and forecast 2023-2028 ($ million)
- Exhibits115: Chart on Japan - Year-over-year growth 2023-2028 (%)
- Exhibits116: Data Table on Japan - Year-over-year growth 2023-2028 (%)
- Exhibits117: Market opportunity By Geographical Landscape ($ million)
- Exhibits118: Data Tables on Market opportunity By Geographical Landscape ($ million)
- Exhibits119: Impact of drivers and challenges in 2023 and 2028
- Exhibits120: Overview on criticality of inputs and factors of differentiation
- Exhibits121: Overview on factors of disruption
- Exhibits122: Impact of key risks on business
- Exhibits123: Companies covered
- Exhibits124: Matrix on companies position and classification
- Exhibits125: Amkor Technology Inc. - Overview
- Exhibits126: Amkor Technology Inc. - Business segments
- Exhibits127: Amkor Technology Inc. - Key news
- Exhibits128: Amkor Technology Inc. - Key offerings
- Exhibits129: Amkor Technology Inc. - Segment focus
- Exhibits130: Aptasic SA - Overview
- Exhibits131: Aptasic SA - Product / Service
- Exhibits132: Aptasic SA - Key offerings
- Exhibits133: ASE Technology Holding Co. Ltd. - Overview
- Exhibits134: ASE Technology Holding Co. Ltd. - Business segments
- Exhibits135: ASE Technology Holding Co. Ltd. - Key offerings
- Exhibits136: ASE Technology Holding Co. Ltd. - Segment focus
- Exhibits137: ChipMOS TECHNOLOGIES INC. - Overview
- Exhibits138: ChipMOS TECHNOLOGIES INC. - Business segments
- Exhibits139: ChipMOS TECHNOLOGIES INC. - Key offerings
- Exhibits140: ChipMOS TECHNOLOGIES INC. - Segment focus
- Exhibits141: Flexitallic Group - Overview
- Exhibits142: Flexitallic Group - Product / Service
- Exhibits143: Flexitallic Group - Key offerings
- Exhibits144: Formosa Advanced Technologies Co. Ltd. - Overview
- Exhibits145: Formosa Advanced Technologies Co. Ltd. - Product / Service
- Exhibits146: Formosa Advanced Technologies Co. Ltd. - Key offerings
- Exhibits147: GlobalFoundaries Inc. - Overview
- Exhibits148: GlobalFoundaries Inc. - Product / Service
- Exhibits149: GlobalFoundaries Inc. - Key news
- Exhibits150: GlobalFoundaries Inc. - Key offerings
- Exhibits151: Jiangsu Changdian Technology Co. Ltd. - Overview
- Exhibits152: Jiangsu Changdian Technology Co. Ltd. - Product / Service
- Exhibits153: Jiangsu Changdian Technology Co. Ltd. - Key offerings
- Exhibits154: King Yuan Electronics Co. Ltd. - Overview
- Exhibits155: King Yuan Electronics Co. Ltd. - Product / Service
- Exhibits156: King Yuan Electronics Co. Ltd. - Key offerings
- Exhibits157: Koninklijke Philips N.V. - Overview
- Exhibits158: Koninklijke Philips N.V. - Business segments
- Exhibits159: Koninklijke Philips N.V. - Key news
- Exhibits160: Koninklijke Philips N.V. - Key offerings
- Exhibits161: Koninklijke Philips N.V. - Segment focus
- Exhibits162: Powertech Technology Inc. - Overview
- Exhibits163: Powertech Technology Inc. - Business segments
- Exhibits164: Powertech Technology Inc. - Key offerings
- Exhibits165: Powertech Technology Inc. - Segment focus
- Exhibits166: Teledyne Technologies Inc. - Overview
- Exhibits167: Teledyne Technologies Inc. - Business segments
- Exhibits168: Teledyne Technologies Inc. - Key news
- Exhibits169: Teledyne Technologies Inc. - Key offerings
- Exhibits170: Teledyne Technologies Inc. - Segment focus
- Exhibits171: Tianshui Huatian Technology Co. Ltd. - Overview
- Exhibits172: Tianshui Huatian Technology Co. Ltd. - Product / Service
- Exhibits173: Tianshui Huatian Technology Co. Ltd. - Key offerings
- Exhibits174: UTAC Holdings Ltd. - Overview
- Exhibits175: UTAC Holdings Ltd. - Product / Service
- Exhibits176: UTAC Holdings Ltd. - Key offerings
- Exhibits177: Walton Advanced Engineering Inc. - Overview
- Exhibits178: Walton Advanced Engineering Inc. - Product / Service
- Exhibits179: Walton Advanced Engineering Inc. - Key offerings
- Exhibits180: Inclusions checklist
- Exhibits181: Exclusions checklist
- Exhibits182: Currency conversion rates for US$
- Exhibits183: Research methodology
- Exhibits184: Information sources
- Exhibits185: Data validation
- Exhibits186: Validation techniques employed for market sizing
- Exhibits187: Data synthesis
- Exhibits188: 360 degree market analysis
- Exhibits189: List of abbreviations
The semiconductor assembly and testing services (SATS) market is forecasted to grow by USD 19310.4 mn during 2023-2028, accelerating at a CAGR of 6.59% during the forecast period. The report on the semiconductor assembly and testing services (sats) market provides a holistic analysis, market size and forecast, trends, growth drivers, and challenges, as well as vendor analysis covering around 25 vendors.
The report offers an up-to-date analysis regarding the current market scenario, the latest trends and drivers, and the overall market environment. The market is driven by rising sales of IoT devices, increasing incorporation of electronic parts in vehicles, and rising adoption of cloud computing data centers.
Technavio's semiconductor assembly and testing services (SATS) market is segmented as below:
| Market Scope | |
|---|---|
| Base Year | 2024 |
| End Year | 2028 |
| Series Year | 2024-2028 |
| Growth Momentum | Accelerate |
| YOY 2024 | 6.18% |
| CAGR | 6.59% |
| Incremental Value | $19310.4mn |
By Application
- Communication
- Computing and networking
- Industrial
- Consumer electronics
- Automotive electronics
By Service Type
- Assembly services
- Testing services
By Geographical Landscape
- APAC
- North America
- Europe
- South America
- Middle East and Africa
This study identifies the advances in sats as one of the prime reasons driving the semiconductor assembly and testing services (SATS) market growth during the next few years. Also, increasing number of strategic partnerships and acquisitions and increasing use of internet-enabled mobile devices in healthcare it will lead to sizable demand in the market.
The report on the semiconductor assembly and testing services (SATS) market covers the following areas:
- Semiconductor assembly and testing services (SATS) market sizing
- Semiconductor assembly and testing services (SATS) market forecast
- Semiconductor assembly and testing services (SATS) market industry analysis
The robust vendor analysis is designed to help clients improve their market position, and in line with this, this report provides a detailed analysis of several leading semiconductor assembly and testing services (sats) market vendors that include Amkor Technology Inc., Aptasic SA, ASE Technology Holding Co. Ltd., ChipMOS TECHNOLOGIES INC., DPA Components International, Flexitallic Group, Formosa Advanced Technologies Co. Ltd., GlobalFoundaries Inc., Jiangsu Changdian Technology Co. Ltd., King Yuan Electronics Co. Ltd., Koninklijke Philips N.V., Micross Inc., Ose Corp., Powertech Technology Inc., Rochester Electronics LLC, Teledyne Technologies Inc., Tianshui Huatian Technology Co. Ltd., Unisem M Berhad, UTAC Holdings Ltd., and Walton Advanced Engineering Inc.. Also, the semiconductor assembly and testing services (SATS) market analysis report includes information on upcoming trends and challenges that will influence market growth. This is to help companies strategize and leverage all forthcoming growth opportunities.
The study was conducted using an objective combination of primary and secondary information including inputs from key participants in the industry. The report contains a comprehensive market and vendor landscape in addition to an analysis of the key vendors.
The publisher presents a detailed picture of the market by the way of study, synthesis, and summation of data from multiple sources by an analysis of key parameters such as profit, pricing, competition, and promotions. It presents various market facets by identifying the key industry influencers. The data presented is comprehensive, reliable, and a result of extensive research - both primary and secondary. The market research reports provide a complete competitive landscape and an in-depth vendor selection methodology and analysis using qualitative and quantitative research to forecast the accurate market growth.
Table of Contents
1 Executive Summary
- 1.1 Market overview
- Executive Summary - Chart on Market Overview
- Executive Summary - Data Table on Market Overview
- Executive Summary - Chart on Global Market Characteristics
- Executive Summary - Chart on Market By Geographical Landscape
- Executive Summary - Chart on Market Segmentation by Application
- Executive Summary - Chart on Market Segmentation by Service Type
- Executive Summary - Chart on Incremental Growth
- Executive Summary - Data Table on Incremental Growth
- Executive Summary - Chart on Company Market Positioning
2 Market Landscape
- 2.1 Market ecosystem
- Parent Market
- Data Table on - Parent Market
- 2.2 Market characteristics
- Market characteristics analysis
- 2.3 Value chain analysis
- Value Chain Analysis
3 Market Sizing
- 3.1 Market definition
- Offerings of companies included in the market definition
- 3.2 Market segment analysis
- Market segments
- 3.3 Market size 2023
- 3.4 Market outlook: Forecast for 2023-2028
- Chart on Global - Market size and forecast 2023-2028 ($ million)
- Data Table on Global - Market size and forecast 2023-2028 ($ million)
- Chart on Global Market: Year-over-year growth 2023-2028 (%)
- Data Table on Global Market: Year-over-year growth 2023-2028 (%)
4 Historic Market Size
- 4.1 Global Semiconductor Assembly And Testing Services (SATS) Market 2018 - 2022
- Historic Market Size - Data Table on Global Semiconductor Assembly And Testing Services (SATS) Market 2018 - 2022 ($ million)
- 4.2 Application segment analysis 2018 - 2022
- Historic Market Size - Application Segment 2018 - 2022 ($ million)
- 4.3 Service Type segment analysis 2018 - 2022
- Historic Market Size - Service Type Segment 2018 - 2022 ($ million)
- 4.4 Geography segment analysis 2018 - 2022
- Historic Market Size - Geography Segment 2018 - 2022 ($ million)
- 4.5 Country segment analysis 2018 - 2022
- Historic Market Size - Country Segment 2018 - 2022 ($ million)
5 Five Forces Analysis
- 5.1 Five forces summary
- Five forces analysis - Comparison between 2023 and 2028
- 5.2 Bargaining power of buyers
- Bargaining power of buyers - Impact of key factors 2023 and 2028
- 5.3 Bargaining power of suppliers
- Bargaining power of suppliers - Impact of key factors in 2023 and 2028
- 5.4 Threat of new entrants
- Threat of new entrants - Impact of key factors in 2023 and 2028
- 5.5 Threat of substitutes
- Threat of substitutes - Impact of key factors in 2023 and 2028
- 5.6 Threat of rivalry
- Threat of rivalry - Impact of key factors in 2023 and 2028
- 5.7 Market condition
- Chart on Market condition - Five forces 2023 and 2028
6 Market Segmentation by Application
- 6.1 Market segments
- Chart on Application - Market share 2023-2028 (%)
- Data Table on Application - Market share 2023-2028 (%)
- 6.2 Comparison by Application
- Chart on Comparison by Application
- Data Table on Comparison by Application
- 6.3 Communication - Market size and forecast 2023-2028
- Chart on Communication - Market size and forecast 2023-2028 ($ million)
- Data Table on Communication - Market size and forecast 2023-2028 ($ million)
- Chart on Communication - Year-over-year growth 2023-2028 (%)
- Data Table on Communication - Year-over-year growth 2023-2028 (%)
- 6.4 Computing and networking - Market size and forecast 2023-2028
- Chart on Computing and networking - Market size and forecast 2023-2028 ($ million)
- Data Table on Computing and networking - Market size and forecast 2023-2028 ($ million)
- Chart on Computing and networking - Year-over-year growth 2023-2028 (%)
- Data Table on Computing and networking - Year-over-year growth 2023-2028 (%)
- 6.5 Industrial - Market size and forecast 2023-2028
- Chart on Industrial - Market size and forecast 2023-2028 ($ million)
- Data Table on Industrial - Market size and forecast 2023-2028 ($ million)
- Chart on Industrial - Year-over-year growth 2023-2028 (%)
- Data Table on Industrial - Year-over-year growth 2023-2028 (%)
- 6.6 Consumer electronics - Market size and forecast 2023-2028
- Chart on Consumer electronics - Market size and forecast 2023-2028 ($ million)
- Data Table on Consumer electronics - Market size and forecast 2023-2028 ($ million)
- Chart on Consumer electronics - Year-over-year growth 2023-2028 (%)
- Data Table on Consumer electronics - Year-over-year growth 2023-2028 (%)
- 6.7 Automotive electronics - Market size and forecast 2023-2028
- Chart on Automotive electronics - Market size and forecast 2023-2028 ($ million)
- Data Table on Automotive electronics - Market size and forecast 2023-2028 ($ million)
- Chart on Automotive electronics - Year-over-year growth 2023-2028 (%)
- Data Table on Automotive electronics - Year-over-year growth 2023-2028 (%)
- 6.8 Market opportunity by Application
- Market opportunity by Application ($ million)
- Data Table on Market opportunity by Application ($ million)
7 Market Segmentation by Service Type
- 7.1 Market segments
- Chart on Service Type - Market share 2023-2028 (%)
- Data Table on Service Type - Market share 2023-2028 (%)
- 7.2 Comparison by Service Type
- Chart on Comparison by Service Type
- Data Table on Comparison by Service Type
- 7.3 Assembly services - Market size and forecast 2023-2028
- Chart on Assembly services - Market size and forecast 2023-2028 ($ million)
- Data Table on Assembly services - Market size and forecast 2023-2028 ($ million)
- Chart on Assembly services - Year-over-year growth 2023-2028 (%)
- Data Table on Assembly services - Year-over-year growth 2023-2028 (%)
- 7.4 Testing services - Market size and forecast 2023-2028
- Chart on Testing services - Market size and forecast 2023-2028 ($ million)
- Data Table on Testing services - Market size and forecast 2023-2028 ($ million)
- Chart on Testing services - Year-over-year growth 2023-2028 (%)
- Data Table on Testing services - Year-over-year growth 2023-2028 (%)
- 7.5 Market opportunity by Service Type
- Market opportunity by Service Type ($ million)
- Data Table on Market opportunity by Service Type ($ million)
8 Customer Landscape
- 8.1 Customer landscape overview
- Analysis of price sensitivity, lifecycle, customer purchase basket, adoption rates, and purchase criteria
9 Geographic Landscape
- 9.1 Geographic segmentation
- Chart on Market share By Geographical Landscape 2023-2028 (%)
- Data Table on Market share By Geographical Landscape 2023-2028 (%)
- 9.2 Geographic comparison
- Chart on Geographic comparison
- Data Table on Geographic comparison
- 9.3 APAC - Market size and forecast 2023-2028
- Chart on APAC - Market size and forecast 2023-2028 ($ million)
- Data Table on APAC - Market size and forecast 2023-2028 ($ million)
- Chart on APAC - Year-over-year growth 2023-2028 (%)
- Data Table on APAC - Year-over-year growth 2023-2028 (%)
- 9.4 North America - Market size and forecast 2023-2028
- Chart on North America - Market size and forecast 2023-2028 ($ million)
- Data Table on North America - Market size and forecast 2023-2028 ($ million)
- Chart on North America - Year-over-year growth 2023-2028 (%)
- Data Table on North America - Year-over-year growth 2023-2028 (%)
- 9.5 Europe - Market size and forecast 2023-2028
- Chart on Europe - Market size and forecast 2023-2028 ($ million)
- Data Table on Europe - Market size and forecast 2023-2028 ($ million)
- Chart on Europe - Year-over-year growth 2023-2028 (%)
- Data Table on Europe - Year-over-year growth 2023-2028 (%)
- 9.6 South America - Market size and forecast 2023-2028
- Chart on South America - Market size and forecast 2023-2028 ($ million)
- Data Table on South America - Market size and forecast 2023-2028 ($ million)
- Chart on South America - Year-over-year growth 2023-2028 (%)
- Data Table on South America - Year-over-year growth 2023-2028 (%)
- 9.7 Middle East and Africa - Market size and forecast 2023-2028
- Chart on Middle East and Africa - Market size and forecast 2023-2028 ($ million)
- Data Table on Middle East and Africa - Market size and forecast 2023-2028 ($ million)
- Chart on Middle East and Africa - Year-over-year growth 2023-2028 (%)
- Data Table on Middle East and Africa - Year-over-year growth 2023-2028 (%)
- 9.8 South Korea - Market size and forecast 2023-2028
- Chart on South Korea - Market size and forecast 2023-2028 ($ million)
- Data Table on South Korea - Market size and forecast 2023-2028 ($ million)
- Chart on South Korea - Year-over-year growth 2023-2028 (%)
- Data Table on South Korea - Year-over-year growth 2023-2028 (%)
- 9.9 Taiwan - Market size and forecast 2023-2028
- Chart on Taiwan - Market size and forecast 2023-2028 ($ million)
- Data Table on Taiwan - Market size and forecast 2023-2028 ($ million)
- Chart on Taiwan - Year-over-year growth 2023-2028 (%)
- Data Table on Taiwan - Year-over-year growth 2023-2028 (%)
- 9.10 China - Market size and forecast 2023-2028
- Chart on China - Market size and forecast 2023-2028 ($ million)
- Data Table on China - Market size and forecast 2023-2028 ($ million)
- Chart on China - Year-over-year growth 2023-2028 (%)
- Data Table on China - Year-over-year growth 2023-2028 (%)
- 9.11 US - Market size and forecast 2023-2028
- Chart on US - Market size and forecast 2023-2028 ($ million)
- Data Table on US - Market size and forecast 2023-2028 ($ million)
- Chart on US - Year-over-year growth 2023-2028 (%)
- Data Table on US - Year-over-year growth 2023-2028 (%)
- 9.12 Japan - Market size and forecast 2023-2028
- Chart on Japan - Market size and forecast 2023-2028 ($ million)
- Data Table on Japan - Market size and forecast 2023-2028 ($ million)
- Chart on Japan - Year-over-year growth 2023-2028 (%)
- Data Table on Japan - Year-over-year growth 2023-2028 (%)
- 9.13 Market opportunity By Geographical Landscape
- Market opportunity By Geographical Landscape ($ million)
- Data Tables on Market opportunity By Geographical Landscape ($ million)
10 Drivers, Challenges, and Opportunity/Restraints
- 10.1 Market drivers
- 10.2 Market challenges
- 10.3 Impact of drivers and challenges
- Impact of drivers and challenges in 2023 and 2028
- 10.4 Market opportunities/restraints
11 Competitive Landscape
- 11.1 Overview
- 11.2 Competitive Landscape
- Overview on criticality of inputs and factors of differentiation
- 11.3 Landscape disruption
- Overview on factors of disruption
- 11.4 Industry risks
- Impact of key risks on business
12 Competitive Analysis
- 12.1 Companies profiled
- Companies covered
- 12.2 Market positioning of companies
- Matrix on companies position and classification
- 12.3 Amkor Technology Inc.
- Amkor Technology Inc. - Overview
- Amkor Technology Inc. - Business segments
- Amkor Technology Inc. - Key news
- Amkor Technology Inc. - Key offerings
- Amkor Technology Inc. - Segment focus
- 12.4 Aptasic SA
- Aptasic SA - Overview
- Aptasic SA - Product / Service
- Aptasic SA - Key offerings
- 12.5 ASE Technology Holding Co. Ltd.
- ASE Technology Holding Co. Ltd. - Overview
- ASE Technology Holding Co. Ltd. - Business segments
- ASE Technology Holding Co. Ltd. - Key offerings
- ASE Technology Holding Co. Ltd. - Segment focus
- 12.6 ChipMOS TECHNOLOGIES INC.
- ChipMOS TECHNOLOGIES INC. - Overview
- ChipMOS TECHNOLOGIES INC. - Business segments
- ChipMOS TECHNOLOGIES INC. - Key offerings
- ChipMOS TECHNOLOGIES INC. - Segment focus
- 12.7 Flexitallic Group
- Flexitallic Group - Overview
- Flexitallic Group - Product / Service
- Flexitallic Group - Key offerings
- 12.8 Formosa Advanced Technologies Co. Ltd.
- Formosa Advanced Technologies Co. Ltd. - Overview
- Formosa Advanced Technologies Co. Ltd. - Product / Service
- Formosa Advanced Technologies Co. Ltd. - Key offerings
- 12.9 GlobalFoundaries Inc.
- GlobalFoundaries Inc. - Overview
- GlobalFoundaries Inc. - Product / Service
- GlobalFoundaries Inc. - Key news
- GlobalFoundaries Inc. - Key offerings
- 12.10 Jiangsu Changdian Technology Co. Ltd.
- Jiangsu Changdian Technology Co. Ltd. - Overview
- Jiangsu Changdian Technology Co. Ltd. - Product / Service
- Jiangsu Changdian Technology Co. Ltd. - Key offerings
- 12.11 King Yuan Electronics Co. Ltd.
- King Yuan Electronics Co. Ltd. - Overview
- King Yuan Electronics Co. Ltd. - Product / Service
- King Yuan Electronics Co. Ltd. - Key offerings
- 12.12 Koninklijke Philips N.V.
- Koninklijke Philips N.V. - Overview
- Koninklijke Philips N.V. - Business segments
- Koninklijke Philips N.V. - Key news
- Koninklijke Philips N.V. - Key offerings
- Koninklijke Philips N.V. - Segment focus
- 12.13 Powertech Technology Inc.
- Powertech Technology Inc. - Overview
- Powertech Technology Inc. - Business segments
- Powertech Technology Inc. - Key offerings
- Powertech Technology Inc. - Segment focus
- 12.14 Teledyne Technologies Inc.
- Teledyne Technologies Inc. - Overview
- Teledyne Technologies Inc. - Business segments
- Teledyne Technologies Inc. - Key news
- Teledyne Technologies Inc. - Key offerings
- Teledyne Technologies Inc. - Segment focus
- 12.15 Tianshui Huatian Technology Co. Ltd.
- Tianshui Huatian Technology Co. Ltd. - Overview
- Tianshui Huatian Technology Co. Ltd. - Product / Service
- Tianshui Huatian Technology Co. Ltd. - Key offerings
- 12.16 UTAC Holdings Ltd.
- UTAC Holdings Ltd. - Overview
- UTAC Holdings Ltd. - Product / Service
- UTAC Holdings Ltd. - Key offerings
- 12.17 Walton Advanced Engineering Inc.
- Walton Advanced Engineering Inc. - Overview
- Walton Advanced Engineering Inc. - Product / Service
- Walton Advanced Engineering Inc. - Key offerings
13 Appendix
- 13.1 Scope of the report
- 13.2 Inclusions and exclusions checklist
- Inclusions checklist
- Exclusions checklist
- 13.3 Currency conversion rates for US$
- Currency conversion rates for US$
- 13.4 Research methodology
- Research methodology
- 13.5 Data procurement
- Information sources
- 13.6 Data validation
- Data validation
- 13.7 Validation techniques employed for market sizing
- Validation techniques employed for market sizing
- 13.8 Data synthesis
- Data synthesis
- 13.9 360 degree market analysis
- 360 degree market analysis
- 13.10 List of abbreviations
- List of abbreviations

