|
|
市場調査レポート
商品コード
1684914
Eスポーツの世界市場、2025-2029年Global Esports Market 2025-2029 |
||||||

|
|||||||
カスタマイズ可能
|
|||||||


| Eスポーツの世界市場、2025-2029年 |
|
出版日: 2025年03月06日
発行: TechNavio
ページ情報: 英文 229 Pages
納期: 即納可能
|

全表示
- 概要
- 図表
- 目次
Eスポーツ市場は、2024年から2029年にかけて43億3,700万米ドル、予測期間中のCAGRは21.2%で成長すると予測されています。
当レポートでは、Eスポーツ市場の全体的な分析、市場規模・予測、動向、成長促進要因、課題、約25のベンダーを網羅したベンダー分析などを掲載しています。
現在の市場シナリオ、最新動向と促進要因、市場環境全体に関する最新分析を提供しています。Eスポーツによるブランディングの増加、Eスポーツイベントの増加、Eスポーツの新しいプラットフォームの立ち上げなどが市場を牽引しています。
| 市場範囲 | |
|---|---|
| 基準年 | 2025 |
| 終了年 | 2029 |
| 予測期間 | 2025-2029 |
| 成長モメンタム | 加速 |
| 前年比2025年 | 20% |
| CAGR | 21.2% |
| 増分額 | 43億3,700万米ドル |
本調査は、業界の主要参加者からのインプットを含め、一次情報と二次情報を客観的に組み合わせて実施しました。レポートには、主要企業の分析に加え、包括的な市場規模データ、地域別分析によるセグメント、ベンダー情勢が含まれています。レポートには過去データと予測データがあります。
本調査では、今後数年間におけるEスポーツ市場の成長を促進する主な要因の1つとして、Eスポーツベッティングの増加を挙げています。また、ハイテクゲーム機の進化やAIとデータ分析の統合は、市場の大きな需要につながるでしょう。
目次
第1章 エグゼクティブサマリー
- 市場概要
第2章 Technavio分析
- 価格・ライフサイクル・顧客購入バスケット・採用率・購入基準の分析
- インプットの重要性と差別化の要因
- 混乱の要因
- 促進要因と課題の影響
第3章 市場情勢
- 市場エコシステム
- 市場の特徴
- バリューチェーン分析
第4章 市場規模
- 市場の定義
- 市場セグメント分析
- 市場規模 2024
- 市場の見通し 2024-2029
第5章 市場規模実績
- Eスポーツの世界市場 2019-2023
- 収益源セグメント分析 2019-2023
- ジャンルセグメント分析 2019-2023
- デバイスセグメント分析 2019-2023
- 地域別セグメント分析 2019-2023
- 国別セグメント分析 2019-2023
第6章 定性分析
- AIの影響: Eスポーツの世界市場
第7章 ファイブフォース分析
- ファイブフォースの要約
- 買い手の交渉力
- 供給企業の交渉力
- 新規参入業者の脅威
- 代替品の脅威
- 競争の脅威
- 市況
第8章 市場セグメンテーション収益源別
- 市場セグメント
- 比較:収益源別
- スポンサーシップ:市場規模と予測 2024-2029
- メディア放送権料:市場規模と予測 2024-2029
- ゲーム会社収入:市場規模と予測 2024-2029
- 広告:市場規模と予測 2024-2029
- グッズとチケットの販売:市場規模と予測 2024-2029
- 市場機会:収益源別
第9章 市場セグメンテーションジャンル別
- 市場セグメント
- 比較ジャンル別
- マルチプレイヤーオンラインバトルアリーナ:市場規模と予測 2024-2029
- ファーストパーソン・シューティングゲーム:市場規模と予測 2024-2029
- リアルタイムストラテジーゲーム:市場規模と予測 2024-2029
- その他:市場規模と予測 2024-2029
- 市場機会ジャンル別
第10章 市場セグメンテーション:デバイス別
- 市場セグメント
- 比較:デバイス別
- スマートフォンとスマートテレビ:市場規模と予測 2024-2029
- ゲーム機:市場規模と予測 2024-2029
- デスクトップ/ノートパソコン/ タブレット:市場規模と予測 2024-2029
- 市場機会:デバイス別
第11章 顧客情勢
- 顧客情勢の概要
第12章 地域別情勢
- 地域別セグメンテーション
- 地域別比較
- アジア太平洋:市場規模と予測 2024-2029
- 欧州:市場規模と予測 2024-2029
- 北米:市場規模と予測 2024-2029
- 南米:市場規模と予測 2024-2029
- 中東・アフリカ:市場規模と予測 2024-2029
- 米国:市場規模と予測 2024-2029
- 中国:市場規模と予測 2024-2029
- 日本:市場規模と予測 2024-2029
- ドイツ:市場規模と予測 2024-2029
- インド:市場規模と予測 2024-2029
- 英国:市場規模と予測 2024-2029
- カナダ:市場規模と予測 2024-2029
- 韓国:市場規模と予測 2024-2029
- フランス:市場規模と予測 2024-2029
- イタリア:市場規模と予測 2024-2029
- 市場機会:地域情勢別
第13章 促進要因・課題・機会・抑制要因
- 市場促進要因
- 市場の課題
- 促進要因と課題の影響
- 市場の機会・抑制要因
第14章 競合情勢
- 概要
- 競合情勢
- 混乱の状況
- 業界のリスク
第15章 競合分析
- 企業プロファイル
- 企業ランキング指数
- 企業の市場ポジショニング
- Activision Blizzard Inc.
- Amazon.com Inc.
- Electronic Arts Inc.
- Gfinity Plc
- Hi Rez Studios Inc.
- Kabam Games Inc.
- Modern Times Group MTG AB
- Nintendo Co. Ltd.
- Riot Games Inc.
- Rovio Entertainment Corp.
- Starladder Ltd.
- Take Two Interactive Software Inc.
- TaKeTV GmbH
- Tencent Holdings Ltd.
- Wargaming Group Ltd.
第16章 付録
Exhibits:
- Exhibits1: Executive Summary - Chart on Market Overview
- Exhibits2: Executive Summary - Data Table on Market Overview
- Exhibits3: Executive Summary - Chart on Global Market Characteristics
- Exhibits4: Executive Summary - Chart on Market By Geographical Landscape
- Exhibits5: Executive Summary - Chart on Market Segmentation by Revenue Stream
- Exhibits6: Executive Summary - Chart on Market Segmentation by Genre
- Exhibits7: Executive Summary - Chart on Market Segmentation by Device
- Exhibits8: Executive Summary - Chart on Incremental Growth
- Exhibits9: Executive Summary - Data Table on Incremental Growth
- Exhibits10: Executive Summary - Chart on Company Market Positioning
- Exhibits11: Analysis of price sensitivity, lifecycle, customer purchase basket, adoption rates, and purchase criteria
- Exhibits12: Overview on criticality of inputs and factors of differentiation
- Exhibits13: Overview on factors of disruption
- Exhibits14: Impact of drivers and challenges in 2024 and 2029
- Exhibits15: Parent Market
- Exhibits16: Data Table on - Parent Market
- Exhibits17: Market characteristics analysis
- Exhibits18: Value chain analysis
- Exhibits19: Offerings of companies included in the market definition
- Exhibits20: Market segments
- Exhibits21: Chart on Global - Market size and forecast 2024-2029 ($ million)
- Exhibits22: Data Table on Global - Market size and forecast 2024-2029 ($ million)
- Exhibits23: Chart on Global Market: Year-over-year growth 2024-2029 (%)
- Exhibits24: Data Table on Global Market: Year-over-year growth 2024-2029 (%)
- Exhibits25: Historic Market Size - Data Table on Global Esports Market 2019 - 2023 ($ million)
- Exhibits26: Historic Market Size - Revenue Stream Segment 2019 - 2023 ($ million)
- Exhibits27: Historic Market Size - Genre Segment 2019 - 2023 ($ million)
- Exhibits28: Historic Market Size - Device Segment 2019 - 2023 ($ million)
- Exhibits29: Historic Market Size - Geography Segment 2019 - 2023 ($ million)
- Exhibits30: Historic Market Size - Country Segment 2019 - 2023 ($ million)
- Exhibits31: Five forces analysis - Comparison between 2024 and 2029
- Exhibits32: Bargaining power of buyers - Impact of key factors 2024 and 2029
- Exhibits33: Bargaining power of suppliers - Impact of key factors in 2024 and 2029
- Exhibits34: Threat of new entrants - Impact of key factors in 2024 and 2029
- Exhibits35: Threat of substitutes - Impact of key factors in 2024 and 2029
- Exhibits36: Threat of rivalry - Impact of key factors in 2024 and 2029
- Exhibits37: Chart on Market condition - Five forces 2024 and 2029
- Exhibits38: Chart on Revenue Stream - Market share 2024-2029 (%)
- Exhibits39: Data Table on Revenue Stream - Market share 2024-2029 (%)
- Exhibits40: Chart on Comparison by Revenue Stream
- Exhibits41: Data Table on Comparison by Revenue Stream
- Exhibits42: Chart on Sponsorships - Market size and forecast 2024-2029 ($ million)
- Exhibits43: Data Table on Sponsorships - Market size and forecast 2024-2029 ($ million)
- Exhibits44: Chart on Sponsorships - Year-over-year growth 2024-2029 (%)
- Exhibits45: Data Table on Sponsorships - Year-over-year growth 2024-2029 (%)
- Exhibits46: Chart on Media rights - Market size and forecast 2024-2029 ($ million)
- Exhibits47: Data Table on Media rights - Market size and forecast 2024-2029 ($ million)
- Exhibits48: Chart on Media rights - Year-over-year growth 2024-2029 (%)
- Exhibits49: Data Table on Media rights - Year-over-year growth 2024-2029 (%)
- Exhibits50: Chart on Publisher fees - Market size and forecast 2024-2029 ($ million)
- Exhibits51: Data Table on Publisher fees - Market size and forecast 2024-2029 ($ million)
- Exhibits52: Chart on Publisher fees - Year-over-year growth 2024-2029 (%)
- Exhibits53: Data Table on Publisher fees - Year-over-year growth 2024-2029 (%)
- Exhibits54: Chart on Advertising - Market size and forecast 2024-2029 ($ million)
- Exhibits55: Data Table on Advertising - Market size and forecast 2024-2029 ($ million)
- Exhibits56: Chart on Advertising - Year-over-year growth 2024-2029 (%)
- Exhibits57: Data Table on Advertising - Year-over-year growth 2024-2029 (%)
- Exhibits58: Chart on Merchandise and ticket sales - Market size and forecast 2024-2029 ($ million)
- Exhibits59: Data Table on Merchandise and ticket sales - Market size and forecast 2024-2029 ($ million)
- Exhibits60: Chart on Merchandise and ticket sales - Year-over-year growth 2024-2029 (%)
- Exhibits61: Data Table on Merchandise and ticket sales - Year-over-year growth 2024-2029 (%)
- Exhibits62: Market opportunity by Revenue Stream ($ million)
- Exhibits63: Data Table on Market opportunity by Revenue Stream ($ million)
- Exhibits64: Chart on Genre - Market share 2024-2029 (%)
- Exhibits65: Data Table on Genre - Market share 2024-2029 (%)
- Exhibits66: Chart on Comparison by Genre
- Exhibits67: Data Table on Comparison by Genre
- Exhibits68: Chart on MOBA - Market size and forecast 2024-2029 ($ million)
- Exhibits69: Data Table on MOBA - Market size and forecast 2024-2029 ($ million)
- Exhibits70: Chart on MOBA - Year-over-year growth 2024-2029 (%)
- Exhibits71: Data Table on MOBA - Year-over-year growth 2024-2029 (%)
- Exhibits72: Chart on FPS - Market size and forecast 2024-2029 ($ million)
- Exhibits73: Data Table on FPS - Market size and forecast 2024-2029 ($ million)
- Exhibits74: Chart on FPS - Year-over-year growth 2024-2029 (%)
- Exhibits75: Data Table on FPS - Year-over-year growth 2024-2029 (%)
- Exhibits76: Chart on RTS - Market size and forecast 2024-2029 ($ million)
- Exhibits77: Data Table on RTS - Market size and forecast 2024-2029 ($ million)
- Exhibits78: Chart on RTS - Year-over-year growth 2024-2029 (%)
- Exhibits79: Data Table on RTS - Year-over-year growth 2024-2029 (%)
- Exhibits80: Chart on Others - Market size and forecast 2024-2029 ($ million)
- Exhibits81: Data Table on Others - Market size and forecast 2024-2029 ($ million)
- Exhibits82: Chart on Others - Year-over-year growth 2024-2029 (%)
- Exhibits83: Data Table on Others - Year-over-year growth 2024-2029 (%)
- Exhibits84: Market opportunity by Genre ($ million)
- Exhibits85: Data Table on Market opportunity by Genre ($ million)
- Exhibits86: Chart on Device - Market share 2024-2029 (%)
- Exhibits87: Data Table on Device - Market share 2024-2029 (%)
- Exhibits88: Chart on Comparison by Device
- Exhibits89: Data Table on Comparison by Device
- Exhibits90: Chart on Smart phone and smart TV - Market size and forecast 2024-2029 ($ million)
- Exhibits91: Data Table on Smart phone and smart TV - Market size and forecast 2024-2029 ($ million)
- Exhibits92: Chart on Smart phone and smart TV - Year-over-year growth 2024-2029 (%)
- Exhibits93: Data Table on Smart phone and smart TV - Year-over-year growth 2024-2029 (%)
- Exhibits94: Chart on Gaming console - Market size and forecast 2024-2029 ($ million)
- Exhibits95: Data Table on Gaming console - Market size and forecast 2024-2029 ($ million)
- Exhibits96: Chart on Gaming console - Year-over-year growth 2024-2029 (%)
- Exhibits97: Data Table on Gaming console - Year-over-year growth 2024-2029 (%)
- Exhibits98: Chart on Desktop / laptop / tablets - Market size and forecast 2024-2029 ($ million)
- Exhibits99: Data Table on Desktop / laptop / tablets - Market size and forecast 2024-2029 ($ million)
- Exhibits100: Chart on Desktop / laptop / tablets - Year-over-year growth 2024-2029 (%)
- Exhibits101: Data Table on Desktop / laptop / tablets - Year-over-year growth 2024-2029 (%)
- Exhibits102: Market opportunity by Device ($ million)
- Exhibits103: Data Table on Market opportunity by Device ($ million)
- Exhibits104: Analysis of price sensitivity, lifecycle, customer purchase basket, adoption rates, and purchase criteria
- Exhibits105: Chart on Market share By Geographical Landscape 2024-2029 (%)
- Exhibits106: Data Table on Market share By Geographical Landscape 2024-2029 (%)
- Exhibits107: Chart on Geographic comparison
- Exhibits108: Data Table on Geographic comparison
- Exhibits109: Chart on APAC - Market size and forecast 2024-2029 ($ million)
- Exhibits110: Data Table on APAC - Market size and forecast 2024-2029 ($ million)
- Exhibits111: Chart on APAC - Year-over-year growth 2024-2029 (%)
- Exhibits112: Data Table on APAC - Year-over-year growth 2024-2029 (%)
- Exhibits113: Chart on Europe - Market size and forecast 2024-2029 ($ million)
- Exhibits114: Data Table on Europe - Market size and forecast 2024-2029 ($ million)
- Exhibits115: Chart on Europe - Year-over-year growth 2024-2029 (%)
- Exhibits116: Data Table on Europe - Year-over-year growth 2024-2029 (%)
- Exhibits117: Chart on North America - Market size and forecast 2024-2029 ($ million)
- Exhibits118: Data Table on North America - Market size and forecast 2024-2029 ($ million)
- Exhibits119: Chart on North America - Year-over-year growth 2024-2029 (%)
- Exhibits120: Data Table on North America - Year-over-year growth 2024-2029 (%)
- Exhibits121: Chart on South America - Market size and forecast 2024-2029 ($ million)
- Exhibits122: Data Table on South America - Market size and forecast 2024-2029 ($ million)
- Exhibits123: Chart on South America - Year-over-year growth 2024-2029 (%)
- Exhibits124: Data Table on South America - Year-over-year growth 2024-2029 (%)
- Exhibits125: Chart on Middle East and Africa - Market size and forecast 2024-2029 ($ million)
- Exhibits126: Data Table on Middle East and Africa - Market size and forecast 2024-2029 ($ million)
- Exhibits127: Chart on Middle East and Africa - Year-over-year growth 2024-2029 (%)
- Exhibits128: Data Table on Middle East and Africa - Year-over-year growth 2024-2029 (%)
- Exhibits129: Chart on US - Market size and forecast 2024-2029 ($ million)
- Exhibits130: Data Table on US - Market size and forecast 2024-2029 ($ million)
- Exhibits131: Chart on US - Year-over-year growth 2024-2029 (%)
- Exhibits132: Data Table on US - Year-over-year growth 2024-2029 (%)
- Exhibits133: Chart on China - Market size and forecast 2024-2029 ($ million)
- Exhibits134: Data Table on China - Market size and forecast 2024-2029 ($ million)
- Exhibits135: Chart on China - Year-over-year growth 2024-2029 (%)
- Exhibits136: Data Table on China - Year-over-year growth 2024-2029 (%)
- Exhibits137: Chart on Japan - Market size and forecast 2024-2029 ($ million)
- Exhibits138: Data Table on Japan - Market size and forecast 2024-2029 ($ million)
- Exhibits139: Chart on Japan - Year-over-year growth 2024-2029 (%)
- Exhibits140: Data Table on Japan - Year-over-year growth 2024-2029 (%)
- Exhibits141: Chart on Germany - Market size and forecast 2024-2029 ($ million)
- Exhibits142: Data Table on Germany - Market size and forecast 2024-2029 ($ million)
- Exhibits143: Chart on Germany - Year-over-year growth 2024-2029 (%)
- Exhibits144: Data Table on Germany - Year-over-year growth 2024-2029 (%)
- Exhibits145: Chart on India - Market size and forecast 2024-2029 ($ million)
- Exhibits146: Data Table on India - Market size and forecast 2024-2029 ($ million)
- Exhibits147: Chart on India - Year-over-year growth 2024-2029 (%)
- Exhibits148: Data Table on India - Year-over-year growth 2024-2029 (%)
- Exhibits149: Chart on UK - Market size and forecast 2024-2029 ($ million)
- Exhibits150: Data Table on UK - Market size and forecast 2024-2029 ($ million)
- Exhibits151: Chart on UK - Year-over-year growth 2024-2029 (%)
- Exhibits152: Data Table on UK - Year-over-year growth 2024-2029 (%)
- Exhibits153: Chart on Canada - Market size and forecast 2024-2029 ($ million)
- Exhibits154: Data Table on Canada - Market size and forecast 2024-2029 ($ million)
- Exhibits155: Chart on Canada - Year-over-year growth 2024-2029 (%)
- Exhibits156: Data Table on Canada - Year-over-year growth 2024-2029 (%)
- Exhibits157: Chart on South Korea - Market size and forecast 2024-2029 ($ million)
- Exhibits158: Data Table on South Korea - Market size and forecast 2024-2029 ($ million)
- Exhibits159: Chart on South Korea - Year-over-year growth 2024-2029 (%)
- Exhibits160: Data Table on South Korea - Year-over-year growth 2024-2029 (%)
- Exhibits161: Chart on France - Market size and forecast 2024-2029 ($ million)
- Exhibits162: Data Table on France - Market size and forecast 2024-2029 ($ million)
- Exhibits163: Chart on France - Year-over-year growth 2024-2029 (%)
- Exhibits164: Data Table on France - Year-over-year growth 2024-2029 (%)
- Exhibits165: Chart on Italy - Market size and forecast 2024-2029 ($ million)
- Exhibits166: Data Table on Italy - Market size and forecast 2024-2029 ($ million)
- Exhibits167: Chart on Italy - Year-over-year growth 2024-2029 (%)
- Exhibits168: Data Table on Italy - Year-over-year growth 2024-2029 (%)
- Exhibits169: Market opportunity By Geographical Landscape ($ million)
- Exhibits170: Data Tables on Market opportunity By Geographical Landscape ($ million)
- Exhibits171: Impact of drivers and challenges in 2024 and 2029
- Exhibits172: Overview on criticality of inputs and factors of differentiation
- Exhibits173: Overview on factors of disruption
- Exhibits174: Impact of key risks on business
- Exhibits175: Companies covered
- Exhibits176: Company ranking index
- Exhibits177: Matrix on companies position and classification
- Exhibits178: Activision Blizzard Inc. - Overview
- Exhibits179: Activision Blizzard Inc. - Business segments
- Exhibits180: Activision Blizzard Inc. - Key news
- Exhibits181: Activision Blizzard Inc. - Key offerings
- Exhibits182: Activision Blizzard Inc. - Segment focus
- Exhibits183: SWOT
- Exhibits184: Amazon.com Inc. - Overview
- Exhibits185: Amazon.com Inc. - Business segments
- Exhibits186: Amazon.com Inc. - Key news
- Exhibits187: Amazon.com Inc. - Key offerings
- Exhibits188: Amazon.com Inc. - Segment focus
- Exhibits189: SWOT
- Exhibits190: Electronic Arts Inc. - Overview
- Exhibits191: Electronic Arts Inc. - Product / Service
- Exhibits192: Electronic Arts Inc. - Key offerings
- Exhibits193: SWOT
- Exhibits194: Gfinity Plc - Overview
- Exhibits195: Gfinity Plc - Business segments
- Exhibits196: Gfinity Plc - Key offerings
- Exhibits197: Gfinity Plc - Segment focus
- Exhibits198: SWOT
- Exhibits199: Hi Rez Studios Inc. - Overview
- Exhibits200: Hi Rez Studios Inc. - Product / Service
- Exhibits201: Hi Rez Studios Inc. - Key offerings
- Exhibits202: SWOT
- Exhibits203: Kabam Games Inc. - Overview
- Exhibits204: Kabam Games Inc. - Product / Service
- Exhibits205: Kabam Games Inc. - Key offerings
- Exhibits206: SWOT
- Exhibits207: Modern Times Group MTG AB - Overview
- Exhibits208: Modern Times Group MTG AB - Business segments
- Exhibits209: Modern Times Group MTG AB - Key offerings
- Exhibits210: Modern Times Group MTG AB - Segment focus
- Exhibits211: SWOT
- Exhibits212: Nintendo Co. Ltd. - Overview
- Exhibits213: Nintendo Co. Ltd. - Product / Service
- Exhibits214: Nintendo Co. Ltd. - Key offerings
- Exhibits215: SWOT
- Exhibits216: Riot Games Inc. - Overview
- Exhibits217: Riot Games Inc. - Product / Service
- Exhibits218: Riot Games Inc. - Key offerings
- Exhibits219: SWOT
- Exhibits220: Rovio Entertainment Corp. - Overview
- Exhibits221: Rovio Entertainment Corp. - Business segments
- Exhibits222: Rovio Entertainment Corp. - Key news
- Exhibits223: Rovio Entertainment Corp. - Key offerings
- Exhibits224: Rovio Entertainment Corp. - Segment focus
- Exhibits225: SWOT
- Exhibits226: Starladder Ltd. - Overview
- Exhibits227: Starladder Ltd. - Product / Service
- Exhibits228: Starladder Ltd. - Key offerings
- Exhibits229: SWOT
- Exhibits230: Take Two Interactive Software Inc. - Overview
- Exhibits231: Take Two Interactive Software Inc. - Product / Service
- Exhibits232: Take Two Interactive Software Inc. - Key offerings
- Exhibits233: SWOT
- Exhibits234: TaKeTV GmbH - Overview
- Exhibits235: TaKeTV GmbH - Product / Service
- Exhibits236: TaKeTV GmbH - Key offerings
- Exhibits237: SWOT
- Exhibits238: Tencent Holdings Ltd. - Overview
- Exhibits239: Tencent Holdings Ltd. - Business segments
- Exhibits240: Tencent Holdings Ltd. - Key news
- Exhibits241: Tencent Holdings Ltd. - Key offerings
- Exhibits242: Tencent Holdings Ltd. - Segment focus
- Exhibits243: SWOT
- Exhibits244: Wargaming Group Ltd. - Overview
- Exhibits245: Wargaming Group Ltd. - Product / Service
- Exhibits246: Wargaming Group Ltd. - Key offerings
- Exhibits247: SWOT
- Exhibits248: Inclusions checklist
- Exhibits249: Exclusions checklist
- Exhibits250: Currency conversion rates for US$
- Exhibits251: Research methodology
- Exhibits252: Information sources
- Exhibits253: Data validation
- Exhibits254: Validation techniques employed for market sizing
- Exhibits255: Data synthesis
- Exhibits256: 360 degree market analysis
- Exhibits257: List of abbreviations
The Esports market is forecasted to grow by USD 4337 million during 2024-2029, accelerating at a CAGR of 21.2% during the forecast period. The report on the esports market provides a holistic analysis, market size and forecast, trends, growth drivers, and challenges, as well as vendor analysis covering around 25 vendors.
The report offers an up-to-date analysis regarding the current market scenario, the latest trends and drivers, and the overall market environment. The market is driven by increasing branding through esports, rising number of esports events, and new platform launches for esports.
| Market Scope | |
|---|---|
| Base Year | 2025 |
| End Year | 2029 |
| Series Year | 2025-2029 |
| Growth Momentum | Accelerate |
| YOY 2025 | 20% |
| CAGR | 21.2% |
| Incremental Value | $4337 mn |
The study was conducted using an objective combination of primary and secondary information including inputs from key participants in the industry. The report contains a comprehensive market size data, segment with regional analysis and vendor landscape in addition to an analysis of the key companies. Reports have historic and forecast data.
Technavio's esports market is segmented as below:
By Revenue Stream
- Sponsorships
- Media rights
- Publisher fees
- Advertising
- Merchandise and ticket sales
By Genre
- MOBA
- FPS
- RTS
- Others
By Device
- Smart phone and smart TV
- Gaming console
- Desktop / laptop / tablets
By Geographical Landscape
- APAC
- Europe
- North America
- South America
- Middle East and Africa
This study identifies the increase in esports betting as one of the prime reasons driving the esports market growth during the next few years. Also, evolution of high-tech gaming consoles and integration of AI and data analytics will lead to sizable demand in the market.
The report on the esports market covers the following areas:
- Esports Market sizing
- Esports Market forecast
- Esports Market industry analysis
The robust vendor analysis is designed to help clients improve their market position, and in line with this, this report provides a detailed analysis of several leading esports market vendors that include Activision Blizzard Inc., Amazon.com Inc., ANT Esports, Electronic Arts Inc., Gfinity PLC, Hi Rez Studios Inc., Kabam Games Inc., Modern Times Group MTG AB, Nintendo Co. Ltd., Riot Games Inc., Rovio Entertainment Corp., Starladder Ltd., Take Two Interactive Software Inc., TaKeTV GmbH, Tencent Holdings Ltd., Valve Corp., and Wargaming Group Ltd.. Also, the esports market analysis report includes information on upcoming trends and challenges that will influence market growth. This is to help companies strategize and leverage all forthcoming growth opportunities.
The publisher presents a detailed picture of the market by the way of study, synthesis, and summation of data from multiple sources by an analysis of key parameters such as profit, pricing, competition, and promotions. It presents various market facets by identifying the key industry influencers. The data presented is comprehensive, reliable, and a result of extensive primary and secondary research. The market research reports provide a complete competitive landscape and an in-depth vendor selection methodology and analysis using qualitative and quantitative research to forecast accurate market growth.
Table of Contents
1 Executive Summary
- 1.1 Market overview
- Executive Summary - Chart on Market Overview
- Executive Summary - Data Table on Market Overview
- Executive Summary - Chart on Global Market Characteristics
- Executive Summary - Chart on Market By Geographical Landscape
- Executive Summary - Chart on Market Segmentation by Revenue Stream
- Executive Summary - Chart on Market Segmentation by Genre
- Executive Summary - Chart on Market Segmentation by Device
- Executive Summary - Chart on Incremental Growth
- Executive Summary - Data Table on Incremental Growth
- Executive Summary - Chart on Company Market Positioning
2 Technavio Analysis
- 2.1 Analysis of price sensitivity, lifecycle, customer purchase basket, adoption rates, and purchase criteria
- Analysis of price sensitivity, lifecycle, customer purchase basket, adoption rates, and purchase criteria
- 2.2 Criticality of inputs and Factors of differentiation
- Overview on criticality of inputs and factors of differentiation
- 2.3 Factors of disruption
- Overview on factors of disruption
- 2.4 Impact of drivers and challenges
- Impact of drivers and challenges in 2024 and 2029
3 Market Landscape
- 3.1 Market ecosystem
- Parent Market
- Data Table on - Parent Market
- 3.2 Market characteristics
- Market characteristics analysis
- 3.3 Value chain analysis
- Value chain analysis
4 Market Sizing
- 4.1 Market definition
- Offerings of companies included in the market definition
- 4.2 Market segment analysis
- Market segments
- 4.3 Market size 2024
- 4.4 Market outlook: Forecast for 2024-2029
- Chart on Global - Market size and forecast 2024-2029 ($ million)
- Data Table on Global - Market size and forecast 2024-2029 ($ million)
- Chart on Global Market: Year-over-year growth 2024-2029 (%)
- Data Table on Global Market: Year-over-year growth 2024-2029 (%)
5 Historic Market Size
- 5.1 Global Esports Market 2019 - 2023
- Historic Market Size - Data Table on Global Esports Market 2019 - 2023 ($ million)
- 5.2 Revenue Stream segment analysis 2019 - 2023
- Historic Market Size - Revenue Stream Segment 2019 - 2023 ($ million)
- 5.3 Genre segment analysis 2019 - 2023
- Historic Market Size - Genre Segment 2019 - 2023 ($ million)
- 5.4 Device segment analysis 2019 - 2023
- Historic Market Size - Device Segment 2019 - 2023 ($ million)
- 5.5 Geography segment analysis 2019 - 2023
- Historic Market Size - Geography Segment 2019 - 2023 ($ million)
- 5.6 Country segment analysis 2019 - 2023
- Historic Market Size - Country Segment 2019 - 2023 ($ million)
6 Qualitative Analysis
- 6.1 Impact of AI on Global Esports Market
7 Five Forces Analysis
- 7.1 Five forces summary
- Five forces analysis - Comparison between 2024 and 2029
- 7.2 Bargaining power of buyers
- Bargaining power of buyers - Impact of key factors 2024 and 2029
- 7.3 Bargaining power of suppliers
- Bargaining power of suppliers - Impact of key factors in 2024 and 2029
- 7.4 Threat of new entrants
- Threat of new entrants - Impact of key factors in 2024 and 2029
- 7.5 Threat of substitutes
- Threat of substitutes - Impact of key factors in 2024 and 2029
- 7.6 Threat of rivalry
- Threat of rivalry - Impact of key factors in 2024 and 2029
- 7.7 Market condition
- Chart on Market condition - Five forces 2024 and 2029
8 Market Segmentation by Revenue Stream
- 8.1 Market segments
- Chart on Revenue Stream - Market share 2024-2029 (%)
- Data Table on Revenue Stream - Market share 2024-2029 (%)
- 8.2 Comparison by Revenue Stream
- Chart on Comparison by Revenue Stream
- Data Table on Comparison by Revenue Stream
- 8.3 Sponsorships - Market size and forecast 2024-2029
- Chart on Sponsorships - Market size and forecast 2024-2029 ($ million)
- Data Table on Sponsorships - Market size and forecast 2024-2029 ($ million)
- Chart on Sponsorships - Year-over-year growth 2024-2029 (%)
- Data Table on Sponsorships - Year-over-year growth 2024-2029 (%)
- 8.4 Media rights - Market size and forecast 2024-2029
- Chart on Media rights - Market size and forecast 2024-2029 ($ million)
- Data Table on Media rights - Market size and forecast 2024-2029 ($ million)
- Chart on Media rights - Year-over-year growth 2024-2029 (%)
- Data Table on Media rights - Year-over-year growth 2024-2029 (%)
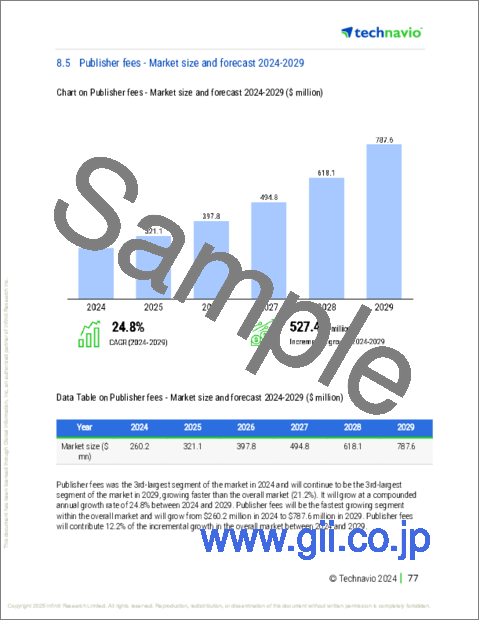
- 8.5 Publisher fees - Market size and forecast 2024-2029
- Chart on Publisher fees - Market size and forecast 2024-2029 ($ million)
- Data Table on Publisher fees - Market size and forecast 2024-2029 ($ million)
- Chart on Publisher fees - Year-over-year growth 2024-2029 (%)
- Data Table on Publisher fees - Year-over-year growth 2024-2029 (%)
- 8.6 Advertising - Market size and forecast 2024-2029
- Chart on Advertising - Market size and forecast 2024-2029 ($ million)
- Data Table on Advertising - Market size and forecast 2024-2029 ($ million)
- Chart on Advertising - Year-over-year growth 2024-2029 (%)
- Data Table on Advertising - Year-over-year growth 2024-2029 (%)
- 8.7 Merchandise and ticket sales - Market size and forecast 2024-2029
- Chart on Merchandise and ticket sales - Market size and forecast 2024-2029 ($ million)
- Data Table on Merchandise and ticket sales - Market size and forecast 2024-2029 ($ million)
- Chart on Merchandise and ticket sales - Year-over-year growth 2024-2029 (%)
- Data Table on Merchandise and ticket sales - Year-over-year growth 2024-2029 (%)
- 8.8 Market opportunity by Revenue Stream
- Market opportunity by Revenue Stream ($ million)
- Data Table on Market opportunity by Revenue Stream ($ million)
9 Market Segmentation by Genre
- 9.1 Market segments
- Chart on Genre - Market share 2024-2029 (%)
- Data Table on Genre - Market share 2024-2029 (%)
- 9.2 Comparison by Genre
- Chart on Comparison by Genre
- Data Table on Comparison by Genre
- 9.3 MOBA - Market size and forecast 2024-2029
- Chart on MOBA - Market size and forecast 2024-2029 ($ million)
- Data Table on MOBA - Market size and forecast 2024-2029 ($ million)
- Chart on MOBA - Year-over-year growth 2024-2029 (%)
- Data Table on MOBA - Year-over-year growth 2024-2029 (%)
- 9.4 FPS - Market size and forecast 2024-2029
- Chart on FPS - Market size and forecast 2024-2029 ($ million)
- Data Table on FPS - Market size and forecast 2024-2029 ($ million)
- Chart on FPS - Year-over-year growth 2024-2029 (%)
- Data Table on FPS - Year-over-year growth 2024-2029 (%)
- 9.5 RTS - Market size and forecast 2024-2029
- Chart on RTS - Market size and forecast 2024-2029 ($ million)
- Data Table on RTS - Market size and forecast 2024-2029 ($ million)
- Chart on RTS - Year-over-year growth 2024-2029 (%)
- Data Table on RTS - Year-over-year growth 2024-2029 (%)
- 9.6 Others - Market size and forecast 2024-2029
- Chart on Others - Market size and forecast 2024-2029 ($ million)
- Data Table on Others - Market size and forecast 2024-2029 ($ million)
- Chart on Others - Year-over-year growth 2024-2029 (%)
- Data Table on Others - Year-over-year growth 2024-2029 (%)
- 9.7 Market opportunity by Genre
- Market opportunity by Genre ($ million)
- Data Table on Market opportunity by Genre ($ million)
10 Market Segmentation by Device
- 10.1 Market segments
- Chart on Device - Market share 2024-2029 (%)
- Data Table on Device - Market share 2024-2029 (%)
- 10.2 Comparison by Device
- Chart on Comparison by Device
- Data Table on Comparison by Device
- 10.3 Smart phone and smart TV - Market size and forecast 2024-2029
- Chart on Smart phone and smart TV - Market size and forecast 2024-2029 ($ million)
- Data Table on Smart phone and smart TV - Market size and forecast 2024-2029 ($ million)
- Chart on Smart phone and smart TV - Year-over-year growth 2024-2029 (%)
- Data Table on Smart phone and smart TV - Year-over-year growth 2024-2029 (%)
- 10.4 Gaming console - Market size and forecast 2024-2029
- Chart on Gaming console - Market size and forecast 2024-2029 ($ million)
- Data Table on Gaming console - Market size and forecast 2024-2029 ($ million)
- Chart on Gaming console - Year-over-year growth 2024-2029 (%)
- Data Table on Gaming console - Year-over-year growth 2024-2029 (%)
- 10.5 Desktop / laptop / tablets - Market size and forecast 2024-2029
- Chart on Desktop / laptop / tablets - Market size and forecast 2024-2029 ($ million)
- Data Table on Desktop / laptop / tablets - Market size and forecast 2024-2029 ($ million)
- Chart on Desktop / laptop / tablets - Year-over-year growth 2024-2029 (%)
- Data Table on Desktop / laptop / tablets - Year-over-year growth 2024-2029 (%)
- 10.6 Market opportunity by Device
- Market opportunity by Device ($ million)
- Data Table on Market opportunity by Device ($ million)
11 Customer Landscape
- 11.1 Customer landscape overview
- Analysis of price sensitivity, lifecycle, customer purchase basket, adoption rates, and purchase criteria
12 Geographic Landscape
- 12.1 Geographic segmentation
- Chart on Market share By Geographical Landscape 2024-2029 (%)
- Data Table on Market share By Geographical Landscape 2024-2029 (%)
- 12.2 Geographic comparison
- Chart on Geographic comparison
- Data Table on Geographic comparison
- 12.3 APAC - Market size and forecast 2024-2029
- Chart on APAC - Market size and forecast 2024-2029 ($ million)
- Data Table on APAC - Market size and forecast 2024-2029 ($ million)
- Chart on APAC - Year-over-year growth 2024-2029 (%)
- Data Table on APAC - Year-over-year growth 2024-2029 (%)
- 12.4 Europe - Market size and forecast 2024-2029
- Chart on Europe - Market size and forecast 2024-2029 ($ million)
- Data Table on Europe - Market size and forecast 2024-2029 ($ million)
- Chart on Europe - Year-over-year growth 2024-2029 (%)
- Data Table on Europe - Year-over-year growth 2024-2029 (%)
- 12.5 North America - Market size and forecast 2024-2029
- Chart on North America - Market size and forecast 2024-2029 ($ million)
- Data Table on North America - Market size and forecast 2024-2029 ($ million)
- Chart on North America - Year-over-year growth 2024-2029 (%)
- Data Table on North America - Year-over-year growth 2024-2029 (%)
- 12.6 South America - Market size and forecast 2024-2029
- Chart on South America - Market size and forecast 2024-2029 ($ million)
- Data Table on South America - Market size and forecast 2024-2029 ($ million)
- Chart on South America - Year-over-year growth 2024-2029 (%)
- Data Table on South America - Year-over-year growth 2024-2029 (%)
- 12.7 Middle East and Africa - Market size and forecast 2024-2029
- Chart on Middle East and Africa - Market size and forecast 2024-2029 ($ million)
- Data Table on Middle East and Africa - Market size and forecast 2024-2029 ($ million)
- Chart on Middle East and Africa - Year-over-year growth 2024-2029 (%)
- Data Table on Middle East and Africa - Year-over-year growth 2024-2029 (%)
- 12.8 US - Market size and forecast 2024-2029
- Chart on US - Market size and forecast 2024-2029 ($ million)
- Data Table on US - Market size and forecast 2024-2029 ($ million)
- Chart on US - Year-over-year growth 2024-2029 (%)
- Data Table on US - Year-over-year growth 2024-2029 (%)
- 12.9 China - Market size and forecast 2024-2029
- Chart on China - Market size and forecast 2024-2029 ($ million)
- Data Table on China - Market size and forecast 2024-2029 ($ million)
- Chart on China - Year-over-year growth 2024-2029 (%)
- Data Table on China - Year-over-year growth 2024-2029 (%)
- 12.10 Japan - Market size and forecast 2024-2029
- Chart on Japan - Market size and forecast 2024-2029 ($ million)
- Data Table on Japan - Market size and forecast 2024-2029 ($ million)
- Chart on Japan - Year-over-year growth 2024-2029 (%)
- Data Table on Japan - Year-over-year growth 2024-2029 (%)
- 12.11 Germany - Market size and forecast 2024-2029
- Chart on Germany - Market size and forecast 2024-2029 ($ million)
- Data Table on Germany - Market size and forecast 2024-2029 ($ million)
- Chart on Germany - Year-over-year growth 2024-2029 (%)
- Data Table on Germany - Year-over-year growth 2024-2029 (%)
- 12.12 India - Market size and forecast 2024-2029
- Chart on India - Market size and forecast 2024-2029 ($ million)
- Data Table on India - Market size and forecast 2024-2029 ($ million)
- Chart on India - Year-over-year growth 2024-2029 (%)
- Data Table on India - Year-over-year growth 2024-2029 (%)
- 12.13 UK - Market size and forecast 2024-2029
- Chart on UK - Market size and forecast 2024-2029 ($ million)
- Data Table on UK - Market size and forecast 2024-2029 ($ million)
- Chart on UK - Year-over-year growth 2024-2029 (%)
- Data Table on UK - Year-over-year growth 2024-2029 (%)
- 12.14 Canada - Market size and forecast 2024-2029
- Chart on Canada - Market size and forecast 2024-2029 ($ million)
- Data Table on Canada - Market size and forecast 2024-2029 ($ million)
- Chart on Canada - Year-over-year growth 2024-2029 (%)
- Data Table on Canada - Year-over-year growth 2024-2029 (%)
- 12.15 South Korea - Market size and forecast 2024-2029
- Chart on South Korea - Market size and forecast 2024-2029 ($ million)
- Data Table on South Korea - Market size and forecast 2024-2029 ($ million)
- Chart on South Korea - Year-over-year growth 2024-2029 (%)
- Data Table on South Korea - Year-over-year growth 2024-2029 (%)
- 12.16 France - Market size and forecast 2024-2029
- Chart on France - Market size and forecast 2024-2029 ($ million)
- Data Table on France - Market size and forecast 2024-2029 ($ million)
- Chart on France - Year-over-year growth 2024-2029 (%)
- Data Table on France - Year-over-year growth 2024-2029 (%)
- 12.17 Italy - Market size and forecast 2024-2029
- Chart on Italy - Market size and forecast 2024-2029 ($ million)
- Data Table on Italy - Market size and forecast 2024-2029 ($ million)
- Chart on Italy - Year-over-year growth 2024-2029 (%)
- Data Table on Italy - Year-over-year growth 2024-2029 (%)
- 12.18 Market opportunity By Geographical Landscape
- Market opportunity By Geographical Landscape ($ million)
- Data Tables on Market opportunity By Geographical Landscape ($ million)
13 Drivers, Challenges, and Opportunity/Restraints
- 13.1 Market drivers
- 13.2 Market challenges
- 13.3 Impact of drivers and challenges
- Impact of drivers and challenges in 2024 and 2029
- 13.4 Market opportunities/restraints
14 Competitive Landscape
- 14.1 Overview
- 14.2 Competitive Landscape
- Overview on criticality of inputs and factors of differentiation
- 14.3 Landscape disruption
- Overview on factors of disruption
- 14.4 Industry risks
- Impact of key risks on business
15 Competitive Analysis
- 15.1 Companies profiled
- Companies covered
- 15.2 Company ranking index
- Company ranking index
- 15.3 Market positioning of companies
- Matrix on companies position and classification
- 15.4 Activision Blizzard Inc.
- Activision Blizzard Inc. - Overview
- Activision Blizzard Inc. - Business segments
- Activision Blizzard Inc. - Key news
- Activision Blizzard Inc. - Key offerings
- Activision Blizzard Inc. - Segment focus
- SWOT
- 15.5 Amazon.com Inc.
- Amazon.com Inc. - Overview
- Amazon.com Inc. - Business segments
- Amazon.com Inc. - Key news
- Amazon.com Inc. - Key offerings
- Amazon.com Inc. - Segment focus
- SWOT
- 15.6 Electronic Arts Inc.
- Electronic Arts Inc. - Overview
- Electronic Arts Inc. - Product / Service
- Electronic Arts Inc. - Key offerings
- SWOT
- 15.7 Gfinity Plc
- Gfinity Plc - Overview
- Gfinity Plc - Business segments
- Gfinity Plc - Key offerings
- Gfinity Plc - Segment focus
- SWOT
- 15.8 Hi Rez Studios Inc.
- Hi Rez Studios Inc. - Overview
- Hi Rez Studios Inc. - Product / Service
- Hi Rez Studios Inc. - Key offerings
- SWOT
- 15.9 Kabam Games Inc.
- Kabam Games Inc. - Overview
- Kabam Games Inc. - Product / Service
- Kabam Games Inc. - Key offerings
- SWOT
- 15.10 Modern Times Group MTG AB
- Modern Times Group MTG AB - Overview
- Modern Times Group MTG AB - Business segments
- Modern Times Group MTG AB - Key offerings
- Modern Times Group MTG AB - Segment focus
- SWOT
- 15.11 Nintendo Co. Ltd.
- Nintendo Co. Ltd. - Overview
- Nintendo Co. Ltd. - Product / Service
- Nintendo Co. Ltd. - Key offerings
- SWOT
- 15.12 Riot Games Inc.
- Riot Games Inc. - Overview
- Riot Games Inc. - Product / Service
- Riot Games Inc. - Key offerings
- SWOT
- 15.13 Rovio Entertainment Corp.
- Rovio Entertainment Corp. - Overview
- Rovio Entertainment Corp. - Business segments
- Rovio Entertainment Corp. - Key news
- Rovio Entertainment Corp. - Key offerings
- Rovio Entertainment Corp. - Segment focus
- SWOT
- 15.14 Starladder Ltd.
- Starladder Ltd. - Overview
- Starladder Ltd. - Product / Service
- Starladder Ltd. - Key offerings
- SWOT
- 15.15 Take Two Interactive Software Inc.
- Take Two Interactive Software Inc. - Overview
- Take Two Interactive Software Inc. - Product / Service
- Take Two Interactive Software Inc. - Key offerings
- SWOT
- 15.16 TaKeTV GmbH
- TaKeTV GmbH - Overview
- TaKeTV GmbH - Product / Service
- TaKeTV GmbH - Key offerings
- SWOT
- 15.17 Tencent Holdings Ltd.
- Tencent Holdings Ltd. - Overview
- Tencent Holdings Ltd. - Business segments
- Tencent Holdings Ltd. - Key news
- Tencent Holdings Ltd. - Key offerings
- Tencent Holdings Ltd. - Segment focus
- SWOT
- 15.18 Wargaming Group Ltd.
- Wargaming Group Ltd. - Overview
- Wargaming Group Ltd. - Product / Service
- Wargaming Group Ltd. - Key offerings
- SWOT
16 Appendix
- 16.1 Scope of the report
- 16.2 Inclusions and exclusions checklist
- Inclusions checklist
- Exclusions checklist
- 16.3 Currency conversion rates for US$
- Currency conversion rates for US$
- 16.4 Research methodology
- Research methodology
- 16.5 Data procurement
- Information sources
- 16.6 Data validation
- Data validation
- 16.7 Validation techniques employed for market sizing
- Validation techniques employed for market sizing
- 16.8 Data synthesis
- Data synthesis
- 16.9 360 degree market analysis
- 360 degree market analysis
- 16.10 List of abbreviations
- List of abbreviations

