|
|
市場調査レポート
商品コード
1654393
業務用食器の市場規模、シェア、動向分析レポート:製品別、流通チャネル別、地域別、セグメント予測、2025年~2030年Commercial Tableware Market Size, Share & Trends Analysis Report By Product (Dinnerware, Cutlery), By Distribution Channel (Offline, Online), By Region (North America, Europe, Asia Pacific, Latin America, MEA), And Segment Forecasts, 2025 - 2030 |
||||||

|
|||||||
カスタマイズ可能
|
|||||||


| 業務用食器の市場規模、シェア、動向分析レポート:製品別、流通チャネル別、地域別、セグメント予測、2025年~2030年 |
|
出版日: 2025年01月27日
発行: Grand View Research
ページ情報: 英文 80 Pages
納期: 2~10営業日
|

全表示
- 概要
- 図表
- 目次
業務用食器市場の成長と動向
世界の業務用食器市場規模は2030年に125億1,000万米ドルに達すると予測され、2025~2030年のCAGRは5.66%で成長すると予測されています。
外食産業やホスピタリティ産業の著しい発展に伴う食器の採用の高まりが、業務用セグメントにおける食器需要を大きく牽引しています。さらに、可処分所得の増加、ライフスタイルの変化、社交的な食事を促進する社会動向の増加が、業務用食器の需要増加に寄与しています。
レストランにおけるセルフサービスキオスクの進化は、業務用食器の大量導入につながりました。ホリデーパーティー、ビジネスミーティング、結婚式、その他の社交的な集まりなどのイベントでは、成人数に食事を提供する必要があり、ビュッフェシステムが理想的なサービスオプションであると考えられています。このようなシナリオにより、皿やボウル、カトラリーなどの食器類やその他のビュッフェ製品の採用が増加すると予想されます。
COVID-19の流行は、世界中で業務用食器の需要を大幅に減少させました。パンデミックの影響で、世界中で何十万人もの人々が家に引きこもるようになり、ピクニックやパーティー、祝賀会といったレジャー活動の発生率が大幅に低下しました。社会的な交流や集まりは停止し、少なくとも市場にとって大きな課題となっています。これは市場の成長に突然の衝撃を与えています。
新興経済諸国全体で都市化が急速に進んでいることが、業務用テーブルウェアの市場シナリオを好転させる顕著な要因となっています。これに伴い、オフィスビル、ホテル、小売店、ショッピングモール、病院、その他の商業インフラの建設に向けた各国の投資が増加しており、その結果、さまざまな種類の業務用食器に対する需要が高まっています。インドでは人口の一部がカナダや米国などの国へ移住する傾向が強まっており、これが北米地域の業務用食器に対する積極的な需要を生み出しています。これらの国々では、インド人向けのレストランやカフェ、小規模な飲食店をオープンする動向が目立っており、市場に多くの需要機会を生み出しています。
食器セグメントは2020年に最大の製品セグメントであり、57.6%の最大の収益シェアを占めました。食器皿セグメントは、特にアジア太平洋と北米地域における旅行・レジャー産業の増加により成長しています。最近、銅は不可欠な微量ミネラルであり、それに関連した健康上の利点があるという認識が広まり、銅食器が食器セグメントで牽引力を持つようになりました。オフラインの流通チャネルは2020年最大のセグメントで、その年の売上シェアは92.6%でした。
オフラインチャネルには、ハイパーマーケット/スーパー、コンビニエンスストア、専門店などが含まれます。また、オフライン流通チャネルセグメントは予測期間中に最も速い速度で成長すると予想されています。企業経営者は、ウェブサイトやeコマースプラットフォームよりも店舗の方が価格や商品の入手性が良いため、専門店やハイパーマーケットから直接購入します。企業経営者は特定タイプの店舗で買い物をするが、それは大量に購入するためであり、そのような店舗ではこれらの製品を最安値で購入できます。
業務用食器市場レポートのハイライト
- 製品別では、ディナーウェア部門が2024年に58.4%の収益シェアで世界の業務用食器産業を支配しました。
- 2024年の世界の業務用食器市場では、オフライン部門が最大の収益シェアを占めました。
- オンライン流通セグメントは予測期間中、緩やかな成長が見込まれます。
- カトラリーセグメントは2025~2030年にかけて大きな成長が見込まれます。
- 欧州は2024年に34.4%の収益シェアを占め、世界の業務用食器産業を支配しました。
目次
第1章 調査手法と範囲
第2章 エグゼクティブサマリー
第3章 業務用食器市場の変数、動向、範囲
- 市場系統の展望
- 親市場の展望
- 関連市場展望
- 産業バリューチェーン分析
- 利益率分析(産業レベル)
- 市場力学
- 市場促進要因分析
- 市場抑制要因分析
- 市場機会
- 市場課題
- 産業分析ツール
- ポーターのファイブフォース分析
- 市場参入戦略
第4章 消費者行動分析
- 人口統計分析
- 消費者の動向と嗜好
- 購入決定に影響を与える要因
- 消費者の原料採用
- 観察と推奨事項
第5章 業務用食器市場:製品別、推定・動向分析
- 業務用食器市場、製品別:主要ポイント
- 製品変動分析と市場シェア、2024年と2030年
- 製品別、2018~2030年
- 食器
- カトラリー
第6章 業務用食器市場:流通チャネル別、推定・動向分析
- 業務用食器市場、流通チャネル別:主要ポイント
- 流通チャネル変動分析と市場シェア、2024年と2030年
- 流通チャネル別、2018~2030年
- オフライン
- オンライン
第7章 業務用食器市場:地域別、推定・動向分析
- 業務用食器市場:地域別展望
- 地域市場:主要ポイント
- 地域別、2018~2030年
- 北米
- 欧州
- アジア太平洋
- ラテンアメリカ
- 中東
第8章 業務用食器市場:競合分析
- 主要市場参入企業による最近の動向と影響分析
- 企業分類
- 参入企業概要
- 原料ベンチマーク
- 企業市場シェア分析、2024年(%)
- 企業ヒートマップ分析
- 戦略マッピング
- 企業プロファイル
- Victorinox
- Cardinal International
- Churchill China (UK) Ltd.
- Steelite International Ltd.
- FISKARS GROUP
- Friedr. Dick GmbH &Co. KG
- Libbey
- Villeroy &Boch Group
- Royal Doulton
- Denby Pottery
List of Tables
- Table 1 Commercial tableware market: Key market driver analysis
- Table 2 Commercial tableware market: Key market restraint analysis
- Table 3 Global commercial tableware market estimates & forecast, by region (USD Million)
- Table 4 Global commercial tableware market estimates & forecast, by product (USD Million)
- Table 5 Global commercial tableware market estimates & forecast, by distribution channel (USD Million)
- Table 6 North America commercial tableware market estimates and forecast, by country, 2018 - 2030 (USD Million)
- Table 7 North America commercial tableware market estimates and forecast, by product, 2018 - 2030 (USD Million)
- Table 8 North America commercial tableware market estimates and forecast, by distribution channel, 2018 - 2030 (USD Million)
- Table 9 U.S. macro-economic outlay
- Table 10 U.S commercial tableware market estimates and forecast, by product, 2018 - 2030 (USD Million)
- Table 11 U.S commercial tableware market estimates and forecast, by distribution channel, 2018 - 2030 (USD Million)
- Table 12 Canada macro-economic outlay
- Table 13 Canada commercial tableware market estimates and forecast, by product, 2018 - 2030 (USD Million)
- Table 14 Canada commercial tableware market estimates and forecast, by distribution channel, 2018 - 2030 (USD Million)
- Table 15 Mexico macro-economic outlay
- Table 16 Mexico commercial tableware market estimates and forecast, by product, 2018 - 2030 (USD Million)
- Table 17 Mexico commercial tableware market estimates and forecast, by distribution channel, 2018 - 2030 (USD Million)
- Table 18 Europe commercial tableware market estimates and forecast, by country, 2018 - 2030 (USD Million)
- Table 19 Europe commercial tableware market estimates and forecast, by product, 2018 - 2030 (USD Million)
- Table 20 Europe commercial tableware market estimates and forecast, by distribution channel, 2018 - 2030 (USD Million)
- Table 21 Germany macro-economic outlay
- Table 22 Germany commercial tableware market estimates and forecast, by product, 2018 - 2030 (USD Million)
- Table 23 Germany commercial tableware market estimates and forecast, by distribution channel, 2018 - 2030 (USD Million)
- Table 24 U.K. macro-economic outlay
- Table 25 U.K. commercial tableware market estimates and forecast, by product, 2018 - 2030 (USD Million)
- Table 26 U.K. commercial tableware market estimates and forecast, by distribution channel, 2018 - 2030 (USD Million)
- Table 27 France macro-economic outlay
- Table 28 France commercial tableware market estimates and forecast, by product, 2018 - 2030 (USD Million)
- Table 29 France commercial tableware market estimates and forecast, by distribution channel, 2018 - 2030 (USD Million)
- Table 30 Italy macro-economic outlay
- Table 31 Italy commercial tableware market estimates and forecast, by product, 2018 - 2030 (USD Million)
- Table 32 Italy commercial tableware market estimates and forecast, by distribution channel, 2018 - 2030 (USD Million)
- Table 33 Spain macro-economic outlay
- Table 34 Spain commercial tableware market estimates and forecast, by product, 2018 - 2030 (USD Million)
- Table 35 Spain commercial tableware market estimates and forecast, by distribution channel, 2018 - 2030 (USD Million)
- Table 36 Asia Pacific commercial tableware market estimates and forecast, by country, 2018 - 2030 (USD Million)
- Table 37 Asia Pacific commercial tableware market estimates and forecast, by product, 2018 - 2030 (USD Million)
- Table 38 Asia Pacific commercial tableware market estimates and forecast, by distribution channel, 2018 - 2030 (USD Million)
- Table 39 China macro-economic outlay
- Table 40 China commercial tableware market estimates and forecast, by product, 2018 - 2030 (USD Million)
- Table 41 China commercial tableware market estimates and forecast, by distribution channel, 2018 - 2030 (USD Million)
- Table 42 India macro-economic outlay
- Table 43 India commercial tableware market estimates and forecast, by product, 2018 - 2030 (USD Million)
- Table 44 India commercial tableware market estimates and forecast, by distribution channel, 2018 - 2030 (USD Million)
- Table 45 South Korea macro-economic outlay
- Table 46 South Korea commercial tableware market estimates and forecast, by product, 2018 - 2030 (USD Million)
- Table 47 South Korea commercial tableware market estimates and forecast, by distribution channel, 2018 - 2030 (USD Million)
- Table 48 Japan macro-economic outlay
- Table 49 Japan commercial tableware market estimates and forecast, by product, 2018 - 2030 (USD Million)
- Table 50 Australia macro-economic outlay
- Table 51 Australia commercial tableware market estimates and forecast, by product, 2018 - 2030 (USD Million)
- Table 52 Australia commercial tableware market estimates and forecast, by distribution channel, 2018 - 2030 (USD Million)
- Table 53 Latin America commercial tableware market estimates and forecast, by country, 2018 - 2030 (USD Million)
- Table 54 Latin America commercial tableware market estimates and forecast, by product, 2018 - 2030 (USD Million)
- Table 55 Latin America commercial tableware market estimates and forecast, by distribution channel, 2018 - 2030 (USD Million)
- Table 56 Argentina macro-economic outlay
- Table 57 Argentina commercial tableware market estimates and forecast, by product, 2018 - 2030 (USD Million)
- Table 58 Argentina commercial tableware market estimates and forecast, by distribution channel, 2018 - 2030 (USD Million)
- Table 59 Middle East & Africa commercial tableware market estimates and forecast, by country, 2018 - 2030 (USD Million)
- Table 60 Middle East & Africa commercial tableware market estimates and forecast, by product, 2018 - 2030 (USD Million)
- Table 61 Middle East & Africa commercial tableware market estimates and forecast, by distribution channel, 2018 - 2030 (USD Million)
- Table 62 South Africa macro-economic outlay
- Table 63 South Africa commercial tableware market estimates and forecast, by product, 2018 - 2030 (USD Million)
- Table 64 South Africa commercial tableware market estimates and forecast, by distribution channel, 2018 - 2030 (USD Million)
- Table 65 Recent developments & impact analysis, by key market participants
- Table 66 Company market share, 2024 (%)
- Table 67 Company heat map analysis, 2024
- Table 68 Companies implementing key strategies
List of Figures
- Fig. 1 Commercial tableware market segmentation
- Fig. 2 Information procurement
- Fig. 3 Primary research pattern
- Fig. 4 Primary research approaches
- Fig. 5 Primary research process
- Fig. 6 Market snapshot
- Fig. 7 Segment snapshot
- Fig. 8 Regional snapshot
- Fig. 9 Competitive landscape snapshot
- Fig. 10 Global parent industry and commercial tableware market size (USD Million)
- Fig. 11 Global commercial tableware market size, 2018 to 2030 (USD Million)
- Fig. 12 Global commercial tableware market: Penetration & growth prospect mapping
- Fig. 13 Global commercial tableware market: Value chain analysis
- Fig. 14 Global commercial tableware market: Dynamics
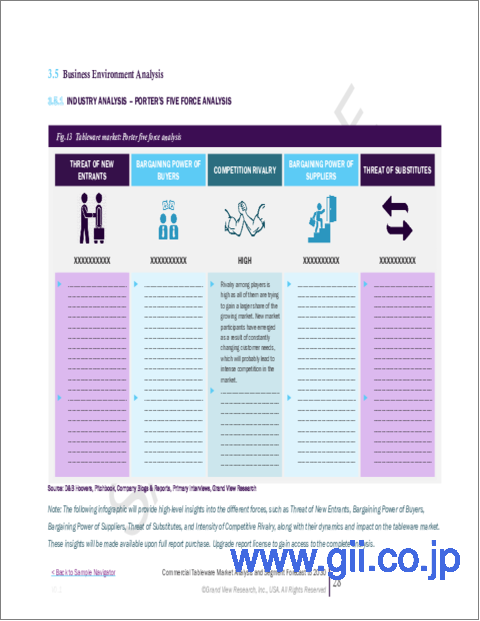
- Fig. 15 Global commercial tableware market: Porter's five forces analysis
- Fig. 16 Global commercial tableware market estimates & forecast, by product (USD Million)
- Fig. 17 Dinnerware market estimates & forecasts, 2018 - 2030 (USD Million)
- Fig. 18 Plates market estimates & forecasts, 2018 - 2030 (USD Million)
- Fig. 19 Bowls market estimates & forecasts, 2018 - 2030 (USD Million)
- Fig. 20 Cutlery market estimates & forecasts, 2018 - 2030 (USD Million)
- Fig. 21 Spoons market estimates & forecasts, 2018 - 2030 (USD Million)
- Fig. 22 Forks market estimates & forecasts, 2018 - 2030 (USD Million)
- Fig. 23 Knives market estimates & forecasts, 2018 - 2030 (USD Million)
- Fig. 24 Global commercial tableware market estimates & forecast, by distribution channel (USD Million)
- Fig. 25 Commercial tableware market estimates & forecast, for offline distribution channel 2018 - 2030 (USD Million)
- Fig. 26 Commercial tableware market estimates & forecast, for online food distribution channel 2018 - 2030 (USD Million)
- Fig. 27 Commercial tableware market: Regional outlook, 2024 & 2030 (USD Million)
- Fig. 28 Regional marketplace: Key takeaways
- Fig. 29 North America commercial tableware market estimates & forecast, 2018 - 2030 (USD Million)
- Fig. 30 U.S. commercial tableware market estimates & forecast, 2018 - 2030 (USD Million)
- Fig. 31 Canada commercial tableware market estimates & forecast, 2018 - 2030 (USD Million)
- Fig. 32 Mexico commercial tableware market estimates & forecast, 2018 - 2030 (USD Million)
- Fig. 33 Europe commercial tableware market estimates & forecast, 2018 - 2030 (USD Million)
- Fig. 34 Germany commercial tableware market estimates & forecast, 2018 - 2030 (USD Million)
- Fig. 35 U.K. commercial tableware market estimates & forecast, 2018 - 2030 (USD Million)
- Fig. 36 France commercial tableware market estimates & forecast, 2018 - 2030 (USD Million)
- Fig. 37 Italy commercial tableware market estimates & forecast, 2018 - 2030 (USD Million)
- Fig. 38 Spain commercial tableware market estimates & forecast, 2018 - 2030 (USD Million)
- Fig. 39 Asia Pacific commercial tableware market estimates & forecast, 2018 - 2030 (USD Million)
- Fig. 40 China commercial tableware market estimates & forecast, 2018 - 2030 (USD Million)
- Fig. 41 India commercial tableware market estimates & forecast, 2018 - 2030 (USD Million)
- Fig. 42 South Korea commercial tableware market estimates & forecast, 2018 - 2030 (USD Million)
- Fig. 43 Japan commercial tableware market estimates & forecast, 2018 - 2030 (USD Million)
- Fig. 44 Australia commercial tableware market estimates & forecast, 2018 - 2030 (USD Million)
- Fig. 45 Latin America commercial tableware market estimates & forecast, 2018 - 2030 (USD Million)
- Fig. 46 Argentina commercial tableware market estimates & forecast, 2018 - 2030 (USD Million)
- Fig. 47 Middle East commercial tableware market estimates & forecast, 2018 - 2030 (USD Million)
- Fig. 48 South Africa commercial tableware market estimates & forecast, 2018 - 2030 (USD Million)
- Fig. 49 Key company categorization
- Fig. 50 Company market share analysis, 2024
- Fig. 51 Strategic framework of commercial tableware
Commercial Tableware Market Growth & Trends:
The global commercial tableware market size is expected to reach USD 12.51 billion in 2030 and is projected to grow at a CAGR of 5.66% from 2025 to 2030. The rising adoption of serving ware with significant development in the foodservice and hospitality industry has been significantly driving the demand for tableware in the commercial sector. Moreover, rising disposable incomes, changing lifestyles, and increasing social trends promoting social dining have contributed to an upswing in the demand for commercial tableware.
The evolution of self-service kiosks in restaurants has resulted in the growing adoption of commercial tableware in large numbers. Events such as holiday parties, business meetings, weddings, or any other social gatherings require feeding a large number of people, wherein a buffet system is considered to be the ideal service option. This scenario is expected to result in the growing adoption of a large number of serving ware such as plates and bowls and cutlery along with other buffet products.
The COVID-19 outbreak has decreased the demand for commercial tableware quite significantly across the globe. The pandemic has resulted in a stay-at-home situation for hundreds of thousands of people worldwide, which has significantly reduced the incidence of leisure activities, like picnics, parties, and celebrations. Social interaction and gathering have come to a halt or at least reduced by a huge margin posing a great challenge to the market. This has given a sudden jolt to the growth of the market.
Rapidly increasing urbanization across developing economies is a prominent factor leading to a positive market scenario for commercial tablewar. In line with this, growing investments by countries for the construction of office buildings, hotels, retail stores, malls, hospitals, and other commercial infrastructure will result in the demand for various kinds of commercial tableware. A rising section of the population in India has been shifting to countries such as Canada and the U.S., which has created a positive demand for commercial tableware in the North American region. The trend of opening restaurants, cafes, and small eateries that cater to Indians in these countries is gaining much prominence, creating numerous demand opportunities in the market.
The dinnerware segment was the largest product segment in 2020 and accounted for the largest revenue share of 57.6%. Dinnerware plates segment is growing owing to a rise in travel and leisure industries, especially in Asia Pacific and North America regions. In the recent past, there has been increasing awareness regarding copper as an essential trace mineral and its associated health benefits, which led to copperware gaining traction in the dinnerware segment. The offline distribution channel was the largest segment in 2020 and accounted for a revenue share of 92.6% that year.
The offline channel includes hypermarkets/supermarkets, convenience stores, and specialty stores. The offline distribution channel segment is also expected to grow at the fastest rate over the forecast period. Business owners directly buy from either specialty stores or hypermarkets as the price and product availability is better in a store than on websites or e-commerce platforms. Business owners shop from a specific kind of store because they purchase in large quantities and they can get the best price on these products at such stores.
Commercial Tableware Market Report Highlights:
- Based on products, the dinnerware segment dominated the global commercial tableware industry with a revenue share of 58.4% in 2024
- The offline segment held the largest revenue share of the global commercial tableware market in 2024
- The online distribution segment is expected to experience moderate growth during the forecast period
- The cutlery segment is expected to experience significant growth from 2025 to 2030
- Europe dominated the global commercial tableware industry, with a revenue share of 34.4% in 2024.
Table of Contents
Chapter 1. Methodology and Scope
- 1.1. Market Segmentation & Scope
- 1.2. Market Definition
- 1.3. Information Procurement
- 1.3.1. Purchased Database
- 1.3.2. GVR's Internal Database
- 1.3.3. Secondary Sources & Third-Party Perspectives
- 1.3.4. Primary Research
- 1.4. Information Analysis
- 1.4.1. Data Analysis Models
- 1.5. Market Formulation & Data Visualization
- 1.6. Data Validation & Publishing
Chapter 2. Executive Summary
- 2.1. Market Snapshot
- 2.2. Segment Snapshot
- 2.3. Competitive Landscape Snapshot
Chapter 3. Commercial Tableware Market Variables, Trends & Scope
- 3.1. Market Lineage Outlook
- 3.1.1. Parent Market Outlook
- 3.1.2. Related Market Outlook
- 3.2. Industry Value Chain Analysis
- 3.2.1. Profit Margin Analysis (Industry-level)
- 3.3. Market Dynamics
- 3.3.1. Market Driver Analysis
- 3.3.2. Market Restraint Analysis
- 3.3.3. Market Opportunities
- 3.3.4. Market Challenges
- 3.4. Industry Analysis Tools
- 3.4.1. Porter's Five Forces Analysis
- 3.5. Market Entry Strategies
Chapter 4. Consumer Behavior Analysis
- 4.1. Demographic Analysis
- 4.2. Consumer Trends and Preferences
- 4.3. Factors Affecting Buying Decision
- 4.4. Consumer Ingredient Adoption
- 4.5. Observations & Recommendations
Chapter 5. Commercial Tableware Market: Product Estimates & Trend Analysis
- 5.1. Commercial tableware Market, By Product: Key Takeaways
- 5.2. Product Movement Analysis & Market Share, 2024 & 2030
- 5.3. Market Estimates & Forecasts, By Product, 2018 - 2030 (USD Million)
- 5.3.1. Dinnerware
- 5.3.1.1. Market Estimates And Forecast, 2018 - 2030 (USD Million)
- 5.3.1.2. Plates
- 5.3.1.2.1. Market Estimates And Forecast, 2018 - 2030 (USD Million)
- 5.3.1.3. Bowls
- 5.3.1.3.1. Market Estimates And Forecast, 2018 - 2030 (USD Million)
- 5.3.2. Cutlery
- 5.3.2.1. Market Estimates And Forecast, 2018 - 2030 (USD Million)
- 5.3.2.2. Spoons
- 5.3.2.2.1. Market Estimates And Forecast, 2018 - 2030 (USD Million)
- 5.3.2.3. Forks
- 5.3.2.3.1. Market Estimates And Forecast, 2018 - 2030 (USD Million)
- 5.3.2.4. Knives
- 5.3.2.4.1. Market Estimates And Forecast, 2018 - 2030 (USD Million)
- 5.3.1. Dinnerware
Chapter 6. Commercial Tableware Market: Distribution Channel Estimates & Trend Analysis
- 6.1. Commercial Tableware Market, By Distribution Channel: Key Takeaways
- 6.2. Distribution Channel Movement Analysis & Market Share, 2024 & 2030
- 6.3. Market Estimates & Forecasts, by Distribution Channel, 2018 - 2030 (USD Million)
- 6.3.1. Offline
- 6.3.1.1. Market Estimates And Forecast, 2018 - 2030 (USD Million)
- 6.3.2. Online
- 6.3.2.1. Market Estimates And Forecast, 2018 - 2030 (USD Million)
- 6.3.1. Offline
Chapter 7. Commercial Tableware Market: Regional Estimates & Trend Analysis
- 7.1. Commercial Tableware Market: Regional Outlook
- 7.2. Regional Marketplaces: Key Takeaways
- 7.3. Market Estimates & Forecasts, by Region, 2018 - 2030 (USD Million)
- 7.3.1. North America
- 7.3.1.1. Market Estimates And Forecast, 2018 - 2030 (USD Million)
- 7.3.1.2. U.S.
- 7.3.1.2.1. Key Country Dynamics
- 7.3.1.2.2. Market Estimates And Forecast, 2018 - 2030 (USD Million)
- 7.3.1.3. Canada
- 7.3.1.3.1. Key Country Dynamics
- 7.3.1.3.2. Market Estimates And Forecast, 2018 - 2030 (USD Million)
- 7.3.1.4. Mexico
- 7.3.1.4.1. Key Country Dynamics
- 7.3.1.4.2. Market Estimates And Forecast, 2018 - 2030 (USD Million)
- 7.3.2. Europe
- 7.3.2.1. Market Estimates And Forecast, 2018 - 2030 (USD Million)
- 7.3.2.2. Germany
- 7.3.2.2.1. Key Country Dynamics
- 7.3.2.2.2. Market Estimates And Forecast, 2018 - 2030 (USD Million)
- 7.3.2.3. U.K.
- 7.3.2.3.1. Key Country Dynamics
- 7.3.2.3.2. Market Estimates And Forecast, 2018 - 2030 (USD Million)
- 7.3.2.4. France
- 7.3.2.4.1. Key Country Dynamics
- 7.3.2.4.2. Market Estimates And Forecast, 2018 - 2030 (USD Million)
- 7.3.2.5. Italy
- 7.3.2.5.1. Key Country Dynamics
- 7.3.2.5.2. Market Estimates And Forecast, 2018 - 2030 (USD Million)
- 7.3.2.6. Spain
- 7.3.2.6.1. Key Country Dynamics
- 7.3.2.6.2. Market Estimates And Forecast, 2018 - 2030 (USD Million)
- 7.3.3. Asia Pacific
- 7.3.3.1. Market Estimates And Forecast, 2018 - 2030 (USD Million)
- 7.3.3.2. China
- 7.3.3.2.1. Key Country Dynamics
- 7.3.3.2.2. Market Estimates And Forecast, 2018 - 2030 (USD Million)
- 7.3.3.3. India
- 7.3.3.3.1. Key Country Dynamics
- 7.3.3.3.2. Market Estimates And Forecast, 2018 - 2030 (USD Million)
- 7.3.3.4. South Korea
- 7.3.3.4.1. Key Country Dynamics
- 7.3.3.4.2. Market Estimates And Forecast, 2018 - 2030 (USD Million)
- 7.3.3.5. Japan
- 7.3.3.5.1. Key Country Dynamics
- 7.3.3.5.2. Market Estimates And Forecast, 2018 - 2030 (USD Million)
- 7.3.3.6. Australia
- 7.3.3.6.1. Key Country Dynamics
- 7.3.3.6.2. Market Estimates And Forecast, 2018 - 2030 (USD Million)
- 7.3.4. Latin America
- 7.3.4.1. Market Estimates And Forecast, 2018 - 2030 (USD Million)
- 7.3.4.2. Argentina
- 7.3.4.2.1. Key Country Dynamics
- 7.3.4.2.2. Market Estimates And Forecast, 2018 - 2030 (USD Million)
- 7.3.5. Middle East
- 7.3.5.1. Market Estimates And Forecast, 2018 - 2030 (USD Million)
- 7.3.5.2. South Africa
- 7.3.5.2.1. Key Country Dynamics
- 7.3.5.2.2. Market Estimates And Forecast, 2018 - 2030 (USD Million)
- 7.3.1. North America
Chapter 8. Commercial Tableware Market: Competitive Analysis
- 8.1. Recent Developments & Impact Analysis, By Key Market Participants
- 8.2. Company Categorization
- 8.3. Participant's Overview
- 8.4. Financial Performance
- 8.5. Ingredient Benchmarking
- 8.6. Company Market Share Analysis, 2024 (%)
- 8.7. Company Heat Map Analysis
- 8.8. Strategy Mapping
- 8.9. Company Profiles
- 8.9.1. Victorinox
- 8.9.1.1. Company Overview
- 8.9.1.2. Financial Performance
- 8.9.1.3. Ingredient Portfolios
- 8.9.1.4. Strategic Initiatives
- 8.9.2. Cardinal International
- 8.9.2.1. Company Overview
- 8.9.2.2. Financial Performance
- 8.9.2.3. Ingredient Portfolios
- 8.9.2.4. Strategic Initiatives
- 8.9.3. Churchill China (UK) Ltd.
- 8.9.3.1. Company Overview
- 8.9.3.2. Financial Performance
- 8.9.3.3. Ingredient Portfolios
- 8.9.3.4. Strategic Initiatives
- 8.9.4. Steelite International Ltd.
- 8.9.4.1. Company Overview
- 8.9.4.2. Financial Performance
- 8.9.4.3. Ingredient Portfolios
- 8.9.4.4. Strategic Initiatives
- 8.9.5. FISKARS GROUP
- 8.9.5.1. Company Overview
- 8.9.5.2. Financial Performance
- 8.9.5.3. Ingredient Portfolios
- 8.9.5.4. Strategic Initiatives
- 8.9.6. Friedr. Dick GmbH & Co. KG
- 8.9.6.1. Company Overview
- 8.9.6.2. Financial Performance
- 8.9.6.3. Ingredient Portfolios
- 8.9.6.4. Strategic Initiatives
- 8.9.7. Libbey
- 8.9.7.1. Company Overview
- 8.9.7.2. Financial Performance
- 8.9.7.3. Ingredient Portfolios
- 8.9.7.4. Strategic Initiatives
- 8.9.8. Villeroy & Boch Group
- 8.9.8.1. Company Overview
- 8.9.8.2. Financial Performance
- 8.9.8.3. Ingredient Portfolios
- 8.9.8.4. Strategic Initiatives
- 8.9.9. Royal Doulton
- 8.9.9.1. Company Overview
- 8.9.9.2. Financial Performance
- 8.9.9.3. Ingredient Portfolios
- 8.9.9.4. Strategic Initiatives
- 8.9.10. Denby Pottery
- 8.9.10.1. Company Overview
- 8.9.10.2. Financial Performance
- 8.9.10.3. Ingredient Portfolios
- 8.9.10.4. Strategic Initiatives
- 8.9.1. Victorinox

