|
|
市場調査レポート
商品コード
1575092
フォトマスクの市場規模、シェア、動向分析レポート:製品別、用途別、地域別、セグメント予測、2024年~2030年Photomask Market Size, Share & Trends Analysis Report By Product (Reticle, Master), By Application (Optical Devices, Discrete Components, Displays, MEMS), By Region (North America, Europe), And Segment Forecasts, 2024 - 2030 |
||||||
|
|||||||
カスタマイズ可能
|
|||||||

| フォトマスクの市場規模、シェア、動向分析レポート:製品別、用途別、地域別、セグメント予測、2024年~2030年 |
|
出版日: 2024年09月24日
発行: Grand View Research
ページ情報: 英文 109 Pages
納期: 2~10営業日
|

全表示
- 概要
- 図表
- 目次
フォトマスクの市場規模と動向:
フォトマスクの世界市場規模は2023年に51億1,000万米ドルと推定され、2024年から2030年にかけてCAGR 4.7%で成長すると予測されています。
この成長は、家電、自動車、通信などの産業が急成長し、半導体需要を牽引しているためです。フォトマスクは半導体製造において重要な役割を担っており、特に5G、人工知能(AI)、モノのインターネット(IoT)で使用されるチップに対する需要の高まりが製品成長の原動力となっています。
極端紫外線露光(EUV)などの先進リソグラフィ技術の開拓が、フォトマスク市場をさらに押し上げています。EUVは、先端プロセッサーやメモリーチップに使用されるノードの小さな次世代半導体の製造に不可欠です。さらに、テレビ、スマートフォン、ウェアラブル向けのOLEDやLCD技術を含む高解像度ディスプレイの人気が高まっていることも、フォトマスクの需要を押し上げています。ディスプレイ分野では、最先端のスクリーン技術を製造するために精密なフォトマスクが必要とされています。
フォトマスクの製造工程は非常に複雑で、特に微細な技術ノードでは厳しい精度が要求されるため、市場の成長に悪影響を及ぼす可能性があります。マスクに欠陥があると、半導体製造工程でコストのかかるエラーが発生する可能性があり、メーカーにとってはさらなる障害となります。さらに、フォトマスク市場の重要な抑制要因の1つは、特にEUVリソグラフィで使用される高度なフォトマスクの製造コストが高いことです。この技術には多額の投資が必要であり、特に中小の半導体メーカーにとっては、市場の拡大が制限される可能性があります。
自動車産業が電動化と自律走行に向かうにつれて、センサー、カメラ、制御ユニットなどの半導体部品の需要が高まっています。電気自動車(EV)、自律走行技術、先進運転支援システム(ADAS)の台頭により、自動車分野でのフォトマスクの使用は拡大しています。このため、フォトマスクメーカーにとっては、今後数年間、自動車分野での市場シェアを拡大するチャンスとなっています。
さらに、フォトマスク市場は、産業界全体で小型化された精密部品への需要が高まっているため、急成長しています。半導体、家電、自動車技術、通信の進歩が、光学デバイス、ディスクリート部品、ディスプレイ、MEMSにおけるフォトマスクの開発と必要性を後押ししています。これらの分野の継続的な技術革新と拡大は、フォトマスク市場を引き続き押し上げると予想されます。
目次
第1章 調査手法と範囲
第2章 エグゼクティブサマリー
第3章 フォトマスク市場の変数、動向、範囲
- 市場系統の見通し
- フォトマスク市場-バリューチェーン分析
- フォトマスク市場-市場力学
- 市場 促進要因分析
- 市場抑制要因分析
- 市場機会分析
- 市場課題分析
- 規制の枠組み
- フォトマスク市場- ビジネス環境分析
- PESTLE分析
- ポーターのファイブフォース分析
- 市場混乱分析
第4章 フォトマスク市場:製品の推定・動向分析
- 重要なポイント
- 製品変動分析と市場シェア、2023年と2030年
- フォトマスク市場:製品別、2018年-2030年
- レチクル
- マスター
- その他の製品
第5章 フォトマスク市場:用途の推定・動向分析
- 重要なポイント
- 用途変動分析と市場シェア、2023年と2030年
- フォトマスク市場:用途別、2018年~2030年
- ディスプレイ
- ディスプレイ別、2018年と2030年
- ディスクリートコンポーネント
- ディスクリートコンポーネント別、2018年および2030年
- 光学デバイス
- 光学デバイス別、2018年および2030年
- MEMS
- MEMS、2018年および2030年
- その他の用途
- その他の用途別、2018年および2030年
第6章 フォトマスク市場:地域の推定・動向分析
- 重要なポイント
- 地域別市場シェア分析、2023年および2030年
- 地域別、2018年-2030年
- 北米
- 北米フォトマスク市場の推定と予測、2018年および2030年
- 製品別、2018年および2030年
- 用途別、2018年と2030年
- 米国
- カナダ
- メキシコ
- 欧州
- 欧州のフォトマスク市場の推定と予測、2018年と2030年
- 製品別、2018年および2030年
- 用途別、2018年と2030年
- ドイツ
- 英国
- フランス
- スペイン
- イタリア
- アジア太平洋
- アジア太平洋フォトマスク市場の推定と予測、2018年および2030年
- 製品別、2018年および2030年
- 用途別、2018年と2030年
- 中国
- インド
- 日本
- 韓国
- 中南米
- 中南米フォトマスク市場の推定と予測、2018年と2030年
- 製品別、2018年および2030年
- 用途別、2018年と2030年
- ブラジル
- アルゼンチン
- 中東・アフリカ
- 中東およびアフリカのフォトマスク市場の推定と予測、2018年および2030年
- 製品別、2018年および2030年
- 用途別、2018年と2030年
第7章 サプライヤーインテリジェンス
- クラリッチマトリックス
- エンゲージメントモデル
- 交渉戦略
- 調達のベストプラクティス
- ベンダー選択基準
- 原材料サプライヤー一覧
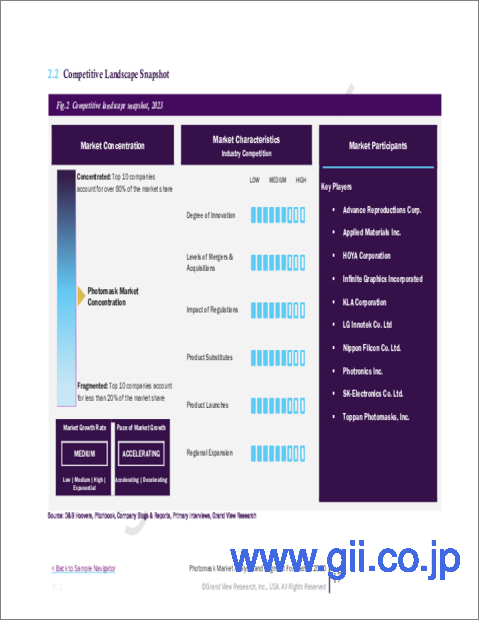
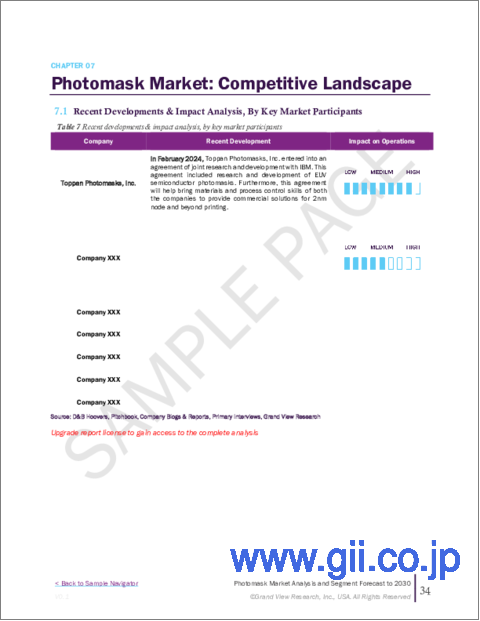
第8章 競合分析
- 主要市場参入企業による最近の動向と影響分析
- 企業分類
- 企業の市場ポジショニング
- 企業ヒートマップ分析
- 企業リスト
- Advance Reproductions Corp.
- Applied Materials Inc.
- HOYA Corporation
- Infinite Graphics Incorporated
- KLA Corporation
- LG Innotek Co. Ltd
- Toppan Photomasks, Inc.
- Nippon Filcon Co. Ltd.
- Photronics Inc.
- SK-Electronics Co. Ltd.
List of Tables
- Table 1 Photomask Market Estimates & Forecasts, by Reticle, 2018 & 2030 (USD Million)
- Table 2 Photomask Market Estimates & Forecasts, by Master, 2018 & 2030 (USD Million)
- Table 3 Photomask Market Estimates & Forecasts, by Other Products, 2018 & 2030 (USD Million)
- Table 4 Photomask Market Estimates & Forecasts, by Displays, 2018 & 2030 (USD Million)
- Table 5 Photomask Market Estimates & Forecasts, by Discrete Components, 2018 & 2030 (USD Million)
- Table 6 Photomask Market Estimates & Forecasts, by Optical Devices, 2018 & 2030 (USD Million)
- Table 7 Photomask Market Estimates & Forecasts, by MEMS, 2018 & 2030 (USD Million)
- Table 8 Photomask Market Estimates & Forecasts, by Other Application s, 2018 & 2030 (USD Million)
- Table 9 North America Photomask Market Estimates & Forecasts, 2018 & 2030 (USD Million)
- Table 10 North America Photomask Market Estimates & Forecasts, by Product, 2018 & 2030 (USD Million)
- Table 11 North America Photomask Market Estimates & Forecasts, by Application, 2018 & 2030 (USD Million)
- Table 12 U.S. Photomask Market Estimates & Forecasts, 2018 & 2030 (USD Million)
- Table 13 U.S. Photomask Market Estimates & Forecasts, by Product, 2018 & 2030 (USD Million)
- Table 14 U.S. Photomask Market Estimates & Forecasts, by Application, 2018 & 2030 (USD Million)
- Table 15 Canada Photomask Market Estimates & Forecasts, 2018 & 2030 (USD Million)
- Table 16 Canada Photomask Market Estimates & Forecasts, by Product, 2018 & 2030 (USD Million)
- Table 17 Canada Photomask Market Estimates & Forecasts, by Application, 2018 & 2030 (USD Million)
- Table 18 Mexico Photomask Market Estimates & Forecasts, 2018 & 2030 (USD Million)
- Table 19 Mexico Photomask Market Estimates & Forecasts, by Product, 2018 & 2030 (USD Million)
- Table 20 Mexico Photomask Market Estimates & Forecasts, by Application, 2018 & 2030 (USD Million)
- Table 21 Europe Photomask Market Estimates & Forecasts, 2018 & 2030 (USD Million)
- Table 22 Europe Photomask Market Estimates & Forecasts, by Product, 2018 & 2030 (USD Million)
- Table 23 Europe Photomask Market Estimates & Forecasts, by Application, 2018 & 2030 (USD Million)
- Table 24 Germany Photomask Market Estimates & Forecasts, 2018 & 2030 (USD Million)
- Table 25 Germany Photomask Market Estimates & Forecasts, by Product, 2018 & 2030 (USD Million)
- Table 26 Germany Photomask Market Estimates & Forecasts, by Application, 2018 & 2030 (USD Million)
- Table 27 UK Photomask Market Estimates & Forecasts, 2018 & 2030 (USD Million)
- Table 28 UK Photomask Market Estimates & Forecasts, by Product, 2018 & 2030 (USD Million)
- Table 29 UK Photomask Market Estimates & Forecasts, by Application, 2018 & 2030 (USD Million)
- Table 30 France Photomask Market Estimates & Forecasts, 2018 & 2030 (USD Million)
- Table 31 France Photomask Market Estimates & Forecasts, by Product, 2018 & 2030 (USD Million)
- Table 32 France Photomask Market Estimates & Forecasts, by Application, 2018 & 2030 (USD Million)
- Table 33 Spain Photomask Market Estimates & Forecasts, 2018 & 2030 (USD Million)
- Table 34 Spain Photomask Market Estimates & Forecasts, by Product, 2018 & 2030 (USD Million)
- Table 35 Spain Photomask Market Estimates & Forecasts, by Application, 2018 & 2030 (USD Million)
- Table 36 Italy Photomask Market Estimates & Forecasts, 2018 & 2030 (USD Million)
- Table 37 Italy Photomask Market Estimates & Forecasts, by Product, 2018 & 2030 (USD Million)
- Table 38 Italy Photomask Market Estimates & Forecasts, by Application, 2018 & 2030 (USD Million)
- Table 39 Asia Pacific Photomask Market Estimates & Forecasts, 2018 & 2030 (USD Million)
- Table 40 Asia Pacific Photomask Market Estimates & Forecasts, by Product, 2018 & 2030 (USD Million)
- Table 41 Asia Pacific Photomask Market Estimates & Forecasts, by Application, 2018 & 2030 (USD Million)
- Table 42 China Photomask Market Estimates & Forecasts, 2018 & 2030 (USD Million)
- Table 43 China Photomask Market Estimates & Forecasts, by Product, 2018 & 2030 (USD Million)
- Table 44 China Photomask Market Estimates & Forecasts, by Application, 2018 & 2030 (USD Million)
- Table 45 India Photomask Market Estimates & Forecasts, 2018 & 2030 (USD Million)
- Table 46 India Photomask Market Estimates & Forecasts, by Product, 2018 & 2030 (USD Million)
- Table 47 India Photomask Market Estimates & Forecasts, by Application, 2018 & 2030 (USD Million)
- Table 48 Japan Photomask Market Estimates & Forecasts, 2018 & 2030 (USD Million)
- Table 49 Japan Photomask Market Estimates & Forecasts, by Product, 2018 & 2030 (USD Million)
- Table 50 Japan Photomask Market Estimates & Forecasts, by Application, 2018 & 2030 (USD Million)
- Table 51 South Korea Photomask Market Estimates & Forecasts, 2018 & 2030 (USD Million)
- Table 52 South Korea Photomask Market Estimates & Forecasts, by Product, 2018 & 2030 (USD Million)
- Table 53 South Korea Photomask Market Estimates & Forecasts, by Application, 2018 & 2030 (USD Million)
- Table 54 Central & South America Photomask Market Estimates & Forecasts, 2018 & 2030 (USD Million)
- Table 55 Central & South America Photomask Market Estimates & Forecasts, by Product, 2018 & 2030 (USD Million)
- Table 56 Central & South America Photomask Market Estimates & Forecasts, by Application, 2018 & 2030 (USD Million)
- Table 57 Brazil Photomask Market Estimates & Forecasts, 2018 & 2030 (USD Million)
- Table 58 Brazil Photomask Market Estimates & Forecasts, by Product, 2018 & 2030 (USD Million)
- Table 59 Brazil Photomask Market Estimates & Forecasts, by Application, 2018 & 2030 (USD Million)
- Table 60 Argentina Photomask Market Estimates & Forecasts, 2018 & 2030 (USD Million)
- Table 61 Argentina Photomask Market Estimates & Forecasts, by Product, 2018 & 2030 (USD Million)
- Table 62 Argentina Photomask Market Estimates & Forecasts, by Application, 2018 & 2030 (USD Million)
- Table 63 Middle East & Africa Photomask Market Estimates & Forecasts, 2018 & 2030 (USD Million)
- Table 64 Middle East & Africa Photomask Market Estimates & Forecasts, by Product, 2018 & 2030 (USD Million)
- Table 65 Middle East & Africa Photomask Market Estimates & Forecasts, by Application, 2018 & 2030 (USD Million)
List of Figures
- Fig. 1 Information Procurement
- Fig. 2 Primary Research Pattern
- Fig. 3 Primary Research Process
- Fig. 4 Market Research Approaches - Bottom-Up Approach
- Fig. 5 Market Research Approaches - Top-Down Approach
- Fig. 6 Market Research Approaches - Combined Approach
- Fig. 7 Market Snapshot
- Fig. 8 Segmental Outlook
- Fig. 9 Competitive Outlook
- Fig. 10 Photomask Market - Value Chain Analysis
- Fig. 11 Photomask Market - Sales Channel Analysis
- Fig. 12 Market Drivers Impact Analysis
- Fig. 13 Market Restraint Impact Analysis
- Fig. 14 Industry Analysis - PORTERS
- Fig. 15 Industry Analysis - PESTEL
- Fig. 16 Product: Key Takeaways
- Fig. 17 Product: Market Share, 2023 & 2030
- Fig. 18 Application: Key Takeaways
- Fig. 19 Application: Market Share, 2023 & 2030
- Fig. 20 Region, 2023 & 2030 (USD Million)
- Fig. 21 Regional Marketplace: Key Takeaways
- Fig. 22 Kraljic Matrix
- Fig. 23 Engagement Model
- Fig. 24 Sourcing Best Practices
- Fig. 25 Sourcing Best Practices
- Fig. 26 Competition Categorization
- Fig. 27 Company Market Positioning
- Fig. 28 Strategy Mapping, 2023
Photomask Market Size & Trends:
The global photomask market size was estimated at USD 5.11 billion in 2023 and is estimated to grow at a CAGR of 4.7% from 2024 to 2030. This growth is attributed to the rapid growth in industries like consumer electronics, automotive, and telecommunications which is driving the demand for semiconductors, hence fueling the market growth. Photomasks play a critical role in semiconductor fabrication, and this rising demand, especially for chips used in 5G, artificial intelligence (AI), and the Internet of Things (IoT), is driving product growth.
The development of advanced lithography techniques, such as Extreme Ultraviolet Lithography (EUV), is further boosting the photomask market. EUV is essential for manufacturing next-generation semiconductors with smaller nodes, which are used in advanced processors and memory chips. Additionally, increasing popularity of high-resolution displays, including OLED and LCD technologies for televisions, smartphones, and wearables, is driving demand for photomasks. The display sector requires precise photomasks for manufacturing cutting-edge screen technologies.
The manufacturing process of photomasks, especially for smaller technology nodes, is highly complex and requires stringent precision, which may negatively impact the market growth. Any defects in the masks can lead to costly errors in semiconductor production process, creating additional hurdles for manufacturers. Furthermore, one of the significant restraints in photomask market is the high cost of producing advanced photomasks, particularly those used in EUV lithography. The technology requires significant investment, which can limit market expansion, especially among smaller semiconductor manufacturers.
As the automotive industry moves toward electrification and autonomous driving, the demand for semiconductor components, such as sensors, cameras, and control units, is rising. The rise of electric vehicles (EVs), autonomous driving technologies, and advanced driver assistance systems (ADAS) have expanded the use of photomasks in the automotive sector. This presents an opportunity for photomask producers to expand their market share in the automotive sector over coming years.
Furthermore, photomask market is growing rapidly due to increasing demand for miniaturized and precise components across industries. Advancements in semiconductors, consumer electronics, automotive technologies, and telecommunications are driving the development and need for photomasks in optical devices, discrete components, displays, and MEMS. The ongoing innovations and expansion of these sectors are expected to continue pushing the photomask market forward.
Global Photomask Market Report Segmentation
This report forecasts revenue growth at global, regional & country levels and provides an analysis of the latest industry trends in each of the segments from 2018 to 2030. For this study, Grand View Research has segmented the global photomask market report on the basis of product, application, and region:
- Product Outlook (Revenue, USD Million, 2018 - 2030)
- Reticle
- Master
- Other Products
- Application Outlook (Revenue, USD Million, 2018 - 2030)
- Displays
- Discrete Components
- Optical Devices
- MEMS
- Other Applications
- Regional Outlook (Revenue, USD Million, 2018 - 2030)
- North America
- U.S.
- Canada
- Mexico
- Europe
- Germany
- UK
- France
- Italy
- Spain
- Asia Pacific
- China
- Japan
- India
- South Korea
- Central & South America
- Brazil
- Argentina
- Middle East & Africa
Table of Contents
Chapter 1. Methodology and Scope
- 1.1. Research Methodology
- 1.2. Research Scope & Assumption
- 1.3. Information Procurement
- 1.3.1. Purchased Database
- 1.3.2. GVR's Internal Database
- 1.3.3. Secondary Sources & Third-Party Perspectives
- 1.3.4. Primary Research
- 1.4. Information Analysis
- 1.4.1. Data Analysis Models
- 1.5. Market Formulation & Data Visualization
- 1.6. List of Data Sources
Chapter 2. Executive Summary
- 2.1. Market Outlook, 2023 (USD Million)
- 2.2. Segmental Outlook
- 2.3. Competitive Insights
Chapter 3. Photomask Market Variables, Trends & Scope
- 3.1. Market Lineage Outlook
- 3.2. Photomask Market - Value Chain Analysis
- 3.3. Photomask Market - Market Dynamics
- 3.3.1. Market Driver Analysis
- 3.3.2. Market Restraint Analysis
- 3.3.3. Market Opportunity Analysis
- 3.3.4. Market Challenge Analysis
- 3.4. Regulatory Framework
- 3.5. Photomask Market - Business Environment Analysis
- 3.5.1. PESTLE Analysis
- 3.5.2. Porter's Five Forces Analysis
- 3.6. Market Disruption Analysis
Chapter 4. Photomask Market: Product Estimates & Trend Analysis
- 4.1. Key Takeaways
- 4.2. Product Movement Analysis & Market Share, 2023 & 2030
- 4.3. Photomask Market By Product, 2018 - 2030 (USD Million)
- 4.4. Reticle
- 4.4.1. Photomask Market Estimates & Forecasts, by Reticle, 2018 & 2030 (USD Million)
- 4.5. Master
- 4.5.1. Photomask Market Estimates & Forecasts, by Master, 2018 & 2030 (USD Million)
- 4.6. Other Products
- 4.6.1. Photomask Market Estimates & Forecasts, by Other Products, 2018 & 2030 (USD Million)
Chapter 5. Photomask Market: Application Estimates & Trend Analysis
- 5.1. Key Takeaways
- 5.2. Application Movement Analysis & Market Share, 2023 & 2030
- 5.3. Photomask Market By Application, 2018 - 2030 (USD Million)
- 5.4. Displays
- 5.4.1. Photomask Market Estimates & Forecasts, by Displays, 2018 & 2030 (USD Million)
- 5.5. Discrete Components
- 5.5.1. Photomask Market Estimates & Forecasts, by Discrete Components, 2018 & 2030 (USD Million)
- 5.6. Optical Devices
- 5.6.1. Photomask Market Estimates & Forecasts, by Optical Devices, 2018 & 2030 (USD Million)
- 5.7. MEMS
- 5.7.1. Photomask Market Estimates & Forecasts, by MEMS, 2018 & 2030 (USD Million)
- 5.8. Other Applications
- 5.8.1. Photomask Market Estimates & Forecasts, by Other Applications, 2018 & 2030 (USD Million)
Chapter 6. Photomask Market: Regional Estimates & Trend Analysis
- 6.1. Key Takeaways
- 6.2. Regional Market Share Analysis, 2023 & 2030
- 6.3. Market Estimates & Forecasts by Region, 2018 - 2030 (USD Million)
- 6.4. North America
- 6.4.1. North America Photomask Market Estimates & Forecasts, 2018 & 2030 (USD Million)
- 6.4.2. North America Photomask Market Estimates & Forecasts, by Product, 2018 & 2030 (USD Million)
- 6.4.3. North America Photomask Market Estimates & Forecasts, by Application, 2018 & 2030 (USD Million)
- 6.4.4. U.S.
- 6.4.4.1. U.S. Photomask Market Estimates & Forecasts, 2018 & 2030 (USD Million)
- 6.4.4.2. U.S. Photomask Market Estimates & Forecasts, by Product, 2018 & 2030 (USD Million)
- 6.4.4.3. U.S. Photomask Market Estimates & Forecasts, by Application, 2018 & 2030 (USD Million)
- 6.4.5. Canada
- 6.4.5.1. Canada Photomask Market Estimates & Forecasts, 2018 & 2030 (USD Million)
- 6.4.5.2. Canada Photomask Market Estimates & Forecasts, by Product, 2018 & 2030 (USD Million)
- 6.4.5.3. Canada Photomask Market Estimates & Forecasts, by Application, 2018 & 2030 (USD Million)
- 6.4.6. Mexico
- 6.4.6.1. Mexico Photomask Market Estimates & Forecasts, 2018 & 2030 (USD Million)
- 6.4.6.2. Mexico Photomask Market Estimates & Forecasts, by Product, 2018 & 2030 (USD Million)
- 6.4.6.3. Mexico Photomask Market Estimates & Forecasts, by Application, 2018 & 2030 (USD Million)
- 6.5. Europe
- 6.5.1. Europe Photomask Market Estimates & Forecasts, 2018 & 2030 (USD Million)
- 6.5.2. Europe Photomask Market Estimates & Forecasts, by Product, 2018 & 2030 (USD Million)
- 6.5.3. Europe Photomask Market Estimates & Forecasts, by Application, 2018 & 2030 (USD Million)
- 6.5.4. Germany
- 6.5.4.1. Germany Photomask Market Estimates & Forecasts, 2018 & 2030 (USD Million)
- 6.5.4.2. Germany Photomask Market Estimates & Forecasts, by Product, 2018 & 2030 (USD Million)
- 6.5.4.3. Germany Photomask Market Estimates & Forecasts, by Application, 2018 & 2030 (USD Million)
- 6.5.5. UK
- 6.5.5.1. UK Photomask Market Estimates & Forecasts, 2018 & 2030 (USD Million)
- 6.5.5.2. UK Photomask Market Estimates & Forecasts, by Product, 2018 & 2030 (USD Million)
- 6.5.5.3. UK Photomask Market Estimates & Forecasts, by Application, 2018 & 2030 (USD Million)
- 6.5.6. France
- 6.5.6.1. France Photomask Market Estimates & Forecasts, 2018 & 2030 (USD Million)
- 6.5.6.2. France Photomask Market Estimates & Forecasts, by Product, 2018 & 2030 (USD Million)
- 6.5.6.3. France Photomask Market Estimates & Forecasts, by Application, 2018 & 2030 (USD Million)
- 6.5.7. Spain
- 6.5.7.1. Spain Photomask Market Estimates & Forecasts, 2018 & 2030 (USD Million)
- 6.5.7.2. Spain Photomask Market Estimates & Forecasts, by Product, 2018 & 2030 (USD Million)
- 6.5.7.3. Spain Photomask Market Estimates & Forecasts, by Application, 2018 & 2030 (USD Million)
- 6.5.8. Italy
- 6.5.8.1. Italy Photomask Market Estimates & Forecasts, 2018 & 2030 (USD Million)
- 6.5.8.2. Italy Photomask Market Estimates & Forecasts, by Product, 2018 & 2030 (USD Million)
- 6.5.8.3. Italy Photomask Market Estimates & Forecasts, by Application, 2018 & 2030 (USD Million)
- 6.6. Asia Pacific
- 6.6.1. Asia Pacific Photomask Market Estimates & Forecasts, 2018 & 2030 (USD Million)
- 6.6.2. Asia Pacific Photomask Market Estimates & Forecasts, by Product, 2018 & 2030 (USD Million)
- 6.6.3. Asia Pacific Photomask Market Estimates & Forecasts, by Application, 2018 & 2030 (USD Million)
- 6.6.4. China
- 6.6.4.1. China Photomask Market Estimates & Forecasts, 2018 & 2030 (USD Million)
- 6.6.4.2. China Photomask Market Estimates & Forecasts, by Product, 2018 & 2030 (USD Million)
- 6.6.4.3. China Photomask Market Estimates & Forecasts, by Application, 2018 & 2030 (USD Million)
- 6.6.5. India
- 6.6.5.1. India Photomask Market Estimates & Forecasts, 2018 & 2030 (USD Million)
- 6.6.5.2. India Photomask Market Estimates & Forecasts, by Product, 2018 & 2030 (USD Million)
- 6.6.5.3. India Photomask Market Estimates & Forecasts, by Application, 2018 & 2030 (USD Million)
- 6.6.6. Japan
- 6.6.6.1. Japan Photomask Market Estimates & Forecasts, 2018 & 2030 (USD Million)
- 6.6.6.2. Japan Photomask Market Estimates & Forecasts, by Product, 2018 & 2030 (USD Million)
- 6.6.6.3. Japan Photomask Market Estimates & Forecasts, by Application, 2018 & 2030 (USD Million)
- 6.6.7. South Korea
- 6.6.7.1. South Korea Photomask Market Estimates & Forecasts, 2018 & 2030 (USD Million)
- 6.6.7.2. South Korea Photomask Market Estimates & Forecasts, by Product, 2018 & 2030 (USD Million)
- 6.6.7.3. South Korea Photomask Market Estimates & Forecasts, by Application, 2018 & 2030 (USD Million)
- 6.7. Central & South America
- 6.7.1. Central & South America Photomask Market Estimates & Forecasts, 2018 & 2030 (USD Million)
- 6.7.2. Central & South America Photomask Market Estimates & Forecasts, by Product, 2018 & 2030 (USD Million)
- 6.7.3. Central & South America Photomask Market Estimates & Forecasts, by Application, 2018 & 2030 (USD Million)
- 6.7.4. Brazil
- 6.7.4.1. Brazil Photomask Market Estimates & Forecasts, 2018 & 2030 (USD Million)
- 6.7.4.2. Brazil Photomask Market Estimates & Forecasts, by Product, 2018 & 2030 (USD Million)
- 6.7.4.3. Brazil Photomask Market Estimates & Forecasts, by Application, 2018 & 2030 (USD Million)
- 6.7.5. Argentina
- 6.7.5.1. Argentina Photomask Market Estimates & Forecasts, 2018 & 2030 (USD Million)
- 6.7.5.2. Argentina Photomask Market Estimates & Forecasts, by Product, 2018 & 2030 (USD Million)
- 6.7.5.3. Argentina Photomask Market Estimates & Forecasts, by Application, 2018 & 2030 (USD Million)
- 6.8. Middle East & Africa
- 6.8.1. Middle East & Africa Photomask Market Estimates & Forecasts, 2018 & 2030 (USD Million)
- 6.8.2. Middle East & Africa Photomask Market Estimates & Forecasts, by Product, 2018 & 2030 (USD Million)
- 6.8.3. Middle East & Africa Photomask Market Estimates & Forecasts, by Application, 2018 & 2030 (USD Million)
Chapter 7. Supplier Intelligence
- 7.1. Kraljic Matrix
- 7.2. Engagement Model
- 7.3. Negotiation Strategies
- 7.4. Sourcing Best Practices
- 7.5. Vendor Selection Criteria
- 7.6. List of Raw Material Suppliers
Chapter 8. Competitive Analysis
- 8.1. Recent Developments & Impact Analysis, By Key Market Participants
- 8.2. Company Categorization
- 8.3. Company Market Positioning
- 8.4. Company Heat Map Analysis
- 8.5. Company Listings
- 8.5.1. Advance Reproductions Corp.
- 8.5.1.1. Company Overview
- 8.5.1.2. Financial Performance
- 8.5.1.3. Product Benchmarking
- 8.5.1.4. Strategic Initiatives
- 8.5.2. Applied Materials Inc.
- 8.5.2.1. Company Overview
- 8.5.2.2. Financial Performance
- 8.5.2.3. Product Benchmarking
- 8.5.2.4. Strategic Initiatives
- 8.5.3. HOYA Corporation
- 8.5.3.1. Company Overview
- 8.5.3.2. Financial Performance
- 8.5.3.3. Product Benchmarking
- 8.5.3.4. Strategic Initiatives
- 8.5.4. Infinite Graphics Incorporated
- 8.5.4.1. Company Overview
- 8.5.4.2. Financial Performance
- 8.5.4.3. Product Benchmarking
- 8.5.4.4. Strategic Initiatives
- 8.5.5. KLA Corporation
- 8.5.5.1. Company Overview
- 8.5.5.2. Financial Performance
- 8.5.5.3. Product Benchmarking
- 8.5.5.4. Strategic Initiatives
- 8.5.6. LG Innotek Co. Ltd
- 8.5.6.1. Company Overview
- 8.5.6.2. Financial Performance
- 8.5.6.3. Product Benchmarking
- 8.5.6.4. Strategic Initiatives
- 8.5.7. Toppan Photomasks, Inc.
- 8.5.7.1. Company Overview
- 8.5.7.2. Financial Performance
- 8.5.7.3. Product Benchmarking
- 8.5.7.4. Strategic Initiatives
- 8.5.8. Nippon Filcon Co. Ltd.
- 8.5.8.1. Company Overview
- 8.5.8.2. Financial Performance
- 8.5.8.3. Product Benchmarking
- 8.5.8.4. Strategic Initiatives
- 8.5.9. Photronics Inc.
- 8.5.9.1. Company Overview
- 8.5.9.2. Financial Performance
- 8.5.9.3. Product Benchmarking
- 8.5.9.4. Strategic Initiatives
- 8.5.10. SK-Electronics Co. Ltd.
- 8.5.10.1. Company Overview
- 8.5.10.2. Financial Performance
- 8.5.10.3. Product Benchmarking
- 8.5.10.4. Strategic Initiatives
- 8.5.1. Advance Reproductions Corp.
