|
|
市場調査レポート
商品コード
1433561
非代替性トークン市場規模、シェア、動向分析レポート:用途別、タイプ別、最終用途別、地域別、セグメント予測、2024年~2030年Non-fungible Token Market Size, Share & Trends Analysis Report By Application (Art, Sports), By Type (Physical Assets, Digital Assets), By End-use (Commercial, Personal), By Region, And Segment Forecasts, 2024 - 2030 |
||||||
|
|||||||
カスタマイズ可能
|
|||||||

| 非代替性トークン市場規模、シェア、動向分析レポート:用途別、タイプ別、最終用途別、地域別、セグメント予測、2024年~2030年 |
|
出版日: 2024年01月08日
発行: Grand View Research
ページ情報: 英文 150 Pages
納期: 2~10営業日
|

全表示
- 概要
- 図表
- 目次
非代替性トークン市場の成長と動向:
Grand View Research, Inc.の最新レポートによると、世界の非可換性トークンの市場規模は、2024年から2030年にかけて34.5%のCAGRを記録し、2030年には2,117億米ドルに達すると予測されています。
デジタルアートに対する世界の需要の高まりは、市場成長を促進する主な要因の1つです。デジタルアートは、デジタル技術を使用して展示または作成される芸術と定義されます。また、暗号通貨の世界の利用の拡大も市場成長を促進すると予測されています。これは、人々がデジタル資産を購入するために暗号通貨を使用するためです。CoinMarketCapによると、2022年2月現在、暗号通貨の世界総資本は1兆7,600億米ドルで、世界第8位の経済規模に相当します。非代替性トークン(NFT)企業の市場成長は、彼らが調達した多額の資金によってさらに支えられています。
2022年8月、非代替性トークンのCollective Proofは、コミュニティイベントの生中継の中で、シリーズA資金調達ラウンドで5,000万米ドルの調達に成功したと発表しました。a16zが主導したこの資金調達ラウンドには、Seven Seven Six、Collab+Currency、True Ventures、Flamingo DAO、SV Angel、VaynerFundなど著名な投資家が参加しました。この大規模な投資は、Proofが今後のNFTコレクションの発売を準備し、NFT市場での地位をさらに強固なものにするために行われました。COVID-19パンデミックはこの市場に好影響を与えました。パンデミックの間、人々は家に閉じこもり、収入源も制限されました。その結果、Axie GameのようなNFTベースのゲームプラットフォームが人気を博し、パンデミックの中で収入を得るのに役立ちました。
非代替性トークン市場レポートハイライト:
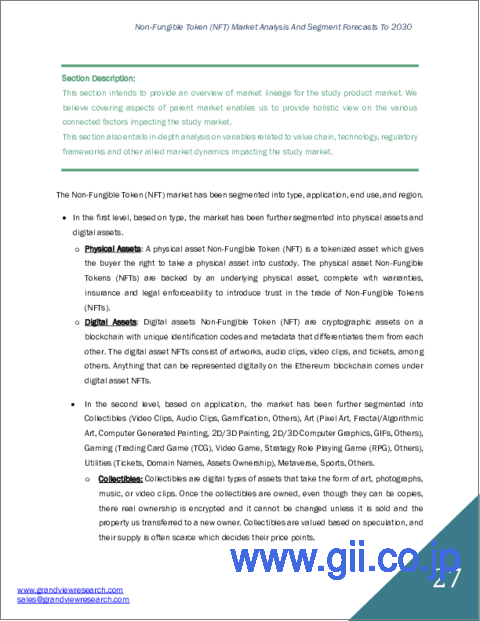
- デジタルアセットタイプのセグメントが2023年の市場を独占。アートNFTに対する需要の高まりは、アーティストが自分の作品に関連するすべての取引を監視できる機能に起因します。このトランザクション追跡機能により、アーティストは自分のデジタルアートに関わる各トランザクションに対する継続的なロイヤリティ支払いにアクセスしやすくなります。
- 2023年には、コレクターズアプリケーション分野が市場を独占しました。コレクターズアイテムは、多くの個人にとって幅広い魅力とノスタルジックな価値を持っています。バーチャルトレーディングカード、デジタルアート作品、バーチャルペットなど、ユニークなデジタルアイテムを所有するというコンセプトは、これらのアイテムの希少性や独占性を重視するコレクターや愛好家の共感を呼んでいます。
- 2024年から2030年までのCAGRは、商業用最終用途分野が最も早いと予想されます。NFTの需要は、さまざまな応用分野で取引の改善を可能にするため、企業の間で高まっています。
- 2023年の収益シェアは北米が圧倒的でした。米国やカナダなど北米諸国全体で暗号通貨の利用が拡大していることから、同地域で市場成長の新たな機会が生まれると期待されています。
- 2023年12月、国際サッカー連盟(FIFA)はブロックチェーンデータベースのプロバイダーであるModex社との協業を発表し、2023年クラブワールドカップに先立ち、実世界での実用性を備えた限定NFTコレクションシリーズを発表しました。
- FIFAによると、新しいNFTコレクションにより、ファンは競合からサッカーの歴史の一部を所有する機会を得ることができます。このような取り組みにより、製品の普及が進んでいます。
目次
第1章 調査手法と範囲
第2章 エグゼクティブサマリー
第3章 市場変数、動向、および範囲
- 市場イントロダクション/リネージュ展望
- 業界のバリューチェーン分析
- 市場力学
- 市場促進要因分析
- 市場課題の分析
- 市場機会分析
- 非代替性トークン(NFT)市場分析ツール
- ポーターの分析
- PESTEL分析
第4章 非代替性トークン(NFT)市場:タイプ別の推定・動向分析
- セグメントダッシュボード
- 非代替性トークン(NFT)市場:タイプ別の変動分析(2023年・2030年)
- 物理的資産
- デジタル資産
第5章 非代替性トークン(NFT)市場:用途別の推定・動向分析
- セグメントダッシュボード
- 非代替性トークン(NFT)市場:用途別の変動分析(2023年・2030年)
- 収集品
- 美術
- 収益推計と予測(2018年~2030年)
- ゲーム
- 収益推計と予測(2018年~2030年)
- 公共事業
- 収益推計と予測(2018年~2030年)
- メタバース
- スポーツ
- その他
第6章 非代替性トークン(NFT)市場:最終用途別の推定・動向分析
- セグメントダッシュボード
- 非代替性トークン(NFT)市場:最終用途別の変動分析(2023年・2030年)
- 個人
- 商業
第7章 非代替性トークン(NFT)市場:地域別の推定・動向分析
- 非代替性トークン(NFT)市場シェア:地域別(2023年・2030年)
- 北米
- 北米の非代替性トークン市場の推定と予測(2018年~2030年)
- 米国
- カナダ
- 欧州
- 欧州の非代替性トークン市場の推定と予測(2018年~2030年)
- 英国
- ドイツ
- フランス
- アジア太平洋地域
- アジア太平洋地域の非代替性トークン市場の推定と予測(2018年~2030年)
- 中国
- インド
- 日本
- 韓国
- オーストラリア
- ラテンアメリカ
- ラテンアメリカの非代替性トークン市場の推定と予測(2018年~2030年)
- ブラジル
- メキシコ
- 中東・アフリカ
- 中東・アフリカの非代替性トークン市場の推定と予測(2018年~2030年)
- サウジアラビア王国(KSA)
- アラブ首長国連邦
- 南アフリカ
第8章 競合情勢
- 主要市場参入企業による最近の動向と影響分析
- 企業の分類
- 企業の市場ポジショニング
- 企業の市場シェア分析
- 企業ヒートマップ分析
- 戦略マッピング
- 拡大
- 合併と買収
- パートナーシップとコラボレーション
- 新製品の発売
- 研究開発
- 企業プロファイル
- YellowHeart, LLC.
- Cloudflare, Inc.
- PLBY Group, Inc.
- Dolphin Entertainment, Inc.
- Funko
- Ozone Networks, Inc.
- Dolphin Entertainment, Inc.
- Dapper Labs, Inc.
- Gemini Trust Company, LLC.
- Onchain Labs, Inc.
List of Tables
- TABLE 1 Non-fungible token market, 2018 - 2030 (USD Million)
- TABLE 2 Global market estimates and forecasts, by region, 2018 - 2030 (USD Million)
- TABLE 3 Global market estimates and forecasts, by type, 2018 - 2030 (USD Million)
- TABLE 4 Global market estimates and forecasts, by application, 2018 - 2030 (USD Million)
- TABLE 5 Global market estimates and forecasts, by end-use, 2018 - 2030 (USD Million)
- TABLE 6 Physical asset non-fungible token market, by region, 2018 - 2030 (USD Million)
- TABLE 7 Digital asset non-fungible token market, by region, 2018 - 2030 (USD Million)
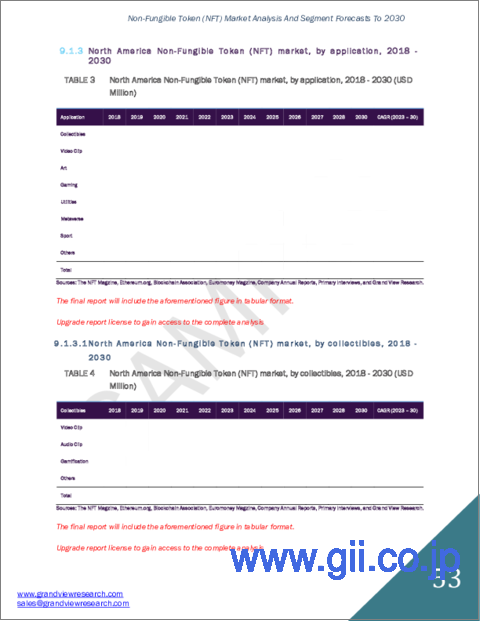
- TABLE 8 Collectibles non-fungible token market, by region, 2018 - 2030 (USD Million)
- TABLE 9 Video clip non-fungible token market, by region, 2018 - 2030 (USD Million)
- TABLE 10 Audio clip non-fungible token market, by region, 2018 - 2030 (USD Million)
- TABLE 11 Gamification non-fungible token market, by region, 2018 - 2030 (USD Million)
- TABLE 12 Others non-fungible token market, by region, 2018 - 2030 (USD Million)
- TABLE 13 Art non-fungible token market, by region, 2018 - 2030 (USD Million)
- TABLE 14 Pixel art non-fungible token market, by region, 2018 - 2030 (USD Million)
- TABLE 15 Fractal/algorithmic art non-fungible token market, by region, 2018 - 2030 (USD Million)
- TABLE 16 Computer generated painting non-fungible token market, by region, 2018 - 2030 (USD Million)
- TABLE 17 2D/3D painting non-fungible token market, by region, 2018 - 2030 (USD Million)
- TABLE 18 2D/3D computer graphics non-fungible token market, by region, 2018 - 2030 (USD Million)
- TABLE 19 GIFs non-fungible token market, by region, 2018 - 2030 (USD Million)
- TABLE 20 Others non-fungible token market, by region, 2018 - 2030 (USD Million)
- TABLE 21 Gaming non-fungible token market, by region, 2018 - 2030 (USD Million)
- TABLE 22 Trading Card Game (TCG) non-fungible token market, by region, 2018 - 2030 (USD Million)
- TABLE 23 Video Game non-fungible token market, by region, 2018 - 2030 (USD Million)
- TABLE 24 Strategy Role Playing Game (RPG) non-fungible token market, by region, 2018 - 2030 (USD Million)
- TABLE 25 Others non-fungible token market, by region, 2018 - 2030 (USD Million)
- TABLE 26 Utilities non-fungible token market, by region, 2018 - 2030 (USD Million)
- TABLE 27 Tickets non-fungible token market, by region, 2018 - 2030 (USD Million)
- TABLE 28 Domain names non-fungible token market, by region, 2018 - 2030 (USD Million)
- TABLE 29 Assets ownership non-fungible token market, by region, 2018 - 2030 (USD Million)
- TABLE 30 Metaverse non-fungible token market, by region, 2018 - 2030 (USD Million)
- TABLE 31 Sports non-fungible token market, by region, 2018 - 2030 (USD Million)
- TABLE 32 Others non-fungible token market, by region, 2018 - 2030 (USD Million)
- TABLE 33 Personal non-fungible token market, by region, 2018 - 2030 (USD Million)
- TABLE 34 Commercial non-fungible token market, by region, 2018 - 2030 (USD Million)
- TABLE 35 North America non-fungible token market market, by type, 2018 - 2030 (USD Million)
- TABLE 36 North America non-fungible token market market, by application, 2018 - 2030 (USD Million)
- TABLE 37 North America non-fungible token market market, by end-use, 2018 - 2030 (USD Million)
- TABLE 38 U.S. non-fungible token market market, by type, 2018 - 2030 (USD Million)
- TABLE 39 U.S. non-fungible token market market, by application, 2018 - 2030 (USD Million)
- TABLE 40 U.S. non-fungible token market market, by end-use, 2018 - 2030 (USD Million)
- TABLE 41 Canada non-fungible token market market, by type, 2018 - 2030 (USD Million)
- TABLE 42 Canada non-fungible token market market, by application, 2018 - 2030 (USD Million)
- TABLE 43 Canada non-fungible token market market, by end-use, 2018 - 2030 (USD Million)
- TABLE 44 Europe non-fungible token market market, by type, 2018 - 2030 (USD Million)
- TABLE 45 Europe non-fungible token market market, by application, 2018 - 2030 (USD Million)
- TABLE 46 Europe non-fungible token market market, by end-use, 2018 - 2030 (USD Million)
- TABLE 47 UK non-fungible token market market, by type, 2018 - 2030 (USD Million)
- TABLE 48 UK non-fungible token market market, by application, 2018 - 2030 (USD Million)
- TABLE 49 UK non-fungible token market market, by end-use, 2018 - 2030 (USD Million)
- TABLE 50 Germany non-fungible token market market, by type, 2018 - 2030 (USD Million)
- TABLE 51 Germany non-fungible token market market, by application, 2018 - 2030 (USD Million)
- TABLE 52 Germany non-fungible token market market, by end-use, 2018 - 2030 (USD Million)
- TABLE 53 France non-fungible token market market, by type, 2018 - 2030 (USD Million)
- TABLE 54 France non-fungible token market market, by application, 2018 - 2030 (USD Million)
- TABLE 55 France non-fungible token market market, by end-use, 2018 - 2030 (USD Million)
- TABLE 56 Asia Pacific non-fungible token market market, by type, 2018 - 2030 (USD Million)
- TABLE 57 Asia Pacific non-fungible token market market, by application, 2018 - 2030 (USD Million)
- TABLE 58 Asia Pacific non-fungible token market market, by end-use, 2018 - 2030 (USD Million)
- TABLE 59 China non-fungible token market market, by type, 2018 - 2030 (USD Million)
- TABLE 60 China non-fungible token market market, by application, 2018 - 2030 (USD Million)
- TABLE 61 China non-fungible token market market, by end-use, 2018 - 2030 (USD Million)
- TABLE 62 Japan non-fungible token market market, by type, 2018 - 2030 (USD Million)
- TABLE 63 Japan non-fungible token market market, by application, 2018 - 2030 (USD Million)
- TABLE 64 Japan non-fungible token market market, by end-use, 2018 - 2030 (USD Million)
- TABLE 65 India non-fungible token market market, by type, 2018 - 2030 (USD Million)
- TABLE 66 India non-fungible token market market, by application, 2018 - 2030 (USD Million)
- TABLE 67 India non-fungible token market market, by end-use, 2018 - 2030 (USD Million)
- TABLE 68 South Korea non-fungible token market market, by type, 2018 - 2030 (USD Million)
- TABLE 69 South Korea non-fungible token market market, by application, 2018 - 2030 (USD Million)
- TABLE 70 South Korea non-fungible token market market, by end-use, 2018 - 2030 (USD Million)
- TABLE 71 Australia non-fungible token market market, by type, 2018 - 2030 (USD Million)
- TABLE 72 Australia non-fungible token market market, by application, 2018 - 2030 (USD Million)
- TABLE 73 Australia non-fungible token market market, by end-use, 2018 - 2030 (USD Million)
- TABLE 74 Latin America non-fungible token market market, by type, 2018 - 2030 (USD Million)
- TABLE 75 Latin America non-fungible token market market, by application, 2018 - 2030 (USD Million)
- TABLE 76 Latin America non-fungible token market market, by end-use, 2018 - 2030 (USD Million)
- TABLE 77 Brazil non-fungible token market market, by type, 2018 - 2030 (USD Million)
- TABLE 78 Brazil non-fungible token market market, by application, 2018 - 2030 (USD Million)
- TABLE 79 Brazil non-fungible token market market, by end-use, 2018 - 2030 (USD Million)
- TABLE 80 Mexico non-fungible token market market, by type, 2018 - 2030 (USD Million)
- TABLE 81 Mexico non-fungible token market market, by application, 2018 - 2030 (USD Million)
- TABLE 82 Mexico non-fungible token market market, by end-use, 2018 - 2030 (USD Million)
- TABLE 83 Middle East & Africa non-fungible token market market, by type, 2018 - 2030 (USD Million)
- TABLE 84 Middle East & Africa non-fungible token market market, by application, 2018 - 2030 (USD Million)
- TABLE 85 Middle East & Africa non-fungible token market market, by end-use, 2018 - 2030 (USD Million)
- TABLE 86 Kingdom of Saudi Arabia (KSA) non-fungible token market market, by type, 2018 - 2030 (USD Million)
- TABLE 87 Kingdom of Saudi Arabia (KSA) non-fungible token market market, by application, 2018 - 2030 (USD Million)
- TABLE 88 Kingdom of Saudi Arabia (KSA) non-fungible token market market, by end-use, 2018 - 2030 (USD Million)
- TABLE 89 UAE non-fungible token market market, by type, 2018 - 2030 (USD Million)
- TABLE 90 UAE non-fungible token market market, by application, 2018 - 2030 (USD Million)
- TABLE 91 UAE non-fungible token market market, by end-use, 2018 - 2030 (USD Million)
- TABLE 92 South Africa non-fungible token market market, by type, 2018 - 2030 (USD Million)
- TABLE 93 South Africa non-fungible token market market, by application, 2018 - 2030 (USD Million)
- TABLE 94 South Africa non-fungible token market market, by end-use, 2018 - 2030 (USD Million)
- TABLE 95 Company Market Share, 2023
- TABLE 96 Company Heat Map Analysis
- TABLE 97 Key companies undergoing expansion
- TABLE 98 Key companies undergoing collaborations
- TABLE 99 Key companies undergoing new product launch
- TABLE 100 Key companies undergoing mergers & acquisitions
- TABLE 101 Key companies undergoung other strategies
List of Figures
- FIG. 1 Non-fungible token market segmentation
- FIG. 2 Information procurement
- FIG. 3 Data analysis models
- FIG. 4 Market formulation and valudation
- FIG. 5 Data validating & publishing
- FIG. 6 Market snapshot
- FIG. 7 Segment snapshot
- FIG. 8 Competitive landscape snapshot
- FIG. 9 Parent Market Value, 2023 (USD Million)
- FIG. 10 Non-fungible token market - Industry value chain analysis
- FIG. 11 Non-fungible token market dynamics
- FIG. 12 Non-fungible token market: Porters's analysis
- FIG. 13 Non-fungible token market: PESTEL analysis
- FIG. 14 Non-fungible token market, by type: key takeaways
- FIG. 15 Non-fungible token market, by type: market share, 2023 & 2030
- FIG. 16 Non-fungible token market estimates & forecasts, by physical asset, 2018 - 2030 (USD Million)
- FIG. 17 Non-fungible token market estimates & forecasts, by digital asset, 2018 - 2030 (USD Million)
- FIG. 18 Non-fungible token market, by application: key takeaways
- FIG. 19 Non-fungible token market, by application: market share, 2023 & 2030
- FIG. 20 Non-fungible token market estimates & forecasts, by collectibles, 2018 - 2030 (USD Million)
- FIG. 21 Non-fungible token market estimates & forecasts, by video clip, 2018 - 2030 (USD Million)
- FIG. 22 Non-fungible token market estimates & forecasts, by audio clip, 2018 - 2030 (USD Million)
- FIG. 23 Non-fungible token market estimates & forecasts, by gamification, 2018 - 2030 (USD Million)
- FIG. 24 Non-fungible token market estimates & forecasts, by others, 2018 - 2030 (USD Million)
- FIG. 25 Non-fungible token market estimates & forecasts, by art, 2018 - 2030 (USD Million)
- FIG. 26 Non-fungible token market estimates & forecasts, by pixel art, 2018 - 2030 (USD Million)
- FIG. 27 Non-fungible token market estimates & forecasts, by fractal/algorithimic art, 2018 - 2030 (USD Million)
- FIG. 28 Non-fungible token market estimates & forecasts, by computer generated painting, 2018 - 2030 (USD Million)
- FIG. 29 Non-fungible token market estimates & forecasts, by 2D/3D painting, 2018 - 2030 (USD Million)
- FIG. 30 Non-fungible token market estimates & forecasts, by 2D/3D computer graphics, 2018 - 2030 (USD Million)
- FIG. 31 Non-fungible token market estimates & forecasts, by 2D/3D GIFs, 2018 - 2030 (USD Million)
- FIG. 32 Non-fungible token market estimates & forecasts, by others, 2018 - 2030 (USD Million)
- FIG. 33 Non-fungible token market estimates & forecasts, by gaming, 2018 - 2030 (USD Million)
- FIG. 34 Non-fungible token market estimates & forecasts, by trading card game, 2018 - 2030 (USD Million)
- FIG. 35 Non-fungible token market estimates & forecasts, by video game, 2018 - 2030 (USD Million)
- FIG. 36 Non-fungible token market estimates & forecasts, by strategy role playing game, 2018 - 2030 (USD Million)
- FIG. 37 Non-fungible token market estimates & forecasts, by others, 2018 - 2030 (USD Million)
- FIG. 38 Non-fungible token market estimates & forecasts, by utilities, 2018 - 2030 (USD Million)
- FIG. 39 Non-fungible token market estimates & forecasts, by tickets, 2018 - 2030 (USD Million)
- FIG. 40 Non-fungible token market estimates & forecasts, by domain names, 2018 - 2030 (USD Million)
- FIG. 41 Non-fungible token market estimates & forecasts, by assets ownership, 2018 - 2030 (USD Million)
- FIG. 42 Non-fungible token market estimates & forecasts, by metaverse, 2018 - 2030 (USD Million)
- FIG. 43 Non-fungible token market estimates & forecasts, by sports, 2018 - 2030 (USD Million)
- FIG. 44 Non-fungible token market estimates & forecasts, by others, 2018 - 2030 (USD Million)
- FIG. 45 Non-fungible token market, by end-use: key takeaways
- FIG. 46 Non-fungible token market, by end-use: market share, 2023 & 2030
- FIG. 47 Non-fungible token market estimates & forecasts, by personal, 2018 - 2030 (USD Million)
- FIG. 48 Non-fungible token market estimates & forecasts, by commerical, 2018 - 2030 (USD Million)
- FIG. 49 Non-fungible token market revenue, by region, 2023 & 2030 (USD Million)
- FIG. 50 Regional marketplace: key takeways
- FIG. 51 Regional marketplace: key takeways
- FIG. 52 North America non-fungible token market estimates & forecasts, 2018 - 2030 (USD Million)
- FIG. 53 US non-fungible token market estimates & forecasts, 2018 - 2030 (USD Million)
- FIG. 54 Canada non-fungible token market estimates & forecasts, 2018 - 2030 (USD Million)
- FIG. 55 Europe non-fungible token market estimates & forecasts, 2018 - 2030 (USD Million)
- FIG. 56 UK non-fungible token market estimates & forecasts, 2018 - 2030 (USD Million)
- FIG. 57 Germany non-fungible token market estimates & forecasts, 2018 - 2030 (USD Million)
- FIG. 58 France non-fungible token market estimates & forecasts, 2018 - 2030 (USD Million)
- FIG. 59 Asia Pacific non-fungible token market estimates & forecasts, 2018 - 2030 (USD Million)
- FIG. 60 China non-fungible token market estimates & forecasts, 2018 - 2030 (USD Million)
- FIG. 61 India non-fungible token market estimates & forecasts, 2018 - 2030 (USD Million)
- FIG. 62 Japan non-fungible token market estimates & forecasts, 2018 - 2030 (USD Million)
- FIG. 63 South Korea non-fungible token market estimates & forecasts, 2018 - 2030 (USD Million)
- FIG. 64 Australia non-fungible token market estimates & forecasts, 2018 - 2030 (USD Million)
- FIG. 65 Latin America non-fungible token market estimates & forecasts, 2018 - 2030 (USD Million)
- FIG. 66 Brazil non-fungible token market estimates & forecasts, 2018 - 2030 (USD Million)
- FIG. 67 Mexico non-fungible token market estimates & forecasts, 2018 - 2030 (USD Million)
- FIG. 68 Middle East & Africa non-fungible token market estimates & forecasts, 2018 - 2030 (USD Million)
- FIG. 69 Kingdom of Saudi Arabia (KSA) non-fungible token market estimates & forecasts, 2018 - 2030 (USD Million)
- FIG. 70 UAE non-fungible token market estimates & forecasts, 2018 - 2030 (USD Million)
- FIG. 71 South Africa non-fungible token market estimates & forecasts, 2018 - 2030 (USD Million)
- FIG. 72 Key company categorization
- FIG. 73 Company market positioning
- FIG. 74 Company market share analysis, 2023
- FIG. 75 Strategic framework
Non-fungible Token Market Growth & Trends:
The global non-fungible token market size is anticipated to reach USD 211.7 billion by 2030, registering a CAGR of 34.5% from 2024 to 2030, according to a new report by Grand View Research, Inc. The growing demand for digital art worldwide is one of the major factors driving market growth. Digital art is defined as the art that is displayed or created using digital technologies. The growing use of cryptocurrency globally is also anticipated to drive market growth. This is because people use cryptocurrency to purchase digital assets. According to CoinMarketCap, as of February 2022, the total global capitalization of cryptocurrency is USD 1.76 trillion, making it equivalent to the world's 8th largest economy. The market growth of non-fungible token (NFT) companies is further supported by the substantial funding they have raised.
In August 2022, during a community event broadcast live, Collective Proof, a non-fungible token, announced that it had successfully raised USD 50 million in a Series A funding round. The funding round, led by a16z, saw the participation of several prominent investors, including Seven Seven Six, Collab+Currency, True Ventures, Flamingo DAO, SV Angel, and VaynerFund. This substantial investment comes as Proof prepares to launch its upcoming NFT collection, further solidifying its position in the NFT market. The COVID-19 pandemic had a positive impact on this market. The restrictions imposed during the pandemic confined people at home and limited their sources of income. As a result, NFT-based gaming platforms, such as Axie Game, gained popularity as they helped people earn amid the pandemic.
Non-fungible Token Market Report Highlights:
- The digital asset type segment dominated the market in 2023. The rising demand for art NFTs stems from their capability to allow artists to monitor all transactions related to their work. This transaction-tracking feature facilitates artists in accessing continuous royalty payments for each transaction involving their digital art
- The collectibles application segment dominated the market in 2023. Collectibles have a broad appeal and nostalgic value for many individuals. The concept of owning unique digital items, such as virtual trading cards, digital artwork, or virtual pets, resonates with collectors and enthusiasts who value the rarity and exclusivity of these items
- The commercial end-use segment is expected to experience the fastest CAGR from 2024 to 2030. The demand for NFTs is growing among businesses to enable improved transactions across a range of application areas
- North America accounted for a dominant revenue share in 2023. The growing use of cryptocurrency across North American countries, such as the U.S. and Canada, is expected to create new opportunities for market growth in this region
- In December 2023, Federation Internationale de Football Association (FIFA) announced its collaboration with Modex, a blockchain database provider to launch a limited NFT collection series with real-world utility ahead of the 2023 Club World Cup
- According to FIFA, the new NFT collection will allow fans an opportunity to own a piece of footballing history from the competition. Such initiatives are increasing the product adoption
Table of Contents
Chapter 1. Methodology and Scope
- 1.1. Market Segmentation and Scope
- 1.2. Market Definitions
- 1.3. Research Methodology
- 1.3.1. Information Procurement
- 1.3.2. Information or Data Analysis
- 1.3.3. Market Formulation & Data Visualization
- 1.3.4. Data Validation & Publishing
- 1.4. Research Scope and Assumptions
- 1.4.1. List of Data Sources
Chapter 2. Executive Summary
- 2.1. Market Outlook
- 2.2. Segment Outlook
- 2.3. Competitive Insights
Chapter 3. Market Variables, Trends, and Scope
- 3.1. Market Introduction/Lineage Outlook
- 3.2. Industry Value Chain Analysis
- 3.3. Market Dynamics
- 3.3.1. Market Drivers Analysis
- 3.3.1.1. Rising adoption of cryptocurrencies
- 3.3.1.2. Rising traction around Web 3.0, metaverse, and decentralized finance
- 3.3.1.3. Increasing popularity of non-fungible token marketplaces
- 3.3.2. Market Challenge Analysis
- 3.3.2.1. Security and data privacy concerns
- 3.3.3. Market Opportunity Analysis
- 3.3.3.1. Application of non-fungible tokens in supply chain
- 3.3.1. Market Drivers Analysis
- 3.4. Non-fungible Token (NFT) Market Analysis Tools
- 3.4.1. Porter's Analysis
- 3.4.1.1. Bargaining power of the suppliers
- 3.4.1.2. Bargaining power of the buyers
- 3.4.1.3. Threats of substitution
- 3.4.1.4. Threats from new entrants
- 3.4.1.5. Competitive rivalry
- 3.4.2. PESTEL Analysis
- 3.4.2.1. Political landscape
- 3.4.2.2. Economic and Social landscape
- 3.4.2.3. Technological landscape
- 3.4.2.4. Environmental landscape
- 3.4.2.5. Legal landscape
- 3.4.1. Porter's Analysis
Chapter 4. Non-fungible Token (NFT) Market: Type Estimates & Trend Analysis
- 4.1. Segment Dashboard
- 4.2. Non-fungible Token (NFT) Market: Type Movement Analysis, USD Million, 2023 & 2030
- 4.3. Physical Asset
- 4.3.1. Physical Asset Market Revenue Estimates and Forecasts, 2018 - 2030 (USD Million)
- 4.4. Digital Asset
- 4.4.1. Digital Asset Market Revenue Estimates and Forecasts, 2018 - 2030 (USD Million)
Chapter 5. Non-fungible Token (NFT) Market: Application Estimates & Trend Analysis
- 5.1. Segment Dashboard
- 5.2. Non-fungible Token (NFT) Market: Application Movement Analysis, USD Million, 2023 & 2030
- 5.3. Collectibles
- 5.3.1. Digital Asset Market Revenue Estimates and Forecasts, 2018 - 2030 (USD Million)
- 5.3.2. Video Clips
- 5.3.2.1. Video Clips Market Revenue Estimates and Forecasts, 2018 - 2030 (USD Million)
- 5.3.3. Audio Clips
- 5.3.3.1. Audio Clips Market Revenue Estimates and Forecasts, 2018 - 2030 (USD Million)
- 5.3.4. Gamification
- 5.3.4.1. Gamification Market Revenue Estimates and Forecasts, 2018 - 2030 (USD Million)
- 5.3.5. Others
- 5.3.5.1. Others Market Revenue Estimates and Forecasts, 2018 - 2030 (USD Million)
- 5.4. Art
- 5.5. Art Market Revenue Estimates and Forecasts, 2018 - 2030 (USD Million)
- 5.5.1. Pixel Art
- 5.5.1.1. Pixel Art Market Revenue Estimates and Forecasts, 2018 - 2030 (USD Million)
- 5.5.2. Fractal/Algorithmic Art
- 5.5.2.1. Fractal/Algorithmic Art Market Revenue Estimates and Forecasts, 2018 - 2030 (USD Million)
- 5.5.3. Computer Generated Painting
- 5.5.3.1. Computer Generated Painting Market Revenue Estimates and Forecasts, 2018 - 2030 (USD Million)
- 5.5.4. 2D/3D Painting
- 5.5.4.1. 2D/3D Painting Market Revenue Estimates and Forecasts, 2018 - 2030 (USD Million)
- 5.5.5. 2D/3D Computer Graphics
- 5.5.5.1. 2D/3D Computer Graphics Market Revenue Estimates and Forecasts, 2018 - 2030 (USD Million)
- 5.5.6. GIFs
- 5.5.6.1. GIFs Market Revenue Estimates and Forecasts, 2018 - 2030 (USD Million)
- 5.5.7. Others
- 5.5.7.1. Others Market Revenue Estimates and Forecasts, 2018 - 2030 (USD Million)
- 5.5.1. Pixel Art
- 5.6. Gaming
- 5.7. Gaming Market Revenue Estimates and Forecasts, 2018 - 2030 (USD Million)
- 5.7.1. Trading Card Game (TCG)
- 5.7.1.1. Trading Card Game (TCG) Market Revenue Estimates and Forecasts, 2018 - 2030 (USD Million)
- 5.7.2. Video Game
- 5.7.2.1. Video Game Market Revenue Estimates and Forecasts, 2018 - 2030 (USD Million)
- 5.7.3. Strategy Role Playing Game (RPG)
- 5.7.3.1. Strategy Role Playing Game (RPG) Market Revenue Estimates and Forecasts, 2018 - 2030 (USD Million)
- 5.7.4. Others
- 5.7.4.1. Others Market Revenue Estimates and Forecasts, 2018 - 2030 (USD Million)
- 5.7.1. Trading Card Game (TCG)
- 5.8. Utilities
- 5.9. Utilities Market Revenue Estimates and Forecasts, 2018 - 2030 (USD Million)
- 5.9.1. Tickets
- 5.9.1.1. Tickets Market Revenue Estimates and Forecasts, 2018 - 2030 (USD Million)
- 5.9.2. Domain Names
- 5.9.2.1. Domain Names Market Revenue Estimates and Forecasts, 2018 - 2030 (USD Million)
- 5.9.3. Assets Ownership
- 5.9.3.1. Assets Ownership Market Revenue Estimates and Forecasts, 2018 - 2030 (USD Million)
- 5.9.1. Tickets
- 5.10. Metaverse
- 5.10.1. Metaverse Market Revenue Estimates and Forecasts, 2018 - 2030 (USD Million)
- 5.11. Sports
- 5.11.1. Sports Market Revenue Estimates and Forecasts, 2018 - 2030 (USD Million)
- 5.12. Others
- 5.12.1. Others Market Revenue Estimates and Forecasts, 2018 - 2030 (USD Million)
Chapter 6. Non-fungible Token (NFT) Market: End-use Estimates & Trend Analysis
- 6.1. Segment Dashboard
- 6.2. Non-fungible Token (NFT) Market: End-use Movement Analysis, USD Million, 2023 & 2030
- 6.3. Personal
- 6.3.1. Personal Market Revenue Estimates and Forecasts, 2018 - 2030 (USD Million)
- 6.4. Commercial
- 6.4.1. Commercial Market Revenue Estimates and Forecasts, 2018 - 2030 (USD Million)
Chapter 7. Non-fungible Token (NFT) Market: Regional Estimates & Trend Analysis
- 7.1. Non-fungible Token (NFT) Market Share, By Region, 2023 & 2030, USD Million
- 7.2. North America
- 7.2.1. North America Non-fungible Token Market Estimates & Forecasts, 2018 - 2030 (USD Million)
- 7.2.2. U.S.
- 7.2.2.1. U.S. Non-fungible Token Market Estimates & Forecasts, 2018 - 2030 (USD Million)
- 7.2.3. Canada
- 7.2.3.1. Canada Non-fungible Token Market Estimates & Forecasts, 2018 - 2030 (USD Million)
- 7.3. Europe
- 7.3.1. Europe Non-fungible Token Market Estimates & Forecasts, 2018 - 2030 (USD Million)
- 7.3.2. UK
- 7.3.2.1. UK Non-fungible Token Market Estimates & Forecasts, 2018 - 2030 (USD Million)
- 7.3.3. Germany
- 7.3.3.1. Germany Non-fungible Token Market Estimates & Forecasts, 2018 - 2030 (USD Million)
- 7.3.4. France
- 7.3.4.1. France Non-fungible Token Market Estimates & Forecasts, 2018 - 2030 (USD Million)
- 7.4. Asia Pacific
- 7.4.1. Asia Pacific Non-fungible Token Market Estimates & Forecasts, 2018 - 2030 (USD Million)
- 7.4.2. China
- 7.4.2.1. China Non-fungible Token Market Estimates & Forecasts, 2018 - 2030 (USD Million)
- 7.4.3. India
- 7.4.3.1. India Non-fungible Token Market Estimates & Forecasts, 2018 - 2030 (USD Million)
- 7.4.4. Japan
- 7.4.4.1. Japan Non-fungible Token Market Estimates & Forecasts, 2018 - 2030 (USD Million)
- 7.4.5. South Korea
- 7.4.5.1. South Korea Non-fungible Token Market Estimates & Forecasts, 2018 - 2030 (USD Million)
- 7.4.6. Australia
- 7.4.6.1. Australia Non-fungible Token Market Estimates & Forecasts, 2018 - 2030 (USD Million)
- 7.5. Latin America
- 7.5.1. Latin America Non-fungible Token Market Estimates & Forecasts, 2018 - 2030 (USD Million)
- 7.5.2. Brazil
- 7.5.2.1. Brazil Non-fungible Token Market Estimates & Forecasts, 2018 - 2030 (USD Million)
- 7.5.3. Mexico
- 7.5.3.1. Mexico Non-fungible Token Market Estimates & Forecasts, 2018 - 2030 (USD Million)
- 7.6. Middle East & Africa
- 7.6.1. Middle East & Africa Non-fungible Token Market Estimates & Forecasts, 2018 - 2030 (USD Million)
- 7.6.2. Kingdom Of Saudi Arabia (KSA)
- 7.6.2.1. Kingdom Of Saudi Arabia (KSA) Non-fungible Token Market Estimates & Forecasts, 2018 - 2030 (USD Million)
- 7.6.3. UAE
- 7.6.3.1. UAE Non-fungible Token Market Estimates & Forecasts, 2018 - 2030 (USD Million)
- 7.6.4. South Arica
- 7.6.4.1. South Africa Non-fungible Token Market Estimates & Forecasts, 2018 - 2030 (USD Million)
Chapter 8. Competitive Landscape
- 8.1. Recent Developments & Impact Analysis by Key Market Participants
- 8.2. Company Categorization
- 8.3. Company Market Positioning
- 8.4. Company Market Share Analysis
- 8.5. Company Heat Map Analysis
- 8.6. Strategy Mapping
- 8.6.1. Expansion
- 8.6.2. Mergers & Acquisition
- 8.6.3. Partnerships & Collaborations
- 8.6.4. New Product Launches
- 8.6.5. Research And Development
- 8.7. Company Profiles
- 8.7.1. YellowHeart, LLC.
- 8.7.1.1. Participant's Overview
- 8.7.1.2. Financial Performance
- 8.7.1.3. Product Benchmarking
- 8.7.1.4. Recent Developments
- 8.7.2. Cloudflare, Inc.
- 8.7.2.1. Participant's Overview
- 8.7.2.2. Financial Performance
- 8.7.2.3. Product Benchmarking
- 8.7.2.4. Recent Developments
- 8.7.3. PLBY Group, Inc.
- 8.7.3.1. Participant's Overview
- 8.7.3.2. Financial Performance
- 8.7.3.3. Product Benchmarking
- 8.7.3.4. Recent Developments
- 8.7.4. Dolphin Entertainment, Inc.
- 8.7.4.1. Participant's Overview
- 8.7.4.2. Financial Performance
- 8.7.4.3. Product Benchmarking
- 8.7.4.4. Recent Developments
- 8.7.5. Funko
- 8.7.5.1. Participant's Overview
- 8.7.5.2. Financial Performance
- 8.7.5.3. Product Benchmarking
- 8.7.5.4. Recent Developments
- 8.7.6. Ozone Networks, Inc.
- 8.7.6.1. Participant's Overview
- 8.7.6.2. Financial Performance
- 8.7.6.3. Product Benchmarking
- 8.7.6.4. Recent Developments
- 8.7.7. Dolphin Entertainment, Inc.
- 8.7.7.1. Participant's Overview
- 8.7.7.2. Financial Performance
- 8.7.7.3. Product Benchmarking
- 8.7.7.4. Recent Developments
- 8.7.8. Dapper Labs, Inc.
- 8.7.8.1. Participant's Overview
- 8.7.8.2. Financial Performance
- 8.7.8.3. Product Benchmarking
- 8.7.8.4. Recent Developments
- 8.7.9. Gemini Trust Company, LLC.
- 8.7.9.1. Participant's Overview
- 8.7.9.2. Financial Performance
- 8.7.9.3. Product Benchmarking
- 8.7.9.4. Recent Developments
- 8.7.10. Onchain Labs, Inc.
- 8.7.10.1. Participant's Overview
- 8.7.10.2. Financial Performance
- 8.7.10.3. Product Benchmarking
- 8.7.10.4. Recent Developments
- 8.7.1. YellowHeart, LLC.
