
NFT市場 (~2035年):NFTタイプ・提供区分・プラットフォーム・エンドユーザー・企業タイプ・地域別の分布・産業動向・世界の予測
NFT Market, Till 2035: Distribution by Type of NFT, Type of Offerings, Type of Platforms, Type of End-User, Type of Enterprise and Geographical Regions: Industry Trends and Global Forecasts- 発行日
- ページ情報
- 英文 185 Pages
- 納期
- 7~10営業日
- 商品コード
- 1752102
- カスタマイズ可能 お客様のご希望に応じて、既存データの加工や未掲載情報(例:国別セグメント)の追加などの対応が可能です。詳細はお問い合わせください。
- 翻訳ツール提供対象 PDF対応AI翻訳ツールの無料貸し出しサービスのご利用が可能です
- 医薬品関連専門 医薬品関連専門を専門とする市場調査会社です。
概要
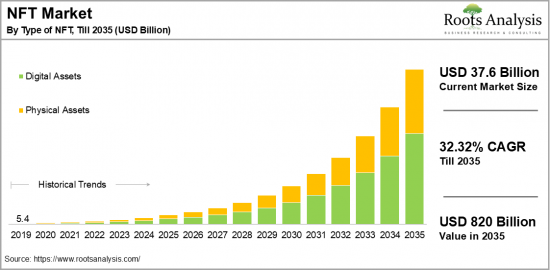
世界のNFTの市場規模は、現在の376億米ドルから、2035年までの予測期間中はCAGR 32.32%で推移し、2035年には8,200億米ドルに成長すると予測されています。
NFTの市場機会:セグメント別
NFTタイプ別
- デジタル資産
- 物理資産
提供区分別
- アート
- コレクション
- ゲーム資産
- 音楽NFT
- 不動産
- その他
プラットフォーム別
- NFT専用マーケットプレース
- オンライン小売業者
- ソーシャルメディアプラットフォーム
- その他
エンドユーザー別
- コレクター
- インフルエンサー/クリエイター
- プラットフォームプロバイダー
- NFTゲームプレイヤー
- その他
企業タイプ別
- 大企業
- 中小企業
地域別
- 北米
- 米国
- カナダ
- メキシコ
- その他の北米諸国
- 欧州
- オーストリア
- ベルギー
- デンマーク
- フランス
- ドイツ
- アイルランド
- イタリア
- オランダ
- ノルウェー
- ロシア
- スペイン
- スウェーデン
- スイス
- 英国
- その他の欧州諸国
- アジア
- 中国
- インド
- 日本
- シンガポール
- 韓国
- その他のアジア諸国
- ラテンアメリカ
- ブラジル
- チリ
- コロンビア
- ベネズエラ
- その他のラテンアメリカ諸国
- 中東・北アフリカ
- エジプト
- イラン
- イラク
- イスラエル
- クウェート
- サウジアラビア
- アラブ首長国連邦
- その他のMENA諸国
- 世界のその他の地域
- オーストラリア
- ニュージーランド
- その他の国
NFT市場:成長と動向
Forbesによると、2017年以降、NFT (非代替性トークン) には驚異的な1億7,400万米ドルが投資されてきました。今日のテクノロジー中心の生活において、あらゆるものが流動的になっており、個人のコレクションも例外ではありません。現代社会はNFTと呼ばれる新たなプラットフォームへと移行しつつあります。NFTは、アート、ゲームアイテム、音楽トークン、不動産など、さまざまなサービスに対応しています。NFTを取得する際には、「ミンティング」と呼ばれる手続きが行われ、取引内容はブロックチェーン上に記録されることで、購入者は対象アイテムに対する権限や所有権を実感することができます。
NFTの人気が高まっている背景には、分割不可能性、完全な所有権、過去の所有者や出所をたどれる履歴といった特徴があります。さらに、NFTは流動性も高く、その知名度の上昇がこの点を後押ししています。現在の主な利用者は個人ですが、高級ブランド、飲料メーカー、メディア企業、クリエイターなども注目しています。特に注目すべき事例として、2025年1月、元米国大統領夫人のメラニア・トランプ氏が$MELANIAというミームコインを発表し、その直後に時価総額22億米ドルを記録しました。
急速に進化する技術環境の中で、NFTはチケット販売やグッズ販売においても大きな影響を及ぼしています。NFT市場は、イノベーションとデジタル変革への世界的な移行において、重要な要素となりつつあります。デジタルアートへのAIの統合と、ブロックチェーン技術のシンプルな応用は、NFTの可能性を最大限に引き出すうえで極めて重要であり、認証プロセスと創作プロセスの両方を強化しています。特に注目すべき利点としては、資産の「民主化された所有」の実現や、二次販売でのロイヤリティの保証で新たな収益源が生まれることが挙げられます。こうした要因に支えられ、NFT市場は今後の予測期間において大きな成長が見込まれています。
当レポートでは、世界のNFTの市場を調査し、 市場概要、背景、市場影響因子の分析、市場規模の推移・予測、各種区分・地域別の詳細分析、競合情勢、主要企業のプロファイルなどをまとめています。
目次
セクションI:レポート概要
第1章 序文
第2章 調査手法
第3章 市場力学
第4章 マクロ経済指標
セクションII:定性的洞察
第5章 エグゼクティブサマリー
第6章 イントロダクション
第7章 規制シナリオ
セクションIII:市場概要
第8章 主要企業の包括的データベース
第9章 競合情勢
第10章 ホワイトスペース分析
第11章 企業の競争力分析
第12章 NFT市場におけるスタートアップエコシステム
セクションIV:企業プロファイル
第13章 企業プロファイル
- AppDupe
- Art Block
- Cloudflare
- Dapper lacs
- Dolphin Entertainment
- Gala Games
- Gemini Trust
- Onchain Labs
- OpenSea
- Ozone Networks
- PLBY Groups
- SuperRare
- Takung Art.
- The Sandbox
- YellowHeart
セクションV:市場動向
第14章 メガトレンド分析
第15章 アンメットニーズ分析
第16章 特許分析
第17章 最近の動向
セクションVI:市場機会分析
第18章 世界のNFT市場
第19章 NFTタイプ別の市場機会
第20章 提供区分別の市場機会
第21章 プラットフォーム別の市場機会
第22章 エンドユーザー別の市場機会
第23章 企業タイプ別の市場機会
第24章 北米におけるNFTの市場機会
第25章 欧州におけるNFTの市場機会
第26章 アジアにおけるNFTの市場機会
第27章 中東・北アフリカにおけるNFTの市場機会
第28章 ラテンアメリカにおけるNFTの市場機会
第29章 世界のその他の地域におけるNFTの市場機会
第30章 市場集中分析:主要企業別分布
第31章 隣接市場分析
セクションVII:戦略ツール
第32章 勝利の鍵となる戦略
第33章 ポーターのファイブフォース分析
第34章 SWOT分析
第35章 バリューチェーン分析
第36章 ROOTSによる戦略提言
セクションVIII:その他の独占的洞察
第37章 1次調査からの洞察
第38章 総論
セクションIX:付録
第39章 表形式データ
第40章 企業・団体一覧
第41章 カスタマイズの機会
第42章 ROOTS サブスクリプションサービス
第43章 著者詳細
目次
NFT Market Overview
As per Roots Analysis, the global NFT market size is estimated to grow from USD 37.6 billion in the current year to USD 820 billion by 2035, at a CAGR of 32.32% during the forecast period, till 2035.
The opportunity for NFT market has been distributed across the following segments:
Type of NFT
- Digital Assets
- Physical Assets
Type of Offering
- Arts
- Collectibles
- Gaming Assets
- Music NFTs
- Real Estate
- Others
Type of Platforms
- Dedicated NFT Marketplace
- Online Retailers
- Social Media Platforms
- Others
End-Users
- Collectors
- Influencers / Creators
- Platform Providers
- Players of NFT-Driven Games
- Others
Type of Enterprise
- Large
- Small and Medium Enterprise
Geographical Regions
- North America
- US
- Canada
- Mexico
- Other North American countries
- Europe
- Austria
- Belgium
- Denmark
- France
- Germany
- Ireland
- Italy
- Netherlands
- Norway
- Russia
- Spain
- Sweden
- Switzerland
- UK
- Other European countries
- Asia
- China
- India
- Japan
- Singapore
- South Korea
- Other Asian countries
- Latin America
- Brazil
- Chile
- Colombia
- Venezuela
- Other Latin American countries
- Middle East and North Africa
- Egypt
- Iran
- Iraq
- Israel
- Kuwait
- Saudi Arabia
- UAE
- Other MENA countries
- Rest of the World
- Australia
- New Zealand
- Other countries
NFT MARKET: GROWTH AND TRENDS
According to Forbes, an astonishing USD 174 million has been invested in NFTs since 2017. In today's tech-centric life, everything has become fluid, and personal collections are no exception; the modern world has gravitated toward a new platform known as non-fungible tokens (NFTs). These tokens cover a range of services, including art, gaming items, musical tokens, and real estate. During the acquisition process, NFT tokens undergo a procedure referred to as minting. Additionally, the transaction is recorded on a blockchain, providing the buyer with a sense of authority and ownership over the specific item purchased.
Their rising popularity stems from features such as indivisibility, offering complete ownership, and a traceable history that reveals previous owners and the original source of the non-fungible token. Moreover, they provide high liquidity, bolstered by their growing fame. While most active users are individuals, significant luxury brands, beverage companies, media outlets, and creators are also taking note. Notably, in January 2025, Melania Trump, the former First Lady of America, introduced the $MELANIA meme coin, which achieved a market cap of USD 2.2 billion shortly after its debut.
In the fast-evolving technological landscape, these tokens have made a substantial impact on ticketing and merchandise. The NFT marketplace is becoming an essential element in the global transition towards innovation and digital transformation, aiming for heightened AI technological efficiency. The integration of AI in digital art and the straightforward application of blockchain technology in NFTs has been crucial in realizing its full potential, enhancing both authentication and creation processes. Interestingly, one notable benefit of NFTs includes democratized ownership of assets and new revenue streams through guaranteed royalties on secondary sales. Driven by these factors, the NFT market is expected to witness a significant growth during the forecast period.
NFT MARKET: KEY SEGMENTS
Market Share by Type of NFT
Based on type of NFT, the global NFT market is segmented into digital assets and physical assets. According to our estimates, currently, digital assets segment captures the majority share of the market. This can be attributed to the strong interest in owning digital items among a substantial portion of the younger demographic worldwide. Further, the increasing popularity of digital platforms such as OpenSea and SuperRare is contributing to the growth of the digital non-fungible token industry.
However, the physical assets segment is anticipated to grow at a higher CAGR during the forecast period. This trend is driven by the rising interest in physical asset ownership, along with a notable demand for wall art and tangible merchandise globally.
Market Share by Type of Offering
Based on type of offering, the NFT market is segmented into arts, collectibles, gaming assets, music NFTs, real estate and others. According to our estimates, currently, collectibles segment captures the majority of the market and this trend is unlikely to change in future. However, the art segment is anticipated to grow at a higher CAGR during the forecast period, owing to the growing popularity of modern art, which is further enhancing investment opportunities in NFTs.
Market Share by Type of Platforms
Based on type of platforms, the NFT market is segmented into dedicated NFT marketplace, online retailers, social media platforms and others. According to our estimates, currently, dedicated NFT marketplace captures the majority share of the market. Additionally, this segment is anticipated to experience a higher compound annual growth rate (CAGR) during the forecast period. This growth can be attributed to its user-friendly tools for buying and selling items, innovative features, and specialized services tailored for NFTs.
Market Share by End-Users
Based on end-users, the NFT market is segmented into collectors, influencers / creators, platform providers, players of NFT-driven games and others. According to our estimates, currently, the collectors segment capture the majority share of the market and this trend is unlikely to change in future.
Market Share by Type of Enterprise
Based on type of enterprise, the NFT market is segmented into large and small and medium enterprise. According to our estimates, currently, large enterprises segment captures the majority share of the market. Companies like OpenSea and SuperRare are attracting more active users, particularly through their art-related initiatives. Furthermore, this trend is expected to continue in the near future, as large enterprises are more inclined to create new features that assist buyers and sellers on their platforms.
Market Share by Geographical Regions
Based on geographical regions, the NFT market is segmented into North America, Europe, Asia, Latin America, Middle East and North Africa, and the rest of the world. According to our estimates, currently, Asia captures the majority share of the market. However, the market in North America is anticipated to grow at a relatively higher CAGR during the forecast period.
Example Players in NFT Market
- AppDupe
- ArtBlock
- Cloudflare
- Dapper Labs
- Dolphin Entertainment
- Gala Games
- Gemini Trust
- OnChain Labs
- OpenSea
- PLBY Group
- SuperRare
- Takung Art
- The Sandbox
- YellowHeart
NFT MARKET: RESEARCH COVERAGE
The report on the NFT market features insights on various sections, including:
- Market Sizing and Opportunity Analysis: An in-depth analysis of the NFT market, focusing on key market segments, including [A] type of NFT, [B] type of offerings, [C] type of platforms, [D] type of end-user, [E] type of enterprise and [F] geographical regions.
- Competitive Landscape: A comprehensive analysis of the companies engaged in the NFT market, based on several relevant parameters, such as [A] year of establishment, [B] company size, [C] location of headquarters and [D] ownership structure.
- Company Profiles: Elaborate profiles of prominent players engaged in the NFT market, providing details on [A] location of headquarters, [B] company size, [C] company mission, [D] company footprint, [E] management team, [F] contact details, [G] financial information, [H] operating business segments, [I] service / product portfolio, [J] moat analysis, [K] recent developments, and an informed future outlook.
- Megatrends: An evaluation of ongoing megatrends in the NFT industry.
- Patent Analysis: An insightful analysis of patents filed / granted in the NFT domain, based on relevant parameters, including [A] type of patent, [B] patent publication year, [C] patent age and [D] leading players.
- Recent Developments: An overview of the recent developments made in the NFT market, along with analysis based on relevant parameters, including [A] year of initiative, [B] type of initiative, [C] geographical distribution and [D] most active players.
- Porter's Five Forces Analysis: An analysis of five competitive forces prevailing in the NFT market, including threats of new entrants, bargaining power of buyers, bargaining power of suppliers, threats of substitute products and rivalry among existing competitors.
- SWOT Analysis: An insightful SWOT framework, highlighting the strengths, weaknesses, opportunities and threats in the domain. Additionally, it provides Harvey ball analysis, highlighting the relative impact of each SWOT parameter.
KEY QUESTIONS ANSWERED IN THIS REPORT
- How many companies are currently engaged in NFT market?
- Which are the leading companies in this market?
- What factors are likely to influence the evolution of this market?
- What is the current and future market size?
- What is the CAGR of this market?
- How is the current and future market opportunity likely to be distributed across key market segments?
REASONS TO BUY THIS REPORT
- The report provides a comprehensive market analysis, offering detailed revenue projections of the overall market and its specific sub-segments. This information is valuable to both established market leaders and emerging entrants.
- Stakeholders can leverage the report to gain a deeper understanding of the competitive dynamics within the market. By analyzing the competitive landscape, businesses can make informed decisions to optimize their market positioning and develop effective go-to-market strategies.
- The report offers stakeholders a comprehensive overview of the market, including key drivers, barriers, opportunities, and challenges. This information empowers stakeholders to stay abreast of market trends and make data-driven decisions to capitalize on growth prospects.
ADDITIONAL BENEFITS
- Complimentary Excel Data Packs for all Analytical Modules in the Report
- 15% Free Content Customization
- Detailed Report Walkthrough Session with Research Team
- Free Updated report if the report is 6-12 months old or older
TABLE OF CONTENTS
SECTION I: REPORT OVERVIEW
1. PREFACE
- 1.1. Introduction
- 1.2. Market Share Insights
- 1.3. Key Market Insights
- 1.4. Report Coverage
- 1.5. Key Questions Answered
- 1.6. Chapter Outlines
2. RESEARCH METHODOLOGY
- 2.1. Chapter Overview
- 2.2. Research Assumptions
- 2.3. Database Building
- 2.3.1. Data Collection
- 2.3.2. Data Validation
- 2.3.3. Data Analysis
- 2.4. Project Methodology
- 2.4.1. Secondary Research
- 2.4.1.1. Annual Reports
- 2.4.1.2. Academic Research Papers
- 2.4.1.3. Company Websites
- 2.4.1.4. Investor Presentations
- 2.4.1.5. Regulatory Filings
- 2.4.1.6. White Papers
- 2.4.1.7. Industry Publications
- 2.4.1.8. Conferences and Seminars
- 2.4.1.9. Government Portals
- 2.4.1.10. Media and Press Releases
- 2.4.1.11. Newsletters
- 2.4.1.12. Industry Databases
- 2.4.1.13. Roots Proprietary Databases
- 2.4.1.14. Paid Databases and Sources
- 2.4.1.15. Social Media Portals
- 2.4.1.16. Other Secondary Sources
- 2.4.2. Primary Research
- 2.4.2.1. Introduction
- 2.4.2.2. Types
- 2.4.2.2.1. Qualitative
- 2.4.2.2.2. Quantitative
- 2.4.2.3. Advantages
- 2.4.2.4. Techniques
- 2.4.2.4.1. Interviews
- 2.4.2.4.2. Surveys
- 2.4.2.4.3. Focus Groups
- 2.4.2.4.4. Observational Research
- 2.4.2.4.5. Social Media Interactions
- 2.4.2.5. Stakeholders
- 2.4.2.5.1. Company Executives (CXOs)
- 2.4.2.5.2. Board of Directors
- 2.4.2.5.3. Company Presidents and Vice Presidents
- 2.4.2.5.4. Key Opinion Leaders
- 2.4.2.5.5. Research and Development Heads
- 2.4.2.5.6. Technical Experts
- 2.4.2.5.7. Subject Matter Experts
- 2.4.2.5.8. Scientists
- 2.4.2.5.9. Doctors and Other Healthcare Providers
- 2.4.2.6. Ethics and Integrity
- 2.4.2.6.1. Research Ethics
- 2.4.2.6.2. Data Integrity
- 2.4.3. Analytical Tools and Databases
- 2.4.1. Secondary Research
3. MARKET DYNAMICS
- 3.1. Forecast Methodology
- 3.1.1. Top-Down Approach
- 3.1.2. Bottom-Up Approach
- 3.1.3. Hybrid Approach
- 3.2. Market Assessment Framework
- 3.2.1. Total Addressable Market (TAM)
- 3.2.2. Serviceable Addressable Market (SAM)
- 3.2.3. Serviceable Obtainable Market (SOM)
- 3.2.4. Currently Acquired Market (CAM)
- 3.3. Forecasting Tools and Techniques
- 3.3.1. Qualitative Forecasting
- 3.3.2. Correlation
- 3.3.3. Regression
- 3.3.4. Time Series Analysis
- 3.3.5. Extrapolation
- 3.3.6. Convergence
- 3.3.7. Forecast Error Analysis
- 3.3.8. Data Visualization
- 3.3.9. Scenario Planning
- 3.3.10. Sensitivity Analysis
- 3.4. Key Considerations
- 3.4.1. Demographics
- 3.4.2. Market Access
- 3.4.3. Reimbursement Scenarios
- 3.4.4. Industry Consolidation
- 3.5. Robust Quality Control
- 3.6. Key Market Segmentations
- 3.7. Limitations
4. MACRO-ECONOMIC INDICATORS
- 4.1. Chapter Overview
- 4.2. Market Dynamics
- 4.2.1. Time Period
- 4.2.1.1. Historical Trends
- 4.2.1.2. Current and Forecasted Estimates
- 4.2.2. Currency Coverage
- 4.2.2.1. Overview of Major Currencies Affecting the Market
- 4.2.2.2. Impact of Currency Fluctuations on the Industry
- 4.2.3. Foreign Exchange Impact
- 4.2.3.1. Evaluation of Foreign Exchange Rates and Their Impact on Market
- 4.2.3.2. Strategies for Mitigating Foreign Exchange Risk
- 4.2.4. Recession
- 4.2.4.1. Historical Analysis of Past Recessions and Lessons Learnt
- 4.2.4.2. Assessment of Current Economic Conditions and Potential Impact on the Market
- 4.2.5. Inflation
- 4.2.5.1. Measurement and Analysis of Inflationary Pressures in the Economy
- 4.2.5.2. Potential Impact of Inflation on the Market Evolution
- 4.2.6. Interest Rates
- 4.2.6.1. Overview of Interest Rates and Their Impact on the Market
- 4.2.6.2. Strategies for Managing Interest Rate Risk
- 4.2.7. Commodity Flow Analysis
- 4.2.7.1. Type of Commodity
- 4.2.7.2. Origins and Destinations
- 4.2.7.3. Values and Weights
- 4.2.7.4. Modes of Transportation
- 4.2.8. Global Trade Dynamics
- 4.2.8.1. Import Scenario
- 4.2.8.2. Export Scenario
- 4.2.9. War Impact Analysis
- 4.2.9.1. Russian-Ukraine War
- 4.2.9.2. Israel-Hamas War
- 4.2.10. COVID Impact / Related Factors
- 4.2.10.1. Global Economic Impact
- 4.2.10.2. Industry-specific Impact
- 4.2.10.3. Government Response and Stimulus Measures
- 4.2.10.4. Future Outlook and Adaptation Strategies
- 4.2.11. Other Indicators
- 4.2.11.1. Fiscal Policy
- 4.2.11.2. art Spending
- 4.2.11.3. Gross Domestic Product (GDP)
- 4.2.11.4. Employment
- 4.2.11.5. Taxes
- 4.2.11.6. R&D Innovation
- 4.2.11.7. Stock Market Performance
- 4.2.11.8. Supply Chain
- 4.2.11.9. Cross-Border Dynamics
- 4.2.1. Time Period
SECTION II: QUALITATIVE INSIGHTS
5. EXECUTIVE SUMMARY
6. INTRODUCTION
- 6.1. Chapter Overview
- 6.2. Overview of NFT Market
- 6.2.1. Type of NFT
- 6.2.2. Type of Offering
- 6.2.3. Type of Platforms
- 6.2.4. Type of End-User
- 6.2.5. Type of Enterprise
- 6.3. Future Perspective
7. REGULATORY SCENARIO
SECTION III: MARKET OVERVIEW
8. COMPREHENSIVE DATABASE OF LEADING PLAYERS
9. COMPETITIVE LANDSCAPE
- 9.1. Chapter Overview
- 9.2. NFT: Overall Market Landscape
- 9.2.1. Analysis by Year of Establishment
- 9.2.2. Analysis by Company Size
- 9.2.3. Analysis by Location of Headquarters
- 9.2.4. Analysis by Ownership Structure
10. WHITE SPACE ANALYSIS
11. COMPANY COMPETITIVENESS ANALYSIS
12. STARTUP ECOSYSTEM IN THE NFT MARKET
- 12.1. NFT Market: Market Landscape of Startups
- 12.1.1. Analysis by Year of Establishment
- 12.1.2. Analysis by Company Size
- 12.1.3. Analysis by Company Size and Year of Establishment
- 12.1.4. Analysis by Location of Headquarters
- 12.1.5. Analysis by Company Size and Location of Headquarters
- 12.1.6. Analysis by Ownership Structure
- 12.2. Key Findings
SECTION IV: COMPANY PROFILES
13. COMPANY PROFILES
- 13.1. Chapter Overview
- 13.2. AppDupe*
- 13.2.1. Company Overview
- 13.2.2. Company Mission
- 13.2.3. Company Footprint
- 13.2.4. Management Team
- 13.2.5. Contact Details
- 13.2.6. Financial Performance
- 13.2.7. Operating Business Segments
- 13.2.8. Service / Product Portfolio (project specific)
- 13.2.9. MOAT Analysis
- 13.2.10. Recent Developments and Future Outlook
- 13.3. Art Block
- 13.4. Cloudflare
- 13.5. Dapper lacs
- 13.6. Dolphin Entertainment
- 13.7. Gala Games
- 13.8. Gemini Trust
- 13.9. Onchain Labs
- 13.10. OpenSea
- 13.11. Ozone Networks
- 13.12. PLBY Groups
- 13.13. SuperRare
- 13.14. Takung Art.
- 13.15. The Sandbox
- 13.16. YellowHeart
SECTION V: MARKET TRENDS
14. MEGA TRENDS ANALYSIS
15. UNMET NEED ANALYSIS
16. PATENT ANALYSIS
17. RECENT DEVELOPMENTS
- 17.1. Chapter Overview
- 17.2. Recent Funding
- 17.3. Recent Partnerships
- 17.4. Other Recent Initiatives
SECTION VI: MARKET OPPORTUNITY ANALYSIS
18. GLOBAL NFT MARKET
- 18.1. Chapter Overview
- 18.2. Key Assumptions and Methodology
- 18.3. Trends Disruption Impacting Market
- 18.4. Demand Side Trends
- 18.5. Supply Side Trends
- 18.6. Global NFT Market, Historical Trends (Since 2019) and Forecasted Estimates (Till 2035)
- 18.7. Multivariate Scenario Analysis
- 18.7.1. Conservative Scenario
- 18.7.2. Optimistic Scenario
- 18.8. Investment Feasibility Index
- 18.9. Key Market Segmentations
19. MARKET OPPORTUNITIES BASED ON TYPE OF NFT
- 19.1. Chapter Overview
- 19.2. Key Assumptions and Methodology
- 19.3. Revenue Shift Analysis
- 19.4. Market Movement Analysis
- 19.5. Penetration-Growth (P-G) Matrix
- 19.6. NFT Market for Physical Assets: Historical Trends (Since 2019) and Forecasted Estimates (Till 2035)
- 19.7. NFT Market for Digital Assets Historical Trends (Since 2019) and Forecasted Estimates (Till 2035)
- 19.8. Data Triangulation and Validation
- 19.8.1. Secondary Sources
- 19.8.2. Primary Sources
- 19.8.3. Statistical Modeling
20. MARKET OPPORTUNITIES BASED ON TYPE OF OFFERING
- 20.1. Chapter Overview
- 20.2. Key Assumptions and Methodology
- 20.3. Revenue Shift Analysis
- 20.4. Market Movement Analysis
- 20.5. Penetration-Growth (P-G) Matrix
- 20.6. NFT Market for Arts: Historical Trends (Since 2019) and Forecasted Estimates (Till 2035)
- 20.7. NFT Market for Collectibles: Historical Trends (Since 2019) and Forecasted Estimates (Till 2035)
- 20.8. NFT Market for Gaming assets: Historical Trends (Since 2019) and Forecasted Estimates (Till 2035)
- 20.9. NFT Market for Music NFTs: Historical Trends (Since 2019) and Forecasted Estimates (Till 2035)
- 20.10. NFT Market for Real Estate: Historical Trends (Since 2019) and Forecasted Estimates (Till 2035)
- 20.11. NFT Market for Others: Historical Trends (Since 2019) and Forecasted Estimates (Till 2035)
- 20.12. Data Triangulation and Validation
- 20.12.1. Secondary Sources
- 20.12.2. Primary Sources
- 20.12.3. Statistical Modeling
21. MARKET OPPORTUNITIES BASED ON TYPE OF PLATFORM
- 21.1. Chapter Overview
- 21.2. Key Assumptions and Methodology
- 21.3. Revenue Shift Analysis
- 21.4. Market Movement Analysis
- 21.5. Penetration-Growth (P-G) Matrix
- 21.6. NFT Market for Dedicated NFT Marketplace: Historical Trends (Since 2019) and Forecasted Estimates (Till 2035)
- 21.7. NFT Market for Online Retailers: Historical Trends (Since 2019) and Forecasted Estimates (Till 2035)
- 21.8. NFT Market for Social Media Platforms: Historical Trends (Since 2019) and Forecasted Estimates (Till 2035)
- 21.9. NFT Market for Others: Historical Trends (Since 2019) and Forecasted Estimates (Till 2035)
- 21.10. Data Triangulation and Validation
- 21.10.1. Secondary Sources
- 21.10.2. Primary Sources
- 21.10.3. Statistical Modeling
22. MARKET OPPORTUNITIES BASED ON TYPE OF END-USER
- 22.1. Chapter Overview
- 22.2. Key Assumptions and Methodology
- 22.3. Revenue Shift Analysis
- 22.4. Market Movement Analysis
- 22.5. Penetration-Growth (P-G) Matrix
- 22.6. NFT Market for Collectors: Historical Trends (Since 2019) and Forecasted Estimates (Till 2035)
- 22.7. NFT Market for Influencers/Creators: Historical Trends (Since 2019) and Forecasted Estimates (Till 2035)
- 22.8. NFT Market for Platform Providers: Historical Trends (Since 2019) and Forecasted Estimates (Till 2035)
- 22.9. NFT Market for Players of NFT Driven-Games: Historical Trends (Since 2019) and Forecasted Estimates (Till 2035)
- 22.10. NFT Market for Others: Historical Trends (Since 2019) and Forecasted Estimates (Till 2035)
- 22.11. Data Triangulation and Validation
- 22.11.1. Secondary Sources
- 22.11.2. Primary Sources
- 22.11.3. Statistical Modeling
23. MARKET OPPORTUNITIES BASED ON TYPE OF ENTERPRISE
- 23.1. Chapter Overview
- 23.2. Key Assumptions and Methodology
- 23.3. Revenue Shift Analysis
- 23.4. Market Movement Analysis
- 23.5. Penetration-Growth (P-G) Matrix
- 23.6. NFT Market for Large: Historical Trends (Since 2019) and Forecasted Estimates (Till 2035)
- 23.7. NFT Market for Small and Medium Enterprise: Historical Trends (Since 2019) and Forecasted Estimates (Till 2035)
- 23.8. Data Triangulation and Validation
- 23.8.1. Secondary Sources
- 23.8.2. Primary Sources
- 23.8.3. Statistical Modeling
24. MARKET OPPORTUNITIES NFT IN NORTH AMERICA
- 24.1. Chapter Overview
- 24.2. Key Assumptions and Methodology
- 24.3. Revenue Shift Analysis
- 24.4. Market Movement Analysis
- 24.5. Penetration-Growth (P-G) Matrix
- 24.6. NFT Market in North America: Historical Trends (Since 2019) and Forecasted Estimates (Till 2035)
- 24.6.1. NFT Market in the US: Historical Trends (Since 2019) and Forecasted Estimates (Till 2035)
- 24.6.2. NFT Market in Canada: Historical Trends (Since 2019) and Forecasted Estimates (Till 2035)
- 24.6.3. NFT Market in Mexico: Historical Trends (Since 2019) and Forecasted Estimates (Till 2035)
- 24.6.4. NFT Market in Other North American Countries: Historical Trends (Since 2019) and Forecasted Estimates (Till 2035)
- 24.7. Data Triangulation and Validation
25. MARKET OPPORTUNITIES FOR NFT IN EUROPE
- 25.1. Chapter Overview
- 25.2. Key Assumptions and Methodology
- 25.3. Revenue Shift Analysis
- 25.4. Market Movement Analysis
- 25.5. Penetration-Growth (P-G) Matrix
- 25.6. NFT Market in Europe: Historical Trends (Since 2019) and Forecasted Estimates (Till 2035)
- 25.6.1. NFT Market in Austria: Historical Trends (Since 2019) and Forecasted Estimates (Till 2035)
- 25.6.2. NFT Market in Belgium: Historical Trends (Since 2019) and Forecasted Estimates (Till 2035)
- 25.6.3. NFT Market in Denmark: Historical Trends (Since 2019) and Forecasted Estimates (Till 2035)
- 25.6.4. NFT Market in France: Historical Trends (Since 2019) and Forecasted Estimates (Till 2035)
- 25.6.5. NFT Market in Germany: Historical Trends (Since 2019) and Forecasted Estimates (Till 2035)
- 25.6.6. NFT Market in Ireland: Historical Trends (Since 2019) and Forecasted Estimates (Till 2035)
- 25.6.7. NFT Market in Italy: Historical Trends (Since 2019) and Forecasted Estimates (Till 2035)
- 25.6.8. NFT Market in the Netherlands: Historical Trends (Since 2019) and Forecasted Estimates (Till 2035)
- 25.6.9. NFT Market in Norway: Historical Trends (Since 2019) and Forecasted Estimates (Till 2035)
- 25.6.10. NFT Market in Russia: Historical Trends (Since 2019) and Forecasted Estimates (Till 2035)
- 25.6.11. NFT Market in Spain: Historical Trends (Since 2019) and Forecasted Estimates (Till 2035)
- 25.6.12. NFT Market in Sweden: Historical Trends (Since 2019) and Forecasted Estimates (Till 2035)
- 25.6.13. NFT Market in Sweden: Historical Trends (Since 2019) and Forecasted Estimates (Till 2035)
- 25.6.14. NFT Market in Switzerland: Historical Trends (Since 2019) and Forecasted Estimates (Till 2035)
- 25.6.15. NFT Market in the UK: Historical Trends (Since 2019) and Forecasted Estimates (Till 2035)
- 25.6.16. NFT Market in Other European Countries: Historical Trends (Since 2019) and Forecasted Estimates (Till 2035)
- 25.7. Data Triangulation and Validation
26. MARKET OPPORTUNITIES FOR NFT IN ASIA
- 26.1. Chapter Overview
- 26.2. Key Assumptions and Methodology
- 26.3. Revenue Shift Analysis
- 26.4. Market Movement Analysis
- 26.5. Penetration-Growth (P-G) Matrix
- 26.6. NFT Market in Asia: Historical Trends (Since 2019) and Forecasted Estimates (Till 2035)
- 26.6.1. NFT Market in China: Historical Trends (Since 2019) and Forecasted Estimates (Till 2035)
- 26.6.2. NFT Market in India: Historical Trends (Since 2019) and Forecasted Estimates (Till 2035)
- 26.6.3. NFT Market in Japan: Historical Trends (Since 2019) and Forecasted Estimates (Till 2035)
- 26.6.4. NFT Market in Singapore: Historical Trends (Since 2019) and Forecasted Estimates (Till 2035)
- 26.6.5. NFT Market in South Korea: Historical Trends (Since 2019) and Forecasted Estimates (Till 2035)
- 26.6.6. NFT Market in Other Asian Countries: Historical Trends (Since 2019) and Forecasted Estimates (Till 2035)
- 26.7. Data Triangulation and Validation
27. MARKET OPPORTUNITIES FOR NFT IN MIDDLE EAST AND NORTH AFRICA (MENA)
- 27.1. Chapter Overview
- 27.2. Key Assumptions and Methodology
- 27.3. Revenue Shift Analysis
- 27.4. Market Movement Analysis
- 27.5. Penetration-Growth (P-G) Matrix
- 27.6. NFT Market in Middle East and North Africa (MENA): Historical Trends (Since 2019) and Forecasted Estimates (Till 2035)
- 27.6.1. NFT Market in Egypt: Historical Trends (Since 2019) and Forecasted Estimates (Till 205)
- 27.6.2. NFT Market in Iran: Historical Trends (Since 2019) and Forecasted Estimates (Till 2035)
- 27.6.3. NFT Market in Iraq: Historical Trends (Since 2019) and Forecasted Estimates (Till 2035)
- 27.6.4. NFT Market in Israel: Historical Trends (Since 2019) and Forecasted Estimates (Till 2035)
- 27.6.5. NFT Market in Kuwait: Historical Trends (Since 2019) and Forecasted Estimates (Till 2035)
- 27.6.6. NFT Market in Saudi Arabia: Historical Trends (Since 2019) and Forecasted Estimates (Till 2035)
- 27.6.7. NFT Market in United Arab Emirates (UAE): Historical Trends (Since 2019) and Forecasted Estimates (Till 2035)
- 27.6.8. NFT Market in Other MENA Countries: Historical Trends (Since 2019) and Forecasted Estimates (Till 2035)
- 27.7. Data Triangulation and Validation
28. MARKET OPPORTUNITIES FOR NFT IN LATIN AMERICA
- 28.1. Chapter Overview
- 28.2. Key Assumptions and Methodology
- 28.3. Revenue Shift Analysis
- 28.4. Market Movement Analysis
- 28.5. Penetration-Growth (P-G) Matrix
- 28.6. NFT Market in Latin America: Historical Trends (Since 2019) and Forecasted Estimates (Till 2035)
- 28.6.1. NFT Market in Argentina: Historical Trends (Since 2019) and Forecasted Estimates (Till 2035)
- 28.6.2. NFT Market in Brazil: Historical Trends (Since 2019) and Forecasted Estimates (Till 2035)
- 28.6.3. NFT Market in Chile: Historical Trends (Since 2019) and Forecasted Estimates (Till 2035)
- 28.6.4. NFT Market in Colombia Historical Trends (Since 2019) and Forecasted Estimates (Till 2035)
- 28.6.5. NFT Market in Venezuela: Historical Trends (Since 2019) and Forecasted Estimates (Till 2035)
- 28.6.6. NFT Market in Other Latin American Countries: Historical Trends (Since 2019) and Forecasted Estimates (Till 2035)
- 28.7. Data Triangulation and Validation
29. MARKET OPPORTUNITIES FOR NFT IN REST OF THE WORLD
- 29.1. Chapter Overview
- 29.2. Key Assumptions and Methodology
- 29.3. Revenue Shift Analysis
- 29.4. Market Movement Analysis
- 29.5. Penetration-Growth (P-G) Matrix
- 29.6. NFT Market in Rest of the World: Historical Trends (Since 2019) and Forecasted Estimates (Till 2035)
- 29.6.1. NFT Market in Australia: Historical Trends (Since 2019) and Forecasted Estimates (Till 2035)
- 29.6.2. NFT Market in New Zealand: Historical Trends (Since 2019) and Forecasted Estimates (Till 2035)
- 29.6.3. NFT Market in Other Countries
- 29.7. Data Triangulation and Validation
30. MARKET CONCENTRATION ANALYSIS: DISTRIBUTION BY LEADING PLAYERS
- 30.1. Leading Player 1
- 30.2. Leading Player 2
- 30.3. Leading Player 3
- 30.4. Leading Player 4
- 30.5. Leading Player 5
- 30.6. Leading Player 6
- 30.7. Leading Player 7
- 30.8. Leading Player 8
31. ADJACENT MARKET ANALYSIS
SECTION VII: STRATEGIC TOOLS
32. KEY WINNING STRATEGIES
33. PORTER'S FIVE FORCES ANALYSIS
34. SWOT ANALYSIS
35. VALUE CHAIN ANALYSIS
36. ROOTS STRATEGIC RECOMMENDATIONS
- 36.1. Chapter Overview
- 36.2. Key Business-related Strategies
- 36.2.1. Research & Development
- 36.2.2. Product Manufacturing
- 36.2.3. Commercialization / Go-to-Market
- 36.2.4. Sales and Marketing
- 36.3. Key Operations-related Strategies
- 36.3.1. Risk Management
- 36.3.2. Workforce
- 36.3.3. Finance
- 36.3.4. Others
SECTION VIII: OTHER EXCLUSIVE INSIGHTS
37. INSIGHTS FROM PRIMARY RESEARCH
38. REPORT CONCLUSION
SECTION IX: APPENDIX
39. TABULATED DATA
40. LIST OF COMPANIES AND ORGANIZATIONS
41. CUSTOMIZATION OPPORTUNITIES
42. ROOTS SUBSCRIPTION SERVICES
43. AUTHOR DETAILS
- 発行日
- 発行
- Roots Analysis
- ページ情報
- 英文 185 Pages
- 納期
- 7~10営業日


