|
|
市場調査レポート
商品コード
1643487
空間コンピューティングの市場Spatial Computing |
||||||
|
|||||||
適宜更新あり
|
|||||||

| 空間コンピューティングの市場 |
|
出版日: 2025年01月27日
発行: Market Glass, Inc. (Formerly Global Industry Analysts, Inc.)
ページ情報: 英文 188 Pages
納期: 即日から翌営業日
|

全表示
- 概要
- 目次
空間コンピューティングの世界市場は2030年までに4,212億米ドルに到達
2024年に1,303億米ドルと推定される空間コンピューティングの世界市場は、2024年から2030年にかけてCAGR 21.6%で成長し、2030年には4,212億米ドルに達すると予測されます。本レポートで分析したセグメントの1つである空間コンピューティングハードウェアは、CAGR 22.8%を記録し、分析期間終了時には2,998億米ドルに達すると予測されます。空間コンピューティングソフトウェア分野の成長率は、分析期間中CAGR 20.0%と推定されます。
米国市場は推定350億米ドル、中国はCAGR20.4%で成長予測
米国の空間コンピューティング市場は、2024年に350億米ドルと推定されます。世界第2位の経済大国である中国は、2030年までに639億米ドルの市場規模に達すると予測され、分析期間2024-2030年のCAGRは20.4%です。その他の注目すべき地域別市場としては、日本とカナダがあり、分析期間中のCAGRはそれぞれ19.7%と18.2%と予測されています。欧州では、ドイツがCAGR約14.5%で成長すると予測されています。
世界の空間コンピューティング市場- 主要動向と促進要因のまとめ
空間コンピューティングとは何か、なぜ重要なのか?
空間コンピューティングは、しばしば物理的領域とデジタル領域の融合と表現され、デジタル情報を物理的環境に直接埋め込むことで、テクノロジーとのインタラクションを根本的に変えています。従来のスクリーンベースのコンピューティングとは異なり、空間コンピューティングは拡張現実(AR)、仮想現実(VR)、人工知能(AI)を活用し、デジタル資産を現実空間に配置することで、より直感的で没入感のある体験を可能にします。この機能は、デバイスが周囲の奥行きや寸法を分析、理解、レンダリングすることを可能にする空間マッピングの進歩によって実現されています。空間コンピューティングでは、コンピュータビジョン、3Dイメージング、センサー技術などのツールを使って、対象物、距離、寸法を驚くほど正確に認識し、人間と同じように空間を解釈することができます。この物理的世界とデジタル世界の融合は、マイクロソフトのHoloLensやアップルのVision Proのような画期的なデバイスで紹介されており、様々なアプリケーションで没入感のある複合現実体験を提供しています。一方、AR機能を搭載したモバイルデバイスは、スマートフォンのカメラを通してデジタルオーバーレイを視覚化することを可能にし、空間コンピューティングを日常的に使用できるようにします。このような進歩は、デザイン、ヘルスケア、リテール、教育など多様な分野での産業革新に力を与え、人間とデジタル環境の相互作用において何が可能であるかという新しい基準を打ち立てます。
空間コンピューティングを導入している業界は?
空間コンピューティングは、生産性、顧客エンゲージメント、没入型トレーニングの新たな可能性を引き出すために、世界中の産業で採用されています。ヘルスケアでは、空間コンピューティングは外科医に使用されています。外科医はARオーバーレイを使用することで、手術中に患者の重要なデータに直接アクセスすることができ、ハンズフリーで手術に集中することができます。このリアルタイムの視覚化により、臓器、骨、血管の3Dモデルが提供され、リスクの軽減と治療成績の向上につながります。自動車業界では、空間コンピューティングによって、技術者は車両部品に直接投影された修理指示書に従うことができ、時間を節約し、メンテナンス・プロセスにおけるエラーを最小限に抑えることができます。IKEAのような小売業では、空間コンピューティングを使用して、顧客が家具をバーチャルに配置し、購入前に家具の見た目やフィット感を確認できるようにすることで、顧客の信頼を高め、返品率を下げています。不動産やアーキテクチャの分野でも、バーチャル・リアリティや拡張現実を利用して、物件の「デジタル・ツイン」を作成しています。これらのデジタル・レプリカは、顧客や建築家にスペースのレイアウト、照明、デザインの選択肢を明確に視覚化し、プロセスの初期段階でより多くの情報に基づいた意思決定を促進します。空間コンピューティングは、デジタル情報を物理的なスペースに直接埋め込むことで、ワークフローを強化し、トレーニングの取り組みをサポートし、効率を向上させ、様々な業界でその強力な効果を発揮しています。
空間コンピューティングはどのように消費者体験を形成していますか?
空間コンピューティングは業界を変革するだけでなく、消費者の体験を根本的に変え、パーソナライズされた、インタラクティブで、非常に魅力的な出会いを生み出しています。バーチャルな試着室、インタラクティブな広告、ARやVRで実現する没入型のブランドストーリーなど、今日の消費者は空間体験にますます惹かれています。空間コンピューティングテクノロジーがより身近で手頃なものになるにつれて、それは徐々に消費者とのインタラクションの主流になりつつあります。身近な例では、ソーシャルメディア上でARフィルターが広く使用され、ユーザーはデジタル要素とインタラクションできるようになり、多くの場合、ブランドキャンペーンの一環として使用されています。ARメガネやスマートコンタクトレンズのようなウェアラブル技術は、空間コンピューティングを日常生活にさらにシームレスに統合することが期待されています。ARやVRは、物理的な環境とデジタルの物語を融合させ、新たなレベルの没入感とインタラクティブ性をもたらします。教育分野では、空間コンピューティングによって、生徒がバーチャルなフィールドトリップで史跡を探検したり、インタラクティブな3Dモデルで複雑なテーマを学んだりすることが可能になり、教科書だけでは得られない実践的な学習体験が実現します。このような開発は、リッチで文脈のあるインタラクティブなデジタルインタラクションに対する消費者の期待の変化を反映したものであり、ますます空間的な世界が広がる中で、人々がテクノロジーとの関わりに求めるものを再構築しています。
空間コンピューティング市場の成長の原動力は?
空間コンピューティング市場の成長は、急速な技術進歩、消費者行動の進化、産業アプリケーションの拡大など、いくつかの要因によって牽引されています。技術的には、処理能力、空間マッピングアルゴリズム、センサー精度の継続的な進歩により、空間コンピューティングデバイスはより高速で、より手頃な価格で、非常に効果的になっています。また、5G技術の登場は、リアルタイムのARおよびVRアプリケーションに不可欠なデータ・トランスミッションの速度と信頼性を高めることで、この市場に大きな影響を与えています。この接続性の向上により、ゲーム、ヘルスケア、リモートワークなどの業界で重要な、スムーズで応答性の高い空間コンピューティング体験が可能になります。消費者側では、特にデジタル技術やインタラクティブ技術で育った若い世代を中心に、没入体験に対する需要が高まっています。この需要は、インタラクティブなバーチャル・ショッピング体験からゲーム化された学習環境まで、より魅力的なアプリケーションの開発を各業界に促しています。また、さまざまな分野の企業が、トレーニング、メンテナンス、コラボレーションのための費用対効果の高いリモートソリューションを作成するために、空間コンピューティングを利用しています。特に、リモートワークへのシフトにより、物理的な環境をシミュレートしたバーチャルコラボレーションを促進する手段として空間コンピューティングが注目されています。さらに、空間コンピューティングアプリケーションのデータプライバシーとセキュリティに対する規制の高まりは、企業の責任ある技術革新を促し、これらのテクノロジーに対するユーザーの信頼を高めています。これらの要因から、空間コンピューティングは、業界全体のデジタルトランスフォーメーションを再定義する基盤技術として、その役割が拡大していることがわかります。
セグメント
コンポーネント(空間コンピューティングハードウェア、空間コンピューティングソフトウェア、空間コンピューティングサービス)、テクノロジー(拡張現実(AR)テクノロジー、仮想現実(VR)テクノロジー、モノのインターネット(IoT)テクノロジー、人工知能(AI)テクノロジー、複合現実(MR)テクノロジー、その他テクノロジー)、エンドユーザー(ヘルスケアエンドユーザー、メディア&エンターテイメントエンドユーザー、製造エンドユーザー、小売&eコマースエンドユーザー、教育&トレーニングエンドユーザー、不動産エンドユーザー、その他エンドユーザー)
調査対象企業の例(注目の44社)
- Apple, Inc.
- Blippar.Com Ltd.
- EON Reality, Inc.
- Google LLC
- Lenovo Group Ltd.
- Magic Leap, Inc.
- Meta Platforms, Inc.
- Microsoft Corporation
- NVIDIA Corporation
- PTC, Inc.
目次
第1章 調査手法
第2章 エグゼクティブサマリー
- 市場概要
- 主要企業
- 市場動向と促進要因
- 世界市場の見通し
第3章 市場分析
- 米国
- カナダ
- 日本
- 中国
- 欧州
- フランス
- ドイツ
- イタリア
- 英国
- その他欧州
- アジア太平洋
- その他の地域
第4章 競合
Global Spatial Computing Market to Reach US$421.2 Billion by 2030
The global market for Spatial Computing estimated at US$130.3 Billion in the year 2024, is expected to reach US$421.2 Billion by 2030, growing at a CAGR of 21.6% over the analysis period 2024-2030. Spatial Computing Hardware, one of the segments analyzed in the report, is expected to record a 22.8% CAGR and reach US$299.8 Billion by the end of the analysis period. Growth in the Spatial Computing Software segment is estimated at 20.0% CAGR over the analysis period.
The U.S. Market is Estimated at US$35.0 Billion While China is Forecast to Grow at 20.4% CAGR
The Spatial Computing market in the U.S. is estimated at US$35.0 Billion in the year 2024. China, the world's second largest economy, is forecast to reach a projected market size of US$63.9 Billion by the year 2030 trailing a CAGR of 20.4% over the analysis period 2024-2030. Among the other noteworthy geographic markets are Japan and Canada, each forecast to grow at a CAGR of 19.7% and 18.2% respectively over the analysis period. Within Europe, Germany is forecast to grow at approximately 14.5% CAGR.
Global Spatial Computing Market - Key Trends and Drivers Summarized
What is Spatial Computing and Why Does It Matter?
Spatial computing, often described as the convergence of physical and digital realms, is fundamentally transforming our interactions with technology by embedding digital information directly into the physical environment. Unlike traditional screen-based computing, spatial computing leverages augmented reality (AR), virtual reality (VR), and artificial intelligence (AI) to place digital assets into real-world spaces, enabling a more intuitive and immersive experience. This capability is made possible through advancements in spatial mapping, which allows devices to analyze, understand, and render depth and dimensions of the surrounding area. With spatial computing, devices are able to interpret spaces much like humans do, using tools like computer vision, 3D imaging, and sensor technology to recognize objects, distances, and dimensions with remarkable precision. This blend of physical and digital worlds is showcased in groundbreaking devices like Microsoft's HoloLens and Apple's Vision Pro, which provide immersive, mixed-reality experiences across various applications. Meanwhile, mobile devices with AR capabilities bring spatial computing into everyday use, allowing people to visualize digital overlays through smartphone cameras. Such advancements empower industries to innovate in fields as diverse as design, healthcare, retail, and education, setting new standards for what is possible in the interaction between humans and digital environments.
How Are Industries Embracing Spatial Computing?
Industries across the globe are adopting spatial computing to unlock new possibilities in productivity, customer engagement, and immersive training. In healthcare, spatial computing is being used by surgeons who rely on AR overlays to access vital patient data directly in their field of view during operations, allowing them to remain hands-free and focused. This real-time visualization provides 3D models of organs, bones, or even blood vessels, reducing risk and improving outcomes. In the automotive industry, spatial computing enables technicians to follow repair instructions projected directly onto vehicle parts, saving time and minimizing errors in the maintenance process. Retailers like IKEA are employing spatial computing to let customers virtually place furniture in their homes, allowing them to see how pieces would look and fit before making a purchase, thus boosting customer confidence and reducing return rates. The real estate and architecture sectors, too, are using virtual reality and augmented reality to create "digital twins" of properties. These digital replicas offer clients and architects a clear visualization of space layouts, lighting, and design choices, fostering more informed decision-making early in the process. By embedding digital information directly into physical spaces, spatial computing enhances workflows, supports training initiatives, and improves efficiency, demonstrating its powerful impact across various industries.
How is Spatial Computing Shaping Consumer Experiences?
Spatial computing is not only transforming industries but is also fundamentally altering consumer experiences, creating personalized, interactive, and highly engaging encounters. Today’s consumers are increasingly drawn to spatial experiences, whether it’s virtual fitting rooms, interactive advertisements, or immersive brand stories made possible through AR and VR. As spatial computing technology becomes more accessible and affordable, it is gradually becoming a part of mainstream consumer interactions. A familiar example is the widespread use of AR filters on social media, allowing users to interact with digital elements, often as part of a brand campaign. Wearable technology, like AR glasses and, potentially, smart contact lenses, is on the horizon, promising to integrate spatial computing even more seamlessly into daily life. The gaming industry is also experiencing a major shift, as AR and VR blend physical surroundings with digital narratives, introducing a new level of immersion and interactivity. In the education sector, spatial computing enables students to explore historical sites through virtual field trips or to study complex subjects with interactive 3D models, creating a hands-on learning experience that textbooks alone cannot provide. These developments reflect a changing consumer expectation for rich, contextual, and interactive digital interactions, reshaping what people seek from their engagement with technology in an increasingly spatial world.
What’s Driving Growth in the Spatial Computing Market?
The growth in the spatial computing market is driven by several factors, including rapid technological advancements, evolving consumer behavior, and a broadening range of industry applications. Technologically, continuous advancements in processing power, spatial mapping algorithms, and sensor precision are making spatial computing devices faster, more affordable, and highly effective. The emergence of 5G technology is also significantly impacting this market by enhancing the speed and reliability of data transmission, which is essential for real-time AR and VR applications. This connectivity boost allows for smooth, responsive spatial computing experiences that are critical in industries like gaming, healthcare, and remote work. On the consumer front, there is an increasing demand for immersive experiences, especially among younger generations who have grown up with digital and interactive technologies. This demand is encouraging industries to create more engaging applications, from interactive virtual shopping experiences to gamified learning environments. Businesses across sectors are also turning to spatial computing to create cost-effective remote solutions for training, maintenance, and collaboration. In particular, the shift toward remote work has led organizations to explore spatial computing as a means of facilitating virtual collaboration in a simulated physical environment. Furthermore, a growing regulatory focus on data privacy and security for spatial computing applications encourages companies to innovate responsibly, enhancing user trust in these technologies. Altogether, these drivers underscore the expanding role of spatial computing as a foundational technology poised to redefine digital transformation across industries.
SCOPE OF STUDY:
The report analyzes the Spatial Computing market in terms of units by the following Segments, and Geographic Regions/Countries:
Segments:
Component (Spatial Computing Hardware, Spatial Computing Software, Spatial Computing Services); Technology (Augmented Reality (AR) Technology, Virtual Reality (VR) Technology, Internet of Things (IoT) Technology, Artificial Intelligence (AI) Technology, Mixed Reality (MR) Technology, Other Technologies); End-Use (Healthcare End-Use, Media & Entertainment End-Use, Manufacturing End-Use, Retail & eCommerce End-Use, Education & Training End-Use, Real Estate End-Use, Other End-Uses)
Geographic Regions/Countries:
World; USA; Canada; Japan; China; Europe; France; Germany; Italy; UK; Rest of Europe; Asia-Pacific; Rest of World.
Select Competitors (Total 44 Featured) -
- Apple, Inc.
- Blippar.Com Ltd.
- EON Reality, Inc.
- Google LLC
- Lenovo Group Ltd.
- Magic Leap, Inc.
- Meta Platforms, Inc.
- Microsoft Corporation
- NVIDIA Corporation
- PTC, Inc.
TABLE OF CONTENTS
I. METHODOLOGY
II. EXECUTIVE SUMMARY
- 1. MARKET OVERVIEW
- Influencer Market Insights
- World Market Trajectories
- Economic Frontiers: Trends, Trials & Transformations
- Spatial Computing - Global Key Competitors Percentage Market Share in 2024 (E)
- Competitive Market Presence - Strong/Active/Niche/Trivial for Players Worldwide in 2024 (E)
- 2. FOCUS ON SELECT PLAYERS
- 3. MARKET TRENDS & DRIVERS
- Rising Demand for Immersive Technologies Drives Growth in the Spatial Computing Market
- Increasing Popularity of Augmented Reality (AR) and Virtual Reality (VR) Fuels Adoption of Spatial Computing
- Here's How Advances in AI and Machine Learning Enhance the Capabilities of Spatial Computing
- Growing Focus on Smart Cities and Urban Planning Expands Demand for Spatial Computing Solutions
- Rising Interest in Remote Work and Collaboration Drives Adoption of Spatial Computing in Virtual Environments
- Here's How Spatial Computing Improves Real-Time Data Visualization and Decision Making
- Increasing Use of Spatial Computing in Healthcare Drives Innovation in Medical Imaging and Surgery
- Focus on Enhancing User Experience Supports Development of More Intuitive Spatial Computing Interfaces
- Growing Adoption of 5G and Edge Computing Expands the Potential of Real-Time Spatial Data Processing
- Here's How Geographic Information Systems (GIS) and Spatial Computing Fuel Advancements in Urban Development
- Increasing Demand for Interactive and Personalized Content Drives Growth in Spatial Computing for Entertainment
- Rising Demand for Autonomous Vehicles Fuels Use of Spatial Computing in Navigation and Control Systems
- 4. GLOBAL MARKET PERSPECTIVE
- TABLE 1: World Spatial Computing Market Analysis of Annual Sales in US$ Million for Years 2015 through 2030
- TABLE 2: World Recent Past, Current & Future Analysis for Spatial Computing by Geographic Region - USA, Canada, Japan, China, Europe, Asia-Pacific and Rest of World Markets - Independent Analysis of Annual Revenues in US$ Million for Years 2024 through 2030 and % CAGR
- TABLE 3: World 6-Year Perspective for Spatial Computing by Geographic Region - Percentage Breakdown of Value Revenues for USA, Canada, Japan, China, Europe, Asia-Pacific and Rest of World Markets for Years 2025 & 2030
- TABLE 4: World Recent Past, Current & Future Analysis for Spatial Computing Hardware by Geographic Region - USA, Canada, Japan, China, Europe, Asia-Pacific and Rest of World Markets - Independent Analysis of Annual Revenues in US$ Million for Years 2024 through 2030 and % CAGR
- TABLE 5: World 6-Year Perspective for Spatial Computing Hardware by Geographic Region - Percentage Breakdown of Value Revenues for USA, Canada, Japan, China, Europe, Asia-Pacific and Rest of World for Years 2025 & 2030
- TABLE 6: World Recent Past, Current & Future Analysis for Spatial Computing Software by Geographic Region - USA, Canada, Japan, China, Europe, Asia-Pacific and Rest of World Markets - Independent Analysis of Annual Revenues in US$ Million for Years 2024 through 2030 and % CAGR
- TABLE 7: World 6-Year Perspective for Spatial Computing Software by Geographic Region - Percentage Breakdown of Value Revenues for USA, Canada, Japan, China, Europe, Asia-Pacific and Rest of World for Years 2025 & 2030
- TABLE 8: World Recent Past, Current & Future Analysis for Spatial Computing Services by Geographic Region - USA, Canada, Japan, China, Europe, Asia-Pacific and Rest of World Markets - Independent Analysis of Annual Revenues in US$ Million for Years 2024 through 2030 and % CAGR
- TABLE 9: World 6-Year Perspective for Spatial Computing Services by Geographic Region - Percentage Breakdown of Value Revenues for USA, Canada, Japan, China, Europe, Asia-Pacific and Rest of World for Years 2025 & 2030
- TABLE 10: World Recent Past, Current & Future Analysis for Augmented Reality (AR) Technology by Geographic Region - USA, Canada, Japan, China, Europe, Asia-Pacific and Rest of World Markets - Independent Analysis of Annual Revenues in US$ Million for Years 2024 through 2030 and % CAGR
- TABLE 11: World 6-Year Perspective for Augmented Reality (AR) Technology by Geographic Region - Percentage Breakdown of Value Revenues for USA, Canada, Japan, China, Europe, Asia-Pacific and Rest of World for Years 2025 & 2030
- TABLE 12: World Recent Past, Current & Future Analysis for Virtual Reality (VR) Technology by Geographic Region - USA, Canada, Japan, China, Europe, Asia-Pacific and Rest of World Markets - Independent Analysis of Annual Revenues in US$ Million for Years 2024 through 2030 and % CAGR
- TABLE 13: World 6-Year Perspective for Virtual Reality (VR) Technology by Geographic Region - Percentage Breakdown of Value Revenues for USA, Canada, Japan, China, Europe, Asia-Pacific and Rest of World for Years 2025 & 2030
- TABLE 14: World Recent Past, Current & Future Analysis for Internet of Things (IoT) Technology by Geographic Region - USA, Canada, Japan, China, Europe, Asia-Pacific and Rest of World Markets - Independent Analysis of Annual Revenues in US$ Million for Years 2024 through 2030 and % CAGR
- TABLE 15: World 6-Year Perspective for Internet of Things (IoT) Technology by Geographic Region - Percentage Breakdown of Value Revenues for USA, Canada, Japan, China, Europe, Asia-Pacific and Rest of World for Years 2025 & 2030
- TABLE 16: World Recent Past, Current & Future Analysis for Artificial Intelligence (AI) Technology by Geographic Region - USA, Canada, Japan, China, Europe, Asia-Pacific and Rest of World Markets - Independent Analysis of Annual Revenues in US$ Million for Years 2024 through 2030 and % CAGR
- TABLE 17: World 6-Year Perspective for Artificial Intelligence (AI) Technology by Geographic Region - Percentage Breakdown of Value Revenues for USA, Canada, Japan, China, Europe, Asia-Pacific and Rest of World for Years 2025 & 2030
- TABLE 18: World Recent Past, Current & Future Analysis for Mixed Reality (MR) Technology by Geographic Region - USA, Canada, Japan, China, Europe, Asia-Pacific and Rest of World Markets - Independent Analysis of Annual Revenues in US$ Million for Years 2024 through 2030 and % CAGR
- TABLE 19: World 6-Year Perspective for Mixed Reality (MR) Technology by Geographic Region - Percentage Breakdown of Value Revenues for USA, Canada, Japan, China, Europe, Asia-Pacific and Rest of World for Years 2025 & 2030
- TABLE 20: World Recent Past, Current & Future Analysis for Other Technologies by Geographic Region - USA, Canada, Japan, China, Europe, Asia-Pacific and Rest of World Markets - Independent Analysis of Annual Revenues in US$ Million for Years 2024 through 2030 and % CAGR
- TABLE 21: World 6-Year Perspective for Other Technologies by Geographic Region - Percentage Breakdown of Value Revenues for USA, Canada, Japan, China, Europe, Asia-Pacific and Rest of World for Years 2025 & 2030
- TABLE 22: World Recent Past, Current & Future Analysis for Healthcare End-Use by Geographic Region - USA, Canada, Japan, China, Europe, Asia-Pacific and Rest of World Markets - Independent Analysis of Annual Revenues in US$ Million for Years 2024 through 2030 and % CAGR
- TABLE 23: World 6-Year Perspective for Healthcare End-Use by Geographic Region - Percentage Breakdown of Value Revenues for USA, Canada, Japan, China, Europe, Asia-Pacific and Rest of World for Years 2025 & 2030
- TABLE 24: World Recent Past, Current & Future Analysis for Media & Entertainment End-Use by Geographic Region - USA, Canada, Japan, China, Europe, Asia-Pacific and Rest of World Markets - Independent Analysis of Annual Revenues in US$ Million for Years 2024 through 2030 and % CAGR
- TABLE 25: World 6-Year Perspective for Media & Entertainment End-Use by Geographic Region - Percentage Breakdown of Value Revenues for USA, Canada, Japan, China, Europe, Asia-Pacific and Rest of World for Years 2025 & 2030
- TABLE 26: World Recent Past, Current & Future Analysis for Manufacturing End-Use by Geographic Region - USA, Canada, Japan, China, Europe, Asia-Pacific and Rest of World Markets - Independent Analysis of Annual Revenues in US$ Million for Years 2024 through 2030 and % CAGR
- TABLE 27: World 6-Year Perspective for Manufacturing End-Use by Geographic Region - Percentage Breakdown of Value Revenues for USA, Canada, Japan, China, Europe, Asia-Pacific and Rest of World for Years 2025 & 2030
- TABLE 28: World Recent Past, Current & Future Analysis for Retail & eCommerce End-Use by Geographic Region - USA, Canada, Japan, China, Europe, Asia-Pacific and Rest of World Markets - Independent Analysis of Annual Revenues in US$ Million for Years 2024 through 2030 and % CAGR
- TABLE 29: World 6-Year Perspective for Retail & eCommerce End-Use by Geographic Region - Percentage Breakdown of Value Revenues for USA, Canada, Japan, China, Europe, Asia-Pacific and Rest of World for Years 2025 & 2030
- TABLE 30: World Recent Past, Current & Future Analysis for Education & Training End-Use by Geographic Region - USA, Canada, Japan, China, Europe, Asia-Pacific and Rest of World Markets - Independent Analysis of Annual Revenues in US$ Million for Years 2024 through 2030 and % CAGR
- TABLE 31: World 6-Year Perspective for Education & Training End-Use by Geographic Region - Percentage Breakdown of Value Revenues for USA, Canada, Japan, China, Europe, Asia-Pacific and Rest of World for Years 2025 & 2030
- TABLE 32: World Recent Past, Current & Future Analysis for Real Estate End-Use by Geographic Region - USA, Canada, Japan, China, Europe, Asia-Pacific and Rest of World Markets - Independent Analysis of Annual Revenues in US$ Million for Years 2024 through 2030 and % CAGR
- TABLE 33: World 6-Year Perspective for Real Estate End-Use by Geographic Region - Percentage Breakdown of Value Revenues for USA, Canada, Japan, China, Europe, Asia-Pacific and Rest of World for Years 2025 & 2030
- TABLE 34: World Recent Past, Current & Future Analysis for Other End-Uses by Geographic Region - USA, Canada, Japan, China, Europe, Asia-Pacific and Rest of World Markets - Independent Analysis of Annual Revenues in US$ Million for Years 2024 through 2030 and % CAGR
- TABLE 35: World 6-Year Perspective for Other End-Uses by Geographic Region - Percentage Breakdown of Value Revenues for USA, Canada, Japan, China, Europe, Asia-Pacific and Rest of World for Years 2025 & 2030
III. MARKET ANALYSIS
- UNITED STATES
- Spatial Computing Market Presence - Strong/Active/Niche/Trivial - Key Competitors in the United States for 2025 (E)
- TABLE 36: USA Recent Past, Current & Future Analysis for Spatial Computing by Component - Spatial Computing Hardware, Spatial Computing Software and Spatial Computing Services - Independent Analysis of Annual Revenues in US$ Million for the Years 2024 through 2030 and % CAGR
- TABLE 37: USA 6-Year Perspective for Spatial Computing by Component - Percentage Breakdown of Value Revenues for Spatial Computing Hardware, Spatial Computing Software and Spatial Computing Services for the Years 2025 & 2030
- TABLE 38: USA Recent Past, Current & Future Analysis for Spatial Computing by Technology - Augmented Reality (AR) Technology, Virtual Reality (VR) Technology, Internet of Things (IoT) Technology, Artificial Intelligence (AI) Technology, Mixed Reality (MR) Technology and Other Technologies - Independent Analysis of Annual Revenues in US$ Million for the Years 2024 through 2030 and % CAGR
- TABLE 39: USA 6-Year Perspective for Spatial Computing by Technology - Percentage Breakdown of Value Revenues for Augmented Reality (AR) Technology, Virtual Reality (VR) Technology, Internet of Things (IoT) Technology, Artificial Intelligence (AI) Technology, Mixed Reality (MR) Technology and Other Technologies for the Years 2025 & 2030
- TABLE 40: USA Recent Past, Current & Future Analysis for Spatial Computing by End-Use - Healthcare End-Use, Media & Entertainment End-Use, Manufacturing End-Use, Retail & eCommerce End-Use, Education & Training End-Use, Real Estate End-Use and Other End-Uses - Independent Analysis of Annual Revenues in US$ Million for the Years 2024 through 2030 and % CAGR
- TABLE 41: USA 6-Year Perspective for Spatial Computing by End-Use - Percentage Breakdown of Value Revenues for Healthcare End-Use, Media & Entertainment End-Use, Manufacturing End-Use, Retail & eCommerce End-Use, Education & Training End-Use, Real Estate End-Use and Other End-Uses for the Years 2025 & 2030
- CANADA
- TABLE 42: Canada Recent Past, Current & Future Analysis for Spatial Computing by Component - Spatial Computing Hardware, Spatial Computing Software and Spatial Computing Services - Independent Analysis of Annual Revenues in US$ Million for the Years 2024 through 2030 and % CAGR
- TABLE 43: Canada 6-Year Perspective for Spatial Computing by Component - Percentage Breakdown of Value Revenues for Spatial Computing Hardware, Spatial Computing Software and Spatial Computing Services for the Years 2025 & 2030
- TABLE 44: Canada Recent Past, Current & Future Analysis for Spatial Computing by Technology - Augmented Reality (AR) Technology, Virtual Reality (VR) Technology, Internet of Things (IoT) Technology, Artificial Intelligence (AI) Technology, Mixed Reality (MR) Technology and Other Technologies - Independent Analysis of Annual Revenues in US$ Million for the Years 2024 through 2030 and % CAGR
- TABLE 45: Canada 6-Year Perspective for Spatial Computing by Technology - Percentage Breakdown of Value Revenues for Augmented Reality (AR) Technology, Virtual Reality (VR) Technology, Internet of Things (IoT) Technology, Artificial Intelligence (AI) Technology, Mixed Reality (MR) Technology and Other Technologies for the Years 2025 & 2030
- TABLE 46: Canada Recent Past, Current & Future Analysis for Spatial Computing by End-Use - Healthcare End-Use, Media & Entertainment End-Use, Manufacturing End-Use, Retail & eCommerce End-Use, Education & Training End-Use, Real Estate End-Use and Other End-Uses - Independent Analysis of Annual Revenues in US$ Million for the Years 2024 through 2030 and % CAGR
- TABLE 47: Canada 6-Year Perspective for Spatial Computing by End-Use - Percentage Breakdown of Value Revenues for Healthcare End-Use, Media & Entertainment End-Use, Manufacturing End-Use, Retail & eCommerce End-Use, Education & Training End-Use, Real Estate End-Use and Other End-Uses for the Years 2025 & 2030
- JAPAN
- Spatial Computing Market Presence - Strong/Active/Niche/Trivial - Key Competitors in Japan for 2025 (E)
- TABLE 48: Japan Recent Past, Current & Future Analysis for Spatial Computing by Component - Spatial Computing Hardware, Spatial Computing Software and Spatial Computing Services - Independent Analysis of Annual Revenues in US$ Million for the Years 2024 through 2030 and % CAGR
- TABLE 49: Japan 6-Year Perspective for Spatial Computing by Component - Percentage Breakdown of Value Revenues for Spatial Computing Hardware, Spatial Computing Software and Spatial Computing Services for the Years 2025 & 2030
- TABLE 50: Japan Recent Past, Current & Future Analysis for Spatial Computing by Technology - Augmented Reality (AR) Technology, Virtual Reality (VR) Technology, Internet of Things (IoT) Technology, Artificial Intelligence (AI) Technology, Mixed Reality (MR) Technology and Other Technologies - Independent Analysis of Annual Revenues in US$ Million for the Years 2024 through 2030 and % CAGR
- TABLE 51: Japan 6-Year Perspective for Spatial Computing by Technology - Percentage Breakdown of Value Revenues for Augmented Reality (AR) Technology, Virtual Reality (VR) Technology, Internet of Things (IoT) Technology, Artificial Intelligence (AI) Technology, Mixed Reality (MR) Technology and Other Technologies for the Years 2025 & 2030
- TABLE 52: Japan Recent Past, Current & Future Analysis for Spatial Computing by End-Use - Healthcare End-Use, Media & Entertainment End-Use, Manufacturing End-Use, Retail & eCommerce End-Use, Education & Training End-Use, Real Estate End-Use and Other End-Uses - Independent Analysis of Annual Revenues in US$ Million for the Years 2024 through 2030 and % CAGR
- TABLE 53: Japan 6-Year Perspective for Spatial Computing by End-Use - Percentage Breakdown of Value Revenues for Healthcare End-Use, Media & Entertainment End-Use, Manufacturing End-Use, Retail & eCommerce End-Use, Education & Training End-Use, Real Estate End-Use and Other End-Uses for the Years 2025 & 2030
- CHINA
- Spatial Computing Market Presence - Strong/Active/Niche/Trivial - Key Competitors in China for 2025 (E)
- TABLE 54: China Recent Past, Current & Future Analysis for Spatial Computing by Component - Spatial Computing Hardware, Spatial Computing Software and Spatial Computing Services - Independent Analysis of Annual Revenues in US$ Million for the Years 2024 through 2030 and % CAGR
- TABLE 55: China 6-Year Perspective for Spatial Computing by Component - Percentage Breakdown of Value Revenues for Spatial Computing Hardware, Spatial Computing Software and Spatial Computing Services for the Years 2025 & 2030
- TABLE 56: China Recent Past, Current & Future Analysis for Spatial Computing by Technology - Augmented Reality (AR) Technology, Virtual Reality (VR) Technology, Internet of Things (IoT) Technology, Artificial Intelligence (AI) Technology, Mixed Reality (MR) Technology and Other Technologies - Independent Analysis of Annual Revenues in US$ Million for the Years 2024 through 2030 and % CAGR
- TABLE 57: China 6-Year Perspective for Spatial Computing by Technology - Percentage Breakdown of Value Revenues for Augmented Reality (AR) Technology, Virtual Reality (VR) Technology, Internet of Things (IoT) Technology, Artificial Intelligence (AI) Technology, Mixed Reality (MR) Technology and Other Technologies for the Years 2025 & 2030
- TABLE 58: China Recent Past, Current & Future Analysis for Spatial Computing by End-Use - Healthcare End-Use, Media & Entertainment End-Use, Manufacturing End-Use, Retail & eCommerce End-Use, Education & Training End-Use, Real Estate End-Use and Other End-Uses - Independent Analysis of Annual Revenues in US$ Million for the Years 2024 through 2030 and % CAGR
- TABLE 59: China 6-Year Perspective for Spatial Computing by End-Use - Percentage Breakdown of Value Revenues for Healthcare End-Use, Media & Entertainment End-Use, Manufacturing End-Use, Retail & eCommerce End-Use, Education & Training End-Use, Real Estate End-Use and Other End-Uses for the Years 2025 & 2030
- EUROPE
- Spatial Computing Market Presence - Strong/Active/Niche/Trivial - Key Competitors in Europe for 2025 (E)
- TABLE 60: Europe Recent Past, Current & Future Analysis for Spatial Computing by Geographic Region - France, Germany, Italy, UK and Rest of Europe Markets - Independent Analysis of Annual Revenues in US$ Million for Years 2024 through 2030 and % CAGR
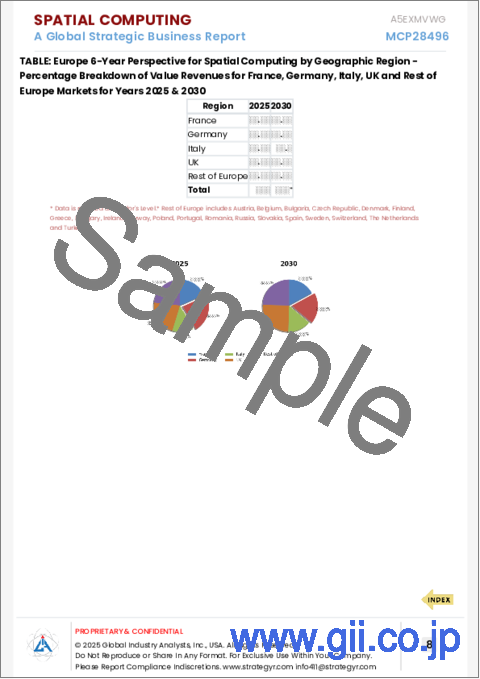
- TABLE 61: Europe 6-Year Perspective for Spatial Computing by Geographic Region - Percentage Breakdown of Value Revenues for France, Germany, Italy, UK and Rest of Europe Markets for Years 2025 & 2030
- TABLE 62: Europe Recent Past, Current & Future Analysis for Spatial Computing by Component - Spatial Computing Hardware, Spatial Computing Software and Spatial Computing Services - Independent Analysis of Annual Revenues in US$ Million for the Years 2024 through 2030 and % CAGR
- TABLE 63: Europe 6-Year Perspective for Spatial Computing by Component - Percentage Breakdown of Value Revenues for Spatial Computing Hardware, Spatial Computing Software and Spatial Computing Services for the Years 2025 & 2030
- TABLE 64: Europe Recent Past, Current & Future Analysis for Spatial Computing by Technology - Augmented Reality (AR) Technology, Virtual Reality (VR) Technology, Internet of Things (IoT) Technology, Artificial Intelligence (AI) Technology, Mixed Reality (MR) Technology and Other Technologies - Independent Analysis of Annual Revenues in US$ Million for the Years 2024 through 2030 and % CAGR
- TABLE 65: Europe 6-Year Perspective for Spatial Computing by Technology - Percentage Breakdown of Value Revenues for Augmented Reality (AR) Technology, Virtual Reality (VR) Technology, Internet of Things (IoT) Technology, Artificial Intelligence (AI) Technology, Mixed Reality (MR) Technology and Other Technologies for the Years 2025 & 2030
- TABLE 66: Europe Recent Past, Current & Future Analysis for Spatial Computing by End-Use - Healthcare End-Use, Media & Entertainment End-Use, Manufacturing End-Use, Retail & eCommerce End-Use, Education & Training End-Use, Real Estate End-Use and Other End-Uses - Independent Analysis of Annual Revenues in US$ Million for the Years 2024 through 2030 and % CAGR
- TABLE 67: Europe 6-Year Perspective for Spatial Computing by End-Use - Percentage Breakdown of Value Revenues for Healthcare End-Use, Media & Entertainment End-Use, Manufacturing End-Use, Retail & eCommerce End-Use, Education & Training End-Use, Real Estate End-Use and Other End-Uses for the Years 2025 & 2030
- FRANCE
- Spatial Computing Market Presence - Strong/Active/Niche/Trivial - Key Competitors in France for 2025 (E)
- TABLE 68: France Recent Past, Current & Future Analysis for Spatial Computing by Component - Spatial Computing Hardware, Spatial Computing Software and Spatial Computing Services - Independent Analysis of Annual Revenues in US$ Million for the Years 2024 through 2030 and % CAGR
- TABLE 69: France 6-Year Perspective for Spatial Computing by Component - Percentage Breakdown of Value Revenues for Spatial Computing Hardware, Spatial Computing Software and Spatial Computing Services for the Years 2025 & 2030
- TABLE 70: France Recent Past, Current & Future Analysis for Spatial Computing by Technology - Augmented Reality (AR) Technology, Virtual Reality (VR) Technology, Internet of Things (IoT) Technology, Artificial Intelligence (AI) Technology, Mixed Reality (MR) Technology and Other Technologies - Independent Analysis of Annual Revenues in US$ Million for the Years 2024 through 2030 and % CAGR
- TABLE 71: France 6-Year Perspective for Spatial Computing by Technology - Percentage Breakdown of Value Revenues for Augmented Reality (AR) Technology, Virtual Reality (VR) Technology, Internet of Things (IoT) Technology, Artificial Intelligence (AI) Technology, Mixed Reality (MR) Technology and Other Technologies for the Years 2025 & 2030
- TABLE 72: France Recent Past, Current & Future Analysis for Spatial Computing by End-Use - Healthcare End-Use, Media & Entertainment End-Use, Manufacturing End-Use, Retail & eCommerce End-Use, Education & Training End-Use, Real Estate End-Use and Other End-Uses - Independent Analysis of Annual Revenues in US$ Million for the Years 2024 through 2030 and % CAGR
- TABLE 73: France 6-Year Perspective for Spatial Computing by End-Use - Percentage Breakdown of Value Revenues for Healthcare End-Use, Media & Entertainment End-Use, Manufacturing End-Use, Retail & eCommerce End-Use, Education & Training End-Use, Real Estate End-Use and Other End-Uses for the Years 2025 & 2030
- GERMANY
- Spatial Computing Market Presence - Strong/Active/Niche/Trivial - Key Competitors in Germany for 2025 (E)
- TABLE 74: Germany Recent Past, Current & Future Analysis for Spatial Computing by Component - Spatial Computing Hardware, Spatial Computing Software and Spatial Computing Services - Independent Analysis of Annual Revenues in US$ Million for the Years 2024 through 2030 and % CAGR
- TABLE 75: Germany 6-Year Perspective for Spatial Computing by Component - Percentage Breakdown of Value Revenues for Spatial Computing Hardware, Spatial Computing Software and Spatial Computing Services for the Years 2025 & 2030
- TABLE 76: Germany Recent Past, Current & Future Analysis for Spatial Computing by Technology - Augmented Reality (AR) Technology, Virtual Reality (VR) Technology, Internet of Things (IoT) Technology, Artificial Intelligence (AI) Technology, Mixed Reality (MR) Technology and Other Technologies - Independent Analysis of Annual Revenues in US$ Million for the Years 2024 through 2030 and % CAGR
- TABLE 77: Germany 6-Year Perspective for Spatial Computing by Technology - Percentage Breakdown of Value Revenues for Augmented Reality (AR) Technology, Virtual Reality (VR) Technology, Internet of Things (IoT) Technology, Artificial Intelligence (AI) Technology, Mixed Reality (MR) Technology and Other Technologies for the Years 2025 & 2030
- TABLE 78: Germany Recent Past, Current & Future Analysis for Spatial Computing by End-Use - Healthcare End-Use, Media & Entertainment End-Use, Manufacturing End-Use, Retail & eCommerce End-Use, Education & Training End-Use, Real Estate End-Use and Other End-Uses - Independent Analysis of Annual Revenues in US$ Million for the Years 2024 through 2030 and % CAGR
- TABLE 79: Germany 6-Year Perspective for Spatial Computing by End-Use - Percentage Breakdown of Value Revenues for Healthcare End-Use, Media & Entertainment End-Use, Manufacturing End-Use, Retail & eCommerce End-Use, Education & Training End-Use, Real Estate End-Use and Other End-Uses for the Years 2025 & 2030
- ITALY
- TABLE 80: Italy Recent Past, Current & Future Analysis for Spatial Computing by Component - Spatial Computing Hardware, Spatial Computing Software and Spatial Computing Services - Independent Analysis of Annual Revenues in US$ Million for the Years 2024 through 2030 and % CAGR
- TABLE 81: Italy 6-Year Perspective for Spatial Computing by Component - Percentage Breakdown of Value Revenues for Spatial Computing Hardware, Spatial Computing Software and Spatial Computing Services for the Years 2025 & 2030
- TABLE 82: Italy Recent Past, Current & Future Analysis for Spatial Computing by Technology - Augmented Reality (AR) Technology, Virtual Reality (VR) Technology, Internet of Things (IoT) Technology, Artificial Intelligence (AI) Technology, Mixed Reality (MR) Technology and Other Technologies - Independent Analysis of Annual Revenues in US$ Million for the Years 2024 through 2030 and % CAGR
- TABLE 83: Italy 6-Year Perspective for Spatial Computing by Technology - Percentage Breakdown of Value Revenues for Augmented Reality (AR) Technology, Virtual Reality (VR) Technology, Internet of Things (IoT) Technology, Artificial Intelligence (AI) Technology, Mixed Reality (MR) Technology and Other Technologies for the Years 2025 & 2030
- TABLE 84: Italy Recent Past, Current & Future Analysis for Spatial Computing by End-Use - Healthcare End-Use, Media & Entertainment End-Use, Manufacturing End-Use, Retail & eCommerce End-Use, Education & Training End-Use, Real Estate End-Use and Other End-Uses - Independent Analysis of Annual Revenues in US$ Million for the Years 2024 through 2030 and % CAGR
- TABLE 85: Italy 6-Year Perspective for Spatial Computing by End-Use - Percentage Breakdown of Value Revenues for Healthcare End-Use, Media & Entertainment End-Use, Manufacturing End-Use, Retail & eCommerce End-Use, Education & Training End-Use, Real Estate End-Use and Other End-Uses for the Years 2025 & 2030
- UNITED KINGDOM
- Spatial Computing Market Presence - Strong/Active/Niche/Trivial - Key Competitors in the United Kingdom for 2025 (E)
- TABLE 86: UK Recent Past, Current & Future Analysis for Spatial Computing by Component - Spatial Computing Hardware, Spatial Computing Software and Spatial Computing Services - Independent Analysis of Annual Revenues in US$ Million for the Years 2024 through 2030 and % CAGR
- TABLE 87: UK 6-Year Perspective for Spatial Computing by Component - Percentage Breakdown of Value Revenues for Spatial Computing Hardware, Spatial Computing Software and Spatial Computing Services for the Years 2025 & 2030
- TABLE 88: UK Recent Past, Current & Future Analysis for Spatial Computing by Technology - Augmented Reality (AR) Technology, Virtual Reality (VR) Technology, Internet of Things (IoT) Technology, Artificial Intelligence (AI) Technology, Mixed Reality (MR) Technology and Other Technologies - Independent Analysis of Annual Revenues in US$ Million for the Years 2024 through 2030 and % CAGR
- TABLE 89: UK 6-Year Perspective for Spatial Computing by Technology - Percentage Breakdown of Value Revenues for Augmented Reality (AR) Technology, Virtual Reality (VR) Technology, Internet of Things (IoT) Technology, Artificial Intelligence (AI) Technology, Mixed Reality (MR) Technology and Other Technologies for the Years 2025 & 2030
- TABLE 90: UK Recent Past, Current & Future Analysis for Spatial Computing by End-Use - Healthcare End-Use, Media & Entertainment End-Use, Manufacturing End-Use, Retail & eCommerce End-Use, Education & Training End-Use, Real Estate End-Use and Other End-Uses - Independent Analysis of Annual Revenues in US$ Million for the Years 2024 through 2030 and % CAGR
- TABLE 91: UK 6-Year Perspective for Spatial Computing by End-Use - Percentage Breakdown of Value Revenues for Healthcare End-Use, Media & Entertainment End-Use, Manufacturing End-Use, Retail & eCommerce End-Use, Education & Training End-Use, Real Estate End-Use and Other End-Uses for the Years 2025 & 2030
- REST OF EUROPE
- TABLE 92: Rest of Europe Recent Past, Current & Future Analysis for Spatial Computing by Component - Spatial Computing Hardware, Spatial Computing Software and Spatial Computing Services - Independent Analysis of Annual Revenues in US$ Million for the Years 2024 through 2030 and % CAGR
- TABLE 93: Rest of Europe 6-Year Perspective for Spatial Computing by Component - Percentage Breakdown of Value Revenues for Spatial Computing Hardware, Spatial Computing Software and Spatial Computing Services for the Years 2025 & 2030
- TABLE 94: Rest of Europe Recent Past, Current & Future Analysis for Spatial Computing by Technology - Augmented Reality (AR) Technology, Virtual Reality (VR) Technology, Internet of Things (IoT) Technology, Artificial Intelligence (AI) Technology, Mixed Reality (MR) Technology and Other Technologies - Independent Analysis of Annual Revenues in US$ Million for the Years 2024 through 2030 and % CAGR
- TABLE 95: Rest of Europe 6-Year Perspective for Spatial Computing by Technology - Percentage Breakdown of Value Revenues for Augmented Reality (AR) Technology, Virtual Reality (VR) Technology, Internet of Things (IoT) Technology, Artificial Intelligence (AI) Technology, Mixed Reality (MR) Technology and Other Technologies for the Years 2025 & 2030
- TABLE 96: Rest of Europe Recent Past, Current & Future Analysis for Spatial Computing by End-Use - Healthcare End-Use, Media & Entertainment End-Use, Manufacturing End-Use, Retail & eCommerce End-Use, Education & Training End-Use, Real Estate End-Use and Other End-Uses - Independent Analysis of Annual Revenues in US$ Million for the Years 2024 through 2030 and % CAGR
- TABLE 97: Rest of Europe 6-Year Perspective for Spatial Computing by End-Use - Percentage Breakdown of Value Revenues for Healthcare End-Use, Media & Entertainment End-Use, Manufacturing End-Use, Retail & eCommerce End-Use, Education & Training End-Use, Real Estate End-Use and Other End-Uses for the Years 2025 & 2030
- ASIA-PACIFIC
- Spatial Computing Market Presence - Strong/Active/Niche/Trivial - Key Competitors in Asia-Pacific for 2025 (E)
- TABLE 98: Asia-Pacific Recent Past, Current & Future Analysis for Spatial Computing by Component - Spatial Computing Hardware, Spatial Computing Software and Spatial Computing Services - Independent Analysis of Annual Revenues in US$ Million for the Years 2024 through 2030 and % CAGR
- TABLE 99: Asia-Pacific 6-Year Perspective for Spatial Computing by Component - Percentage Breakdown of Value Revenues for Spatial Computing Hardware, Spatial Computing Software and Spatial Computing Services for the Years 2025 & 2030
- TABLE 100: Asia-Pacific Recent Past, Current & Future Analysis for Spatial Computing by Technology - Augmented Reality (AR) Technology, Virtual Reality (VR) Technology, Internet of Things (IoT) Technology, Artificial Intelligence (AI) Technology, Mixed Reality (MR) Technology and Other Technologies - Independent Analysis of Annual Revenues in US$ Million for the Years 2024 through 2030 and % CAGR
- TABLE 101: Asia-Pacific 6-Year Perspective for Spatial Computing by Technology - Percentage Breakdown of Value Revenues for Augmented Reality (AR) Technology, Virtual Reality (VR) Technology, Internet of Things (IoT) Technology, Artificial Intelligence (AI) Technology, Mixed Reality (MR) Technology and Other Technologies for the Years 2025 & 2030
- TABLE 102: Asia-Pacific Recent Past, Current & Future Analysis for Spatial Computing by End-Use - Healthcare End-Use, Media & Entertainment End-Use, Manufacturing End-Use, Retail & eCommerce End-Use, Education & Training End-Use, Real Estate End-Use and Other End-Uses - Independent Analysis of Annual Revenues in US$ Million for the Years 2024 through 2030 and % CAGR
- TABLE 103: Asia-Pacific 6-Year Perspective for Spatial Computing by End-Use - Percentage Breakdown of Value Revenues for Healthcare End-Use, Media & Entertainment End-Use, Manufacturing End-Use, Retail & eCommerce End-Use, Education & Training End-Use, Real Estate End-Use and Other End-Uses for the Years 2025 & 2030
- REST OF WORLD
- TABLE 104: Rest of World Recent Past, Current & Future Analysis for Spatial Computing by Component - Spatial Computing Hardware, Spatial Computing Software and Spatial Computing Services - Independent Analysis of Annual Revenues in US$ Million for the Years 2024 through 2030 and % CAGR
- TABLE 105: Rest of World 6-Year Perspective for Spatial Computing by Component - Percentage Breakdown of Value Revenues for Spatial Computing Hardware, Spatial Computing Software and Spatial Computing Services for the Years 2025 & 2030
- TABLE 106: Rest of World Recent Past, Current & Future Analysis for Spatial Computing by Technology - Augmented Reality (AR) Technology, Virtual Reality (VR) Technology, Internet of Things (IoT) Technology, Artificial Intelligence (AI) Technology, Mixed Reality (MR) Technology and Other Technologies - Independent Analysis of Annual Revenues in US$ Million for the Years 2024 through 2030 and % CAGR
- TABLE 107: Rest of World 6-Year Perspective for Spatial Computing by Technology - Percentage Breakdown of Value Revenues for Augmented Reality (AR) Technology, Virtual Reality (VR) Technology, Internet of Things (IoT) Technology, Artificial Intelligence (AI) Technology, Mixed Reality (MR) Technology and Other Technologies for the Years 2025 & 2030
- TABLE 108: Rest of World Recent Past, Current & Future Analysis for Spatial Computing by End-Use - Healthcare End-Use, Media & Entertainment End-Use, Manufacturing End-Use, Retail & eCommerce End-Use, Education & Training End-Use, Real Estate End-Use and Other End-Uses - Independent Analysis of Annual Revenues in US$ Million for the Years 2024 through 2030 and % CAGR
- TABLE 109: Rest of World 6-Year Perspective for Spatial Computing by End-Use - Percentage Breakdown of Value Revenues for Healthcare End-Use, Media & Entertainment End-Use, Manufacturing End-Use, Retail & eCommerce End-Use, Education & Training End-Use, Real Estate End-Use and Other End-Uses for the Years 2025 & 2030

